



1. Introduction
Plasma behaviour in a magnetic field is the oldest problem in gas-discharge physics. The effect of the magnetic field on the gas-discharge plasma has been investigated since the middle of the last century (Spitzer Reference Spitzer1958; Sakharov Reference Sakharov1959). The confinement of high-temperature plasma by the magnetic field is still of great interest to scholars worldwide (Blewin and Haydon Reference Blewin and Haydon1958; Harcombe, Palmer & Gozna Reference Harcombe, Palmer and Gozna1963; Huxley and Crompton Reference Huxley and Crompton1974; Ness Reference Ness1994; White, Robson & Ness Reference White, Robson and Ness1999; Ness and Makabe Reference Ness and Makabe2000; Raspopovic et al. Reference Raspopovic, Sakadzic, Petrovic and Makabe2000; Shidoji, Makabe & Ness Reference Shidoji, Makabe and Ness2001; Dujko, Raspopovic & Petrovic Reference Dujko, Raspopovic and Petrovic2005; Hettkamp and Lindemann Reference Hettkamp and Lindemann2007; Bobrov et al. Reference Bobrov, Voiteshonok, Golovin, Golubev, Lomakin, Turkin and Shloydo2013; Dujko et al. Reference Dujko, Bosnjakovic, White and Petrovic2015; Omarov et al. Reference Omarov, Omarova, Omarova and Rukhadze2018; Limpens et al. Reference Limpens, Platier, Lassise, Staps, van Ninhuijs, Luiten and Beckers2021; Starikovskiy, Aleksandrov & Shneider Reference Starikovskiy, Aleksandrov and Shneider2021; Gao and Fang Reference Gao and Fang2022; Rodríguez, Paul & Bhattacharjee Reference Rodríguez, Paul and Bhattacharjee2022; Wang et al. Reference Wang, Cheng, Shi, Yan, Huang, Wu, Zou, Zhu, Chen and Dong2022; Li et al. Reference Li, Fu, Zhang, Liu, Hu, Zou, Wang and Jiang2023). The influence of the magnetic field on low-temperature plasma of various types of discharges, such as glow discharge (Blewin and Haydon Reference Blewin and Haydon1958), arc discharge (Hettkamp and Lindemann Reference Hettkamp and Lindemann2007), corona discharge (Gao and Fang Reference Gao and Fang2022), pulse discharge (Li et al. Reference Li, Fu, Zhang, Liu, Hu, Zou, Wang and Jiang2023) and after glow discharge (Limpens et al. Reference Limpens, Platier, Lassise, Staps, van Ninhuijs, Luiten and Beckers2021) is also extensively studied. Early studies (Blewin and Haydon Reference Blewin and Haydon1958; Hettkamp and Lindemann Reference Hettkamp and Lindemann2007; Gao and Fang Reference Gao and Fang2022; Li et al. Reference Li, Fu, Zhang, Liu, Hu, Zou, Wang and Jiang2023) showed that the effect of the magnetic field has the same effect as an increase of the gas pressure. Experiments have shown that the initial electron initiation has a decisive effect on the breakdown development process. The application of a magnetic field can reduce the breakdown voltage from tens of kilovolts to a few hundred volts in some gases (Harcombe et al. Reference Harcombe, Palmer and Gozna1963). Huxley and Crompton summarized the theoretical and experimental descriptions of the behaviour of charged particle swarms in gases in the presence of electric and magnetic fields (Huxley and Crompton Reference Huxley and Crompton1974). Omarov et al. showed that the magnetic field leads not only to an increase in the current density and conductivity, but also a decrease in the time of the arc discharge formation and the rate of expansion of the discharge channel (Omarov et al. Reference Omarov, Omarova, Omarova and Rukhadze2018). Starikovskiy et al. numerically simulated the development of a streamer discharge in a gap with an external longitudinal magnetic field to demonstrate the self-focusing of such discharges (Starikovskiy et al. Reference Starikovskiy, Aleksandrov and Shneider2021).
Under a magnetic field, the electrons and ions under a Lorentz force in a gas-discharge plasma do not move in straight lines but move in helical trajectories around the magnetic field lines with radius r, called the Larmor radius

where ${\upsilon _ \bot }$ is the velocity component of the particle perpendicular to the direction of the magnetic field B, q is the charge of the particle and m is the mass of the charged particle (electron or ion). The Larmor radius for electrons and ions in our conditions has the following value:${r_{\textrm{Le}}} = 8.43 \cdot {10^{ - 6}}\;\textrm{m}$
 and ${r_{\textrm{Li}}} = 2.28 \cdot {10^{ - 4}}\;\textrm{m}$
 . The magnetic field affects the plasma transfer to the chamber wall and subsequently influences the ionization balance and the spatial distribution of the plasma. In fact, due to the decrease in plasma losses on the wall, the ionization frequency of a gas-discharge plasma under a magnetic field decreases.
The behaviour of charged particles in electric and magnetic fields plays a crucial role in low-temperature plasma processing devices (Ness and Makabe Reference Ness and Makabe2000). Shidoji et al. (Reference Shidoji, Makabe and Ness2001) attempted to overcome the limitations of the two-term approximation by extending the two-term theory given in the work of (=Huxley and Crompton (Reference Huxley and Crompton1974), but their approach has a severely limited application (White et al. Reference White, Robson and Ness1999). Further, Ness presented a numerical solution for electrons and light ions undergoing conservative interactions under perpendicular electric and magnetic fields (Ness Reference Ness1994). Monte Carlo simulations have been extensively used for electron transport in gases in the presence of electric and magnetic fields (Raspopovic et al. Reference Raspopovic, Sakadzic, Petrovic and Makabe2000; Dujko et al. Reference Dujko, Raspopovic and Petrovic2005). The application of a magnetic field leads to complex transport data behaviours, changes in the relaxation speed and the shape of the electron energy distribution function (EEDF) by depopulation of the high-energy electrons from the tail of the EEDF and reduction of the mean energy, the longitudinal component of the drift velocity and collisional rates (Dujko et al. Reference Dujko, Raspopovic and Petrovic2005; Reference Dujko, Bosnjakovic, White and Petrovic2015).
Pulsed discharges in helium and mixtures of helium with other gases at medium gas pressures (no more than 100 Torr) are widely used in practical applications, for example, electron beam generation in the process of electrical breakdown (Bobrov et al. Reference Bobrov, Voiteshonok, Golovin, Golubev, Lomakin, Turkin and Shloydo2013) and in other technical devices based on dielectric barrier discharges (Brandenburg Reference Brandenburg2017). In many technical applications, helium acts as a buffer gas. An external magnetic field on such discharges allows the control of the discharge characteristics by changing the magnetic field magnitude, providing additional relevance to such studies. Therefore, the numerical study of the effect of the magnetic field on a pulsed plasma discharge in helium is of interest both from a practical and a theoretical point of view.
In this study, the effect of the transverse magnetic field on the plasma characteristics of high-voltage pulsed discharge in helium under a pressure 30 Torr is investigated. In addition, the spatio-temporal dynamics of the electron density in the discharge gap with or without the transverse magnetic field is studied.
2. Methods
To study the effect of a transverse magnetic field on the gas-discharge breakdown and plasma properties in helium, experiments and numerical simulations are conducted. The experimental set-up comprises a discharge chamber, a gas pumping system, permanent magnets, two high-voltage rectifiers and a synchronization and start-up unit. Figure 1 displays the structure of the gas-discharge chamber. The gas-discharge chamber constitutes stainless steel hemispherical electrodes with a diameter of 8 mm that are located at gaps of 4 mm inside a quartz tube. The permanent magnets located over the gap yield a magnetic field with a value of $B = 0.4\;\textrm{T}$ between the electrodes. The dimensions of the magnets are as follows: width of 80 mm, length of 100 mm and thickness of 20 mm. The dimensions of the magnets significantly exceed the discharge gap size, and the movement of magnets in different directions within 10 mm does not affect the discharge characteristics, which indirectly confirms the uniformity of the magnetic field in the discharge region. Ashurbekov et al. comprehensively studied the effect of impurities on the characteristics of a pulsed discharge in helium using mass spectrometry for monitoring the ion composition. They experimentally showed that even the presence of an insignificant amount of impurities significantly decreases the densities of metastable atoms and molecular helium ions (Ashurbekov et al. Reference Ashurbekov, Kurbanismailov, Omarov and Omarova2000). In this study, the experiments are conducted under well-controlled laboratory conditions. The discharge chamber is pumped out by a pre-vacuum pump with 10−3 Torr pressure and then by a turbomolecular high-pressure pump with 10−4 Torr pressure. Moreover, to prevent the effect of the residual gas, the discharge chamber is repeatedly pumped with spectrally pure helium before studying the discharge characteristics.
Structure of the gas-discharge chamber.

A numerical two-dimensional (2-D) fluid model in COMSOL Multiphysics (2023) is established to analyse the effect of a transverse magnetic field on the gas-discharge characteristics and to study the dynamics of the initial stage of discharge development. The numerical model of the gas-discharge chamber corresponds both in size and design to the real geometry shown in figures 1 and 2.
Geometry of the numerical model of the gas-discharge chamber.

The continuity equation for electron density ${n_e}$ (2023; Hagelaar and Pitchford Reference Hagelaar and Pitchford2005)

where ${\mu _e}$ is the electron mobility, $\boldsymbol{E}$
 is the electric field, ${\boldsymbol{D}_e}$
 is the diffusion coefficient for electrons and ${R_e}$
 is the electron source term. For electron swarm/transport parameters, look-up tables from the solution of the Boltzmann equation for EEDF in the two-term approximation (Hagelaar and Pitchford Reference Hagelaar and Pitchford2005; Starikovskiy et al. Reference Starikovskiy, Aleksandrov and Shneider2021) with the IST-Lisbon database are employed (Alves Reference Alves2014). Herein, the two-term approximation is used to solve the Boltzmann kinetic equation as the anisotropy degree of EEDF does not increase even under a strong magnetic field. More details about the applicability of the two-term approximation for describing EEDF in a magnetic field are discussed in Starikovskiy et al. (Reference Starikovskiy, Aleksandrov and Shneider2021). In the simulation, the coefficients of direct and stepwise ionization are calculated by integrating the corresponding cross-sections of the processes with EEDF.
To describe the transport of heavy particles in COMSOL Multiphysics (2023), the simplified form of the Maxwell–Stefan equations is used, which correctly considers diffusive transport due to mole fraction and pressure and temperature gradients. In numerous situations, the Maxwell–Stefan equations are the only formulation conserving the total mass in the system. Conservation of mass dictates that the sum of the mass fractions of all the species must equal one. The transport equation for the jth component of the heavy non-electron particles is as follows:

where ${M_n}$ is the mean molar mass of the mixture, $\rho$
 is the density of the mixture, ${\omega _j}$
 is the mass fraction of the $j\textrm{th}$
 component, ${\mu _{j,m}}$
 is the mobility of the $j\textrm{th}$
 component, ${D_{j,m}}$
 is the mixture-averaged diffusion coefficient and ${R_j}$
 is the source term of the $j\textrm{th}$
 component.
The mean electron energy $\langle \varepsilon \rangle = {n_\varepsilon }/{n_e}$ is computed by solving the drift–diffusion equation for the electron energy density ${n_\varepsilon }$
 (2023; Hagelaar and Pitchford Reference Hagelaar and Pitchford2005)

where ${n_\varepsilon }$ is the electron energy density, ${\mu _\varepsilon }$
 is the energy mobility, ${\boldsymbol{D}_\varepsilon }$
 is the energy diffusivity and ${S_{\textrm{en}}}$
 is the energy loss or gain due to inelastic collisions.
The electric potential V is calculated by solving the Poisson equation

where ${\varepsilon _0} = 8,85 \cdot {10^{ - 12}}\;\textrm{F}\;{\textrm{m}^{ - 1}}$ is the electric constant and ${N^ + }$
 is the density of the positive particle. In our work, positive particles are the atomic ions $\textrm{H}{\textrm{e}^ + }$
 and molecular ions $\textrm{He}_2^ +$
 .
For a special case describing the behaviour of a weakly ionized plasma under a not strong magnetic field (until the ions are magnetized), if the frequency of elastic collisions does not depend on the electron energy at a fixed gas pressure, then the ionization frequency in a magnetic field only depends on the effective electric field ${\boldsymbol{E}_{\textrm{ef}}}$ (Tonks Reference Tonks1937; Golant, Zhilinsky & Sakharov Reference Golant, Zhilinsky and Sakharov1980; Scholfield, Gahl & Shimomura Reference Scholfield, Gahl and Shimomura1999; White et al. Reference White, Robson and Ness1999; Starikovskiy et al. Reference Starikovskiy, Aleksandrov and Shneider2021). Under these conditions, the magnetic and electric fields in the kinetic equation are only in combinations ${E^2}/(1 + {\omega ^2}/\nu _{\textrm{ea}}^2)$
 and the ionization frequency ${v_i}$
 depends only on the effective electric field ${\boldsymbol{E}_{\textrm{ef}}}$
 , since it is determined by the symmetric part of the EEDF, i.e. ${v_i}(\boldsymbol{E},\boldsymbol{B}) = {v_{i0}}({\boldsymbol{E}_{\textrm{ef}}})$
 . Therefore, to account for the effect of the magnetic field in (2.1)–(2.4), the electric field $\boldsymbol{E}$
 is replaced by the effective electric field ${\boldsymbol{E}_{\textrm{ef}}}$


where $\omega = qB/m$ is the electron cyclotron frequency in the magnetic field and ${v_{\textrm{ea}}}$
 is the electron transport collision frequency. Equation (2.5) is known as Tonks’ theorem (Tonks Reference Tonks1937), and according to it, the application of a magnetic field to a discharge qualitatively corresponds to an increase of the neutral density (pressure), which leads to a decrease of the mean energy. At high values of $E/N$
 and low values of $B/N$
 , the agreement between the results of Tonks’ theorem and exact Monte Carlo calculations is better (Dujko et al. Reference Dujko, Raspopovic and Petrovic2005). This procedure enables the consideration of the ionization relaxation processes in the presence of a transverse magnetic field. At low average electron energies (in the afterglow) for recombination relaxation, the introduction of an effective electric field may be incorrect due to the violation of the constancy of the elastic collision frequency under fixed gas pressure.
Therefore, based on the above assumptions, the ionization relaxation processes with and without a magnetic field can be described by the same equations; in the presence of a magnetic field, the electric field $\boldsymbol{E}$ is replaced by ${\boldsymbol{E}_{\textrm{ef}}}$
 and the electron mobility across the magnetic field is replaced by ${\mu _e} = {\mu _{e0}}/(1 + {\omega ^2}{\tau ^2})$
 , where ${\mu _{e0}}$
 is the electron mobility without the magnetic field. Thus, under the considered approximation, the influence of the magnetic field on the discharge characteristics can be described by changing the heating and kinetic coefficients of the electrons. Then, these kinetic and transport coefficients are employed in the fluid model.
To solve (2.1)–(2.4), they need to be supplemented with the initial and boundary conditions. The following initial and boundary conditions are employed herein:
• Initial electron density: ${n_e}(t = 0,x,y) = {10^{14}}\;{\textrm{m}^{ - 3}}$
 . As the experiments are conducted in the frequency-periodic mode with a frequency of 50–100 Hz, the electrons with a density of approximately ${\sim} {10^{14}}- {10^{15}}\;{\textrm{m}^{ - 3}}$ from the previous discharge pulses remain in the form of a charge deposited on the walls of the discharge chamber and in a discharge volume where the chemoionization processes are taking place, which plays the role of preliminary ionization (Ashurbekov, Iminov & Ramazanov Reference Ashurbekov, Iminov and Ramazanov2017). In such conditions, the choice of a large initial electron density in the simulation is justified.
• Initial mean electron energy: $\varepsilon = 4\;\textrm{eV}$
.• Boundary condition for the cathode: $V = 0$
. The secondary electron emission at the cathode is also considered; it is ${\gamma _i} = 0.15$.• Boundary condition for the anode: $V = U(t)$
. The potential at the anode walls is the same as that in the experiment (figure 4).


In the model, the following species are considered: helium atom in the ground state: $\textrm{He}({1^1}S)$ ; two metastable atoms: $\textrm{H}{\textrm{e}^\ast }(1)({2^3}S),\;\textrm{H}{\textrm{e}^\ast }(2)({2^1}S)$
 ; two radiative atoms: $\textrm{H}{\textrm{e}^\ast }(3)({2^3}P),\;\textrm{H}{\textrm{e}^\ast }(4)({2^1}P)$
 ; atomic ion: $\textrm{H}{\textrm{e}^ + }$
 ; two excimer molecules: metastable $\textrm{He}_2^\ast (1){(^3}\sum _u^ + )$
 and radiative $\textrm{He}_2^\ast (2){(^1}\sum _u^ + )$
 ; and molecular ion: $\textrm{He}_2^ +$
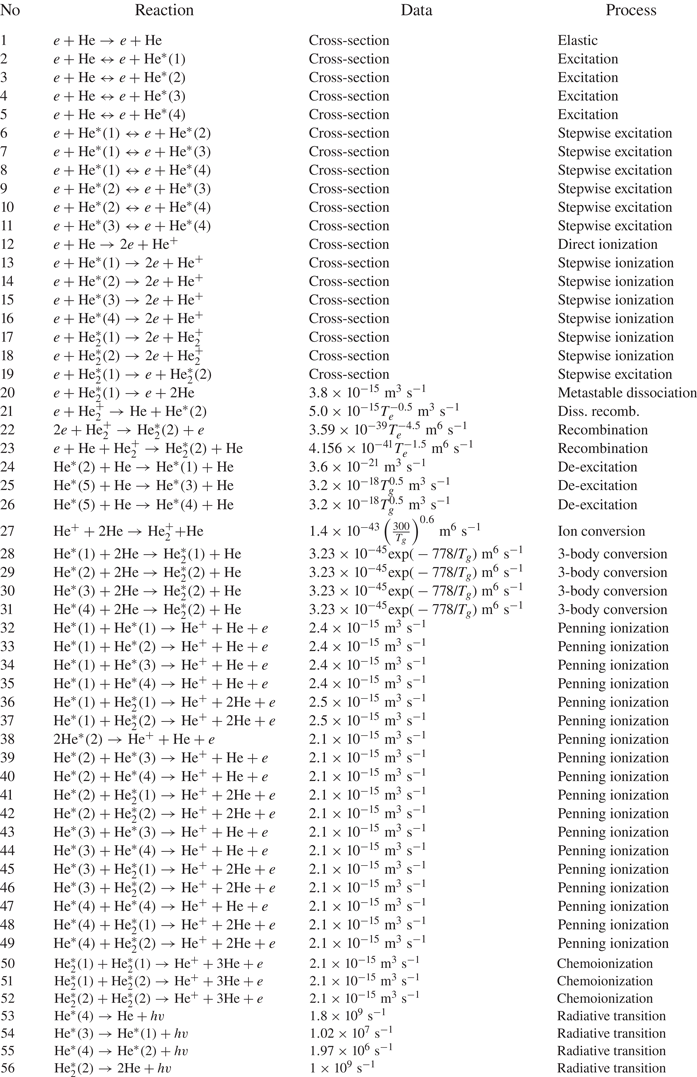
 . Table 1 presents the 56 plasma-chemical reactions, together with their cross-section or rate constants. Note that the model considers collisions with not only electrons but also heavy particles, including molecules; these are the processes of ion conversion, molecular conversion and Penning ionization. At high pressures, processes involving molecules can significantly affect the helium plasma discharge (Kutasi, Hartmann & Donko Reference Kutasi, Hartmann and Donko2001). In the table, the superelastic collisions of electrons with excited atoms leading to the de-excitation of the level are indicated by reverse arrows (reactions 2–16). In the afterglow of pulsed discharges in helium, the proportion of molecular ions $\textrm{He}_2^ +$
 can reach tens of per cent of the total number of charged particles, but in the discharge itself, their proportion is small due to their dissociation via electron impact (Ashurbekov et al. Reference Ashurbekov, Kurbanismailov, Omarov and Omarova2000). Therefore, associative ionization is not considered in this study.
Plasma-chemical reactions used in the helium plasma model (Kutasi et al. Reference Kutasi, Hartmann and Donko2001; Belmonte et al. Reference Belmonte, Cardoso, Henrion and Kosior2007; Bogdanov et al. Reference Bogdanov, Kapustin, Kudryavtsev and Chirtsov2010; Alves Reference Alves2014; Santos et al. Reference Santos, Noel, Belmonte and Alves2014). Here, T e is the electron temperature in eV and T g is the gas temperature in K.
To solve the system of partial differential equations (2.1)–(2.4), a discrete grid that covers the entire computational domain is manually plotted. Figure 3 displays the discrete grid in the simulation region and the electron density at t = 200 ns, calculated without an external constant magnetic field. A large density gradient of charged particles and a strong reduction of the potential are observed near the cathode surface. Therefore, as shown in figure 3, to avoid the occurrence of singularities and solve the problem, a very fine grid is constructed around the electrodes. Figure 3 shows that the mesh quality around the electrodes is high (right legend bar). The mesh comprises 85 076 elements, where the minimum quality of the elements is 0.44 and the minimum mesh size is 0.04 mm (minimum element size).
Discrete grid in the simulation region and the electron density at t = 200 ns.

3. Results and discussion
To study the effect of a magnetic field on the gas-discharge breakdown and plasma parameters, high-voltage pulse discharge in helium under a pressure range of 5–40 Torr is considered. The considered high-voltage pulses have a range of 1–5 kV with a rise time of approximately 80 ns, and a half-height duration of 400 ns is applied to the discharge gap (figure 3). The pulse repetition rate is 50 Hz. The magnitude of the external magnetic field is $B = 0.4\;\textrm{T}$ . The experiments are conducted in the gas pressure range of 5–40 Torr, but the simulation is only conducted at the pressure of 30 Torr. This pressure mode is chosen to simplify the simulation process, since all plasma-chemical processes, i.e. the formation of excited molecules and molecular helium ions and their effect on plasma parameters, need to be considered at higher pressures. The incorporation of all the processes leads to model complications and necessitates large computing resources. Note that when performing calculations at low pressures, non-local effects need to be considered and the assumption of the Maxwell distribution function is not correct.
Figure 4 shows the experimentally obtained applied voltage and discharge current at a pressure of 30 Torr under $B = 0.4\;\textrm{T}$ and $B = 0$
 . The figure shows that, for $B = 0$
 and $B = 0.4\;\textrm{T}$
 , the measured current reaches its maximum after 350 and 270 ns, respectively. Moreover, the maximum current is higher for $B = 0.4\;\textrm{T}$
 than that for $B = 0$
 .
Applied voltage and discharge currents of the high-voltage pulsed discharge in helium obtained from the experiment conducted at the pressure of 30 Torr.

Figure 5 shows the applied voltage and discharge current obtained from the simulation for $B = 0.4\;\textrm{T}$ and $B = 0$
 .
Applied voltage and discharge currents of the high-voltage pulsed discharge in helium obtained from the simulation conducted at the pressure of 30 Torr.
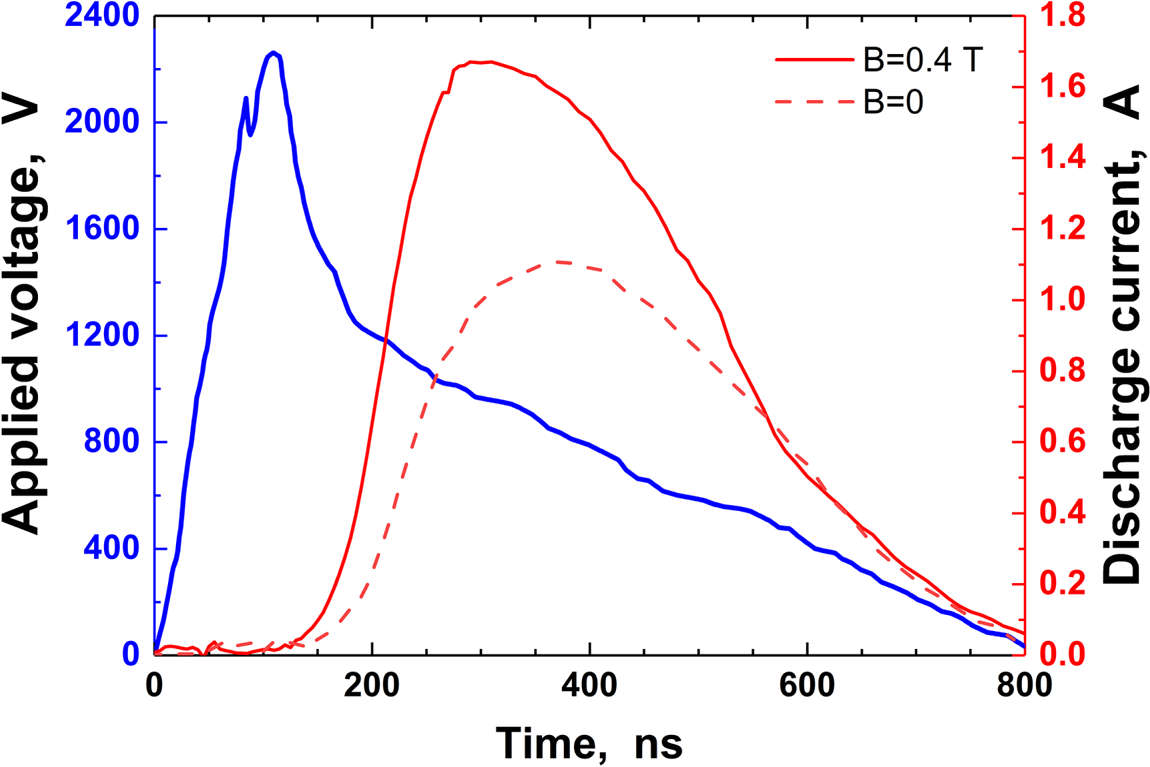
Figure 4 shows that, at the initial stage of the discharge, two short current pulses are present: weak and strong. In our opinion, the appearance of the weak current pulse stems partly from the capacitive current and partly from the rapid transfer of electrons previously deposited on dielectric surfaces and electrodes. The second short maximum of the current, preceding the main maximum, arises from the non-locality and relaxation of the energy of fast electrons in the initial stages of the discharge. Unfortunately, the proposed model does not consider these effects, but the results quantitatively coincide. For example, for $B = 0$ , the maximum discharge current obtained from the experiment (figure 4) and simulation exhibits good agreement (approximately 1.1–1.2 A). Figures 4 and 5 show that, for $B = 0.4\;\textrm{T}$
 , the maximum value of the discharge current is greater than that for $B = 0$
 , i.e. the magnetic field leads to the increase of the discharge current (figure 5).
Figures 4 and 5 show that, in the presence of a magnetic field, the breakdown time slightly decreases. It was shown that the magnetic field strongly affects the characteristics of the left-hand side of the breakdown Paschen curve (Li and Uhm Reference Li and Uhm2004). In the low-pressure regime, the breakdown voltage decreases with increasing magnetic flux density, and the position of the breakdown minimum shifts due to the magnetic field. Since the mass of a positive ion is considerably greater than that of an electron, the magnetic field exerts a more appreciable influence on electron motion than on the motion of positive ions. Radmilović-Radjenović and Radjenović (Reference Radmilović-Radjenović and Radjenović2006) presented an empirical expression describing the variation of the secondary electron yield with the magnetic field.
Figure 6 displays the dynamics of the electron density distribution in the discharge gap in helium (left-hand side at $B = 0$ and right-hand side at $B = 0.4\;\textrm{T}$
 ). The figure shows that the presence of an external magnetic field leads to a decrease in the breakdown time of the discharge gap. At the initial moment (t = 40 ns), the electron density is aggregated at the anode. Figure 7 shows the distribution of electron density along the symmetry axis between the electrodes in helium at the pressure of 30 Torr at different points in time. Figure 7 shows that the maximum electron density in the presence of the magnetic field reaches $3 \times {10^{19}}\;{\textrm{m}^{ - 3}}$
 at t = 290 ns and in the absence of the magnetic field reaches $1.4 \times {10^{19}}\;{\textrm{m}^{ - 3}}$
 at t = 350 ns.
Dynamics of the electron density distribution in the discharge gap in helium at the pressure of 30 Torr; (a,c,e) for $B = 0$ , and (b,d,f) for $B = 0.4\;\textrm{T}$
 .

Distribution of electron density along the symmetry axis between the electrodes in helium at the pressure of 30 Torr at different points in time; (a) for $B = 0$ , (b) for $B = 0.4\;\textrm{T}$
 .

4. Conclusion
In summary, this study presented a simple 2-D fluid-plasma model to consider the effect of an external transverse magnetic field on the high-voltage pulsed discharge in helium. The dynamics of the development of the discharge in the gas-discharge chamber in the case of the presence and absence of a magnetic field is investigated. The results of the experiments and simulation conducted at the pressure of 30 Torr were presented. The results of the simulation performed using an empirical relation for the effective field, which allows the consideration of the influence of the magnetic field on the plasma, agreed well with the experimental results. Moreover, the dynamics of the development of the discharge in the absence and presence of a magnetic field was investigated. The results showed that the presence of a magnetic field leads to the enhancement of the discharge current and plasma density.
In conclusion, all possible plasma-chemical processes in helium, the accurate electron kinetics near the cathode region and all possible non-local effects need to be considered. This will be focused on in our next work.
Acknowledgements
Editor Edward Thomas, Jr. thanks the referees for their advice in evaluating this article.
Declaration of interests
The authors report no conflict of interest.
Funding
This work was partially supported by State Assignment No. FZNZ–2020–0002.



