INTRODUCTION
Temperate climates have conditions that favour grass growth throughout most of the year, though the rate of grass growth across the year is variable and influenced by many factors. In Ireland, grass provides beef cattle and dairy cows with a cheap feed source (O'Kiely Reference O'Kiely1994; Dillon et al. Reference Dillon, Roche, Shalloo, Horan and Murphy2005; Finneran et al. Reference Finneran, Crosson, O'Kiely, Shalloo, Forristal and Wallace2010), which results in a competitive advantage for Ireland compared with much of mainland Europe in terms of low-cost animal production. Dairy and suckler beef herds in Ireland are predominantly spring calving with cows turned out to grass post-calving, usually in February/March and remaining at grass until October/November. Grass can provide more than 0·70 of the diet of dairy cows in Ireland (Dillon et al. Reference Dillon, Roche, Shalloo, Horan and Murphy2005). Dillon et al. (Reference Dillon, Roche, Shalloo, Horan and Murphy2005) showed that, regardless of country, a 10% increase in total grass utilized in a dairy production system reduces the cost of milk produced by €0·025 per litre.
In temperate regions, grass swards cover the ground almost completely and light energy is received throughout the year, maintaining sward growth, provided soil temperatures are not lower than 5 °C and soil moisture content is not limiting (Hopkins Reference Hopkins and Hopkins2000). However, in reality, there are marked seasonal variations in herbage production, both within and between years, mainly due to meteorological factors (Keane & Collins Reference Keane and Collins2004; Trnka et al. Reference Trnka, Eitzinger, Dubrovský, Semerádová, Štěpánek, Hlavinka, Balek, Skalák, Farda, Formayer and Žalud2010), as well as soil conditions (Houlbrooke et al. Reference Houlbrooke, Paton, Littlejohn and Morton2011) and management factors such as fertilizer application, grazing intensity and rotation length (Garcia-Launay et al. Reference Garcia-launay, Sibra, Molénat, Agabriel and Brunschwig2012). Grass growth in Ireland is highly seasonal, with little or no growth over the winter period due to low temperatures and low levels of solar radiation; peak grass growth occurs in late spring/early summer (during and after flowering), and growth is restricted in late summer and autumn, as temperature and solar radiation decrease (Brereton Reference Brereton and Keane1992). Soil moisture deficits can also occasionally restrict grass growth during summer, particularly on free-draining soils. Conversely, excess soil water, or soil moisture saturation, may also restrict grass growth (Schulte et al. Reference Schulte, Richards, Daly, Kurz, McDonald and Holden2006).
Due to variations in grass growth within and between years, feed budgeting at farm level is difficult. While there is extensive research focusing on the efficient use of grazed grass at farm level in an Irish context, there has been a lack of model development for grass growth prediction to forecast grass growth accurately, allowing better management around the variability of feed supply. The development of such a model would help identify feed surpluses and deficits, and therefore increase the accuracy of management decisions.
Many grass growth models have been developed for perennial ryegrass swards, varying from simple empirical (e.g. Brereton et al. Reference Brereton, Danielov and Scott1996) to more complex mechanistic models (e.g. Johnson & Thornley Reference Johnson and Thornley1983; LINGRA model, Schapendonk et al. Reference Schapendonk, Stol, Van Kraalingen and Bouman1998; Pasture Quality Model, Woodward Reference Woodward2001; STICS, Brisson et al. Reference Brisson, Gary, Justes, Roche, Mary, Ripoche, Zimmer, Sierra, Bertuzzi, Burger, Bussière, Cabidoche, Cellier, Debaeke, Gaudillère, Hénault, Maraux, Seguin and Sinoquet2003; Jouven et al. Reference Jouven, Carrère and Baumont2006). The application of an empirical model is restricted to the prediction of grass growth within the conditions to which the original dataset is related. As a result, empirical models work better at a site-specific level. Alternatively, given the correct inputs, a mechanistic model is more likely to be effective across a range of conditions and sites (Thornley Reference Thornley1998). Regardless of type or process of the model, one that can predict grass growth accurately could be used by grassland farmers and advisors to provide information to assist grazing management, e.g. short-term management decisions based around increases or decreases in grass growth or longer term feed budgeting. Predicting grass growth will also contribute to whole farm and systems modelling (Barrett et al. Reference Barrett, Laidlaw and Mayne2004).
The objective of the present study was to evaluate the accuracy of prediction of three grass growth models and to identify their strengths and weaknesses in modelling grass growth in the Irish scenario, using climatic and grass growth data from the Teagasc Animal and Grassland Research and Innovation Centre, Moorepark, Fermoy, Co. Cork, Ireland (hereafter referred to as Moorepark) over a 5-year period (2005–9).
MATERIALS AND METHODS
Models
Three grass growth models developed for perennial ryegrass (Lolium perenne L.) swards in temperate climates, differing in region of origin and mechanisms, were selected for evaluation of their accuracy of grass growth prediction. In selecting the models, the key factor was the availability of a published model description, with clear descriptions of the equations included; the availability of code was also a consideration. The models were a mechanistic model developed in England by Johnson & Thornley (Reference Johnson and Thornley1983), hereafter referred to as the J&T model, a mechanistic model developed in France by Jouven et al. (Reference Jouven, Carrère and Baumont2006), hereafter referred to as the J model, and an empirical model developed in Ireland by Brereton et al. (Reference Brereton, Danielov and Scott1996), hereafter referred to as the B model. All the models were implemented in Microsoft Office Excel spreadsheets.
J&T model
The J&T model is mechanistic and dynamic, and is used to simulate the time course of dry matter (DM) and leaf area development in a daily time step. It considers crops exposed to a constant environment (e.g. temperate climate), a seasonally varying environment (e.g. meteorological conditions, seasons and extreme events) and defoliation (Johnson & Thornley Reference Johnson and Thornley1983). This provides a means of understanding grass growth as an integrated system of interacting component processes considering the individual plant and the whole crop.
The J&T model is a vegetative crop growth model, incorporating leaf area expansion and senescence, and does not take account of the reproductive stage of grass growth. This model was developed in England, a similar climatic area to Ireland, where it was assumed that soil water and nitrogen were relatively unimportant for an established grass crop under favourable conditions. It explains the process of grass growth very well, including the flow of leaf material from one age category to the next. The innovative aspect of the model is its approach to leaf area expansion. Leaf area index (LAI) is considered as an independent state variable, which is flexibly related to crop dry weight by an empirical equation. Furthermore, a storage pool is used to control incremental specific leaf area, and this provides a buffer against environmental fluctuations. In the model, different maintenance coefficients are ascribed to different age categories of plant material. The rate of leaf appearance parameter, the growth coefficient and the maintenance coefficients are assumed to increase with increasing temperature and they follow a linear equation with temperature. The above-ground DM is assumed to occupy four compartments: growing leaves, first fully expanded leaves, second fully expanded leaves and senescing leaves. It is assumed in this model that water and nutrients such as nitrogen (N) are not limiting. Daily total gross photosynthesis is calculated over the light period, which is assumed to be distributed uniformly over 24 h; therefore, no account is taken of diurnal fluctuations (Johnson & Thornley Reference Johnson and Thornley1983). An increase in light flux density causes an increase in photosynthesis, and therefore, greater yield.
Inputs: The inputs required for the model are maximum and minimum temperature (°C), rainfall (mm) and sunshine hours (calculated from solar radiation using the method described by Smith Reference Smith1967). Other inputs are the initial conditions of the structural DM per day (in kg carbon (C)/m2/day) and the initial LAI of the compartments and the coefficients required in the formulae such as the extinction coefficient of canopy, the growth coefficient or the leaf transmission coefficient. The model is reset after each harvest date to the same initial conditions.
Outputs: The principal outputs of the J&T model are DM weight (kg DM/hectare (ha)/day) calculated from the shoot dry weight minus the stubble, leaf appearance per day, LAI and leaf senescence. The herbage biomass calculated by the model is to ground level, the data required for comparison with the Moorepark data is herbage mass harvested at 40 mm. As residual cutting height and residual herbage mass are not considered within the model, for the purposes of the present paper it was assumed that each 10 mm of the stubble had an herbage mass of 400 kg DM/ha and so 1600 kg DM/ha (Kennedy et al. Reference Kennedy, O'Donovan, Murphy, Delaby and O'Mara2007) was subtracted from the total herbage mass (kg DM/ha). This is based on data available from experiments at Moorepark (Kennedy et al. Reference Kennedy, O'Donovan, Murphy, Delaby and O'Mara2007).
J model
The J model is a mechanistic dynamic model developed to investigate seasonal and annual interactions between grassland dynamics and management. It was developed to perform multiple-year simulations, respond to various defoliation regimes and produce simple outputs. These outputs can be used as inputs for a production model of ruminant livestock, since this model was designed for a whole-farm simulator (Jouven et al. Reference Jouven, Carrère and Baumont2006).
The originality of the J model lies in the combination of two approaches: functional and structural. The functional groups are based on the classification for temperate grasses by Cruz et al. (Reference Cruz, Duru, Therond, Theau, Ducourtieux, Jouany, Al Haj Khaled and Ansquer2002) and are Group A (fertile sites and frequent defoliation), Group B (medium to fertile sites with infrequent defoliation), Group C (medium to poor sites and resistant to defoliation) and Group D (poor sites and infrequent defoliation). In the J model, a site is described by its N index (Bélanger et al. Reference Bélanger, Gastal and Warembourg1994), water-holding capacity and grassland community. A permanent pasture community is defined as an association of groups of species with similar functional traits. Only one community per field or paddock is considered by the J model. The plant functional traits that have the greatest influence on model outputs are seasonal effects, period of reproductive growth and effects of temperature on the efficiency of the photosynthesis (Jouven et al. Reference Jouven, Carrère and Baumont2006). The structural compartments are: green vegetative, green reproductive, dead vegetative and dead reproductive. Only above-ground grass growth is modelled. The model calculates, in daily time steps, the biomass flows (growth, senescence and abscission; in kg DM/ha) between each structural compartment, given the environmental variables and the average functional traits of the community and taking into account the seasonal effect. In the J model, light interception affects potential growth, which is calculated taking into account incident photosynthetically active radiation (PAR), maximum radiation use efficiency and a function of LAI that accounts for the proportion of light intercepted by the sward. The model accounts for N availability through an N index: 0·4 for very poor soil fertility and 1 when N is not limiting growth. The soil water-holding capacity is considered a site characteristic and will influence the growth limitation when water stress increases (Jouven et al. Reference Jouven, Carrère and Baumont2006). In the model, water stress is given as the ratio of water reserves to soil water-holding capacity.
Inputs: The inputs required for this model are the proportion of functional groups, cutting height (m), cutting dates, mean daily temperature (°C), daily rainfall (mm), global radiation (MJ/m2/day), potential evapotranspiration (ET; mm) and site characteristics (N index and soil water-holding capacity). The N index for Moorepark was set at 0·84, as the grass growth measurement plots at Moorepark are well fertilized.
Outputs: The outputs of the model are the total biomass (kg DM/ha) to ground level, the harvested biomass (kg DM/ha) above cutting height, the structural composition of the sward (green vegetative, green reproductive, dead vegetative and dead reproductive) and the digestibility of the four structural compartments (digestibility is not considered further in the present paper).
B model
The B model was initially developed as a static and empirical model to evaluate the differences in herbage production of grazing systems between years, depending on the effects of weather conditions. It does not explain the nature of grass growth but provides an explanation of the dynamics of a grazing management system subject to a variable feed supply (Brereton et al. Reference Brereton, Danielov and Scott1996; Brereton & O'Riordan Reference Brereton, O'Riordan and Holden2001). Schulte (Reference Schulte and Murphy2005) and Schulte et al. (Reference Schulte, Richards, Daly, Kurz, McDonald and Holden2006) expanded the model to take account of (i) leaf area expansion, (ii) temporal soil water dynamics and (iii) ontogenetic factors.
As this is a static model, it does not describe herbage mass over time but instead estimates yield at the end of a decided time period. The user defines the time period over which yield is to be estimated. The increase in herbage mass is calculated from the radiation received in a given period and does not include carbon (C) assimilation. This suggests that yield should be proportional to the radiation received; however, the capacity of the crop to utilize light is saturated at a given flux density. The effects of leaf area on light interception are implied in the B model on the assumption that temperature affects the efficiency with which radiation is converted to plant energy and hence DM production. The variation between the reproductive and vegetative states of the grass crop is taken into account with a sigmoid curve with calendar date and the ontogenetic factor, i.e. the change from vegetative to reproductive state and back again. Nitrogen fertilizer is adjusted by a coefficient that takes account of variable levels of N use. Yield is also adjusted by a multiplicative factor for soil water deficit. Fluctuations in soil moisture are accounted for using the soil moisture deficit (SMD) model described by Schulte et al. (Reference Schulte, Diamond, Finkele, Holden and Brereton2005).
Inputs: The inputs required for the B model are maximum and minimum temperature (°C) and solar radiation (J/cm2/day). Other inputs are daily SMD (calculated using the hybrid SMD model described by Schulte et al. Reference Schulte, Diamond, Finkele, Holden and Brereton2005); universal parameters including specific leaf area, respiration coefficient, critical SMD and fraction of solar radiation as PAR; site-specific parameters including mean heading date and fraction of tillers vernalized, as well as soil drainage category, N input and latitude; initial conditions including initial biomass and initial SMD.
Outputs: The output of the B model is harvested biomass (kg DM/ha) above 40 mm. While LAI is calculated dynamically throughout the re-growth period, yield is only calculated at the end of this period.
Meteorological data
Daily meteorological data are available from Moorepark (latitude 50°07′N, 8°16′W; 46 m asl) for the years 2005–9, inclusive. The meteorological data include rainfall (mm), minimum and maximum air temperatures (°C), wind speed (m/s), sunlight hours (h) and solar radiation (J/cm2/day). SMD, required as an input for the B model, was calculated using the hybrid SMD model described by Schulte et al. (Reference Schulte, Diamond, Finkele, Holden and Brereton2005), for which the inputs required are: minimum and maximum temperature (°C), rainfall (mm), wind speed at 10 m and solar radiation (J/cm2/day) or sunshine hours. This model was also used to calculate potential ET required as an input for the J model. Sunshine hours were converted from solar radiation using the method described by Smith (Reference Smith1967) and used as an input for the J&T model.
Calculating daily grass growth and herbage production
A summary of the actual average grass growth at Moorepark for the years 2005–9 is shown in Fig. 1. Weekly grass growth data were measured at Moorepark for the period 2005–9. Grass growth was measured using the methodology described by Corral & Fenlon (Reference Corral and Fenlon1978), which estimates grass growth on a 4-week harvest interval. Four series of plots are harvested in rotation, spaced 1 week apart and herbage mass is recorded at each harvest. A simple quadratic function can represent growth rate accelerating steadily from zero immediately after harvest. The data are used to construct growth curves showing the rate at which DM is produced each week of the growing season, on swards that are being harvested monthly. The general equation for growth rate in week t is
 $${\rm Rate}_t = ({\rm A}_1 {\rm Y}_t + {\rm A}_2 {\rm Y}_{t-1} + {\rm A}_3 {\rm Y}_{t-2} + {\rm A}_4 {\rm Y}_{t-3} )/28$$
where Yt, Yt − 1, Yt − 2 and Yt − 3 are the harvested yields at the end of weeks t, t − 1, t − 2 and t − 3, respectively, and A1 = 7/16, A2 = 5/16, A3 = 3/16 and A4 = 1/16, with greater weight given to plots nearer harvest.
(a) Mean monthly temperature (°C); (b) monthly total rainfall (mm); (c) monthly total solar radiation (MJ/m2); (d) daily grass growth rate (kg DM/ha/day) at Teagasc, Moorepark for 2005–9. Mean temperature and solar radiation do not differ considerably throughout the years while total rainfall fluctuates, for example, with a drought during summer 2006 and a high rainfall during November 2009.

This approach was mimicked by the models in the present study. This involved four start dates for each model for each week. Herbage mass was accumulated over the 4-week period and then harvested. The quadratic approximation was then applied to this data to calculate total herbage production for the 4-week period, and is then divided by 28 to give daily grass growth. Annual herbage production is the sum of the herbage production for each of the 28-day periods.
The grazing season was divided into three periods for further analysis as described by McEvoy et al. (Reference McEvoy, O'Donovan and Shalloo2011). The first period corresponds to the onset of grass growth in spring when calving is targeted (includes February–April, weeks 6–13). The second period or mid-season coincides with the main grazing season, when grass is required as a good quality feed for animal performance, with excess forage harvested and preserved as silage for periods of feed shortage (includes April–August, weeks 14–30). The third period corresponds to autumn when feed demand generally exceeds grass supply and the grazing season should last as long as possible to reduce the costs of milk and meat production (August–November, weeks 31–45).
Model evaluation
The three models were simulated over the period 2005–9. Herbage production was modelled for each year separately. Modelled herbage production was compared with recorded herbage production over the 2005–9 period. Two indicator tests were undertaken to compare the grass growth predicted by the models with the measured grass growth; they were root mean square error (RMSE) and mean square prediction error (MSPE).
RMSE
RMSE informs on the performance of the correlations by comparing term by term the actual deviation between predicted and measured values (Eqn 2). The lower the RSME, the more accurate is the estimation (Jin et al. Reference Jin, Yezheng and Gang2005).
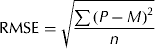 $${\rm RMSE} = \sqrt {\displaystyle{{\sum {(P - M)^2}} \over n}} $$
where M is the measured grass growth, P is the predicted value and n is the total number of observations. RMSE accentuates large errors between the predicted and actual series.
MSPE
The MSPE is the sum of three components, namely, the mean bias (M m−P m)2, the line variation S P2 (1−b)2 (the deviation of the slope of the regression line of P regressed on M) and the random variation about the line S M2 (1−R 2). Each is expressed as a proportion of the total MSPE (Eqn 3).
 $${\rm MSPE} = 1/n\sum (M-P)^2 = (M_m -P_m )^2 + S_P ^2 (1-b)^2 + S_M^2 ^{\rm} (1-R^2 )$$
where n is the number of measured and predicted pairs compared; M m and P m are the means of M and P, respectively, S P2 and S M2 are the variances of M and P, respectively, b is the slope of the line of P regressed on M, and R 2 is the determination coefficient of the line (Rook et al. Reference Rook, Dhanoa and Gill1990). A high mean bias indicates that the predicted values are consistently higher or lower than the measured values. A low line component indicates that the difference of the slope of the regression is low and a good prediction slope was found (Barrett et al. Reference Barrett, Laidlaw and Mayne2004). The main source of variation between predicted and measured values should be due to random causes and, hence, ideally the part of the random component should be relatively high.
RESULTS
Meteorological data
A summary of the data, including monthly mean temperature, monthly total rainfall and monthly total solar radiation, is presented graphically in Fig. 1. Average annual daily temperature from 2005 to 2009 was 10 °C, while average total annual rainfall was 1023 mm. Average daily temperature was highest in July 2006 and lowest in December 2009. Rainfall was considerably lower than average in June and July of 2006, and considerably higher than average in November of 2009. Solar radiation was usually greatest in June and was similar across years for the first 3 months and last 3 months of the 5 years.
Model evaluation
Total herbage production
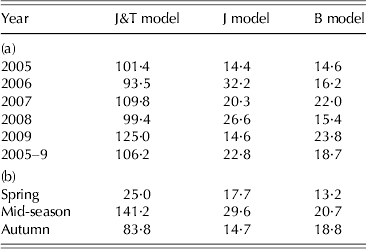
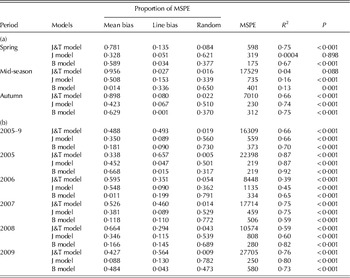
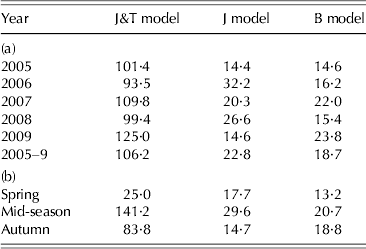
The average annual total herbage production at Moorepark for the period 2005–9 was 14087 kg DM/ha (Fig. 1), with an average grass growth of 50·3 kg DM/ha/day. The J&T model over-predicted grass growth in all years, by a mean of 24886 kg DM/ha/year (Fig. 2), corresponding to an over-prediction of 88·9 kg DM/ha/day, as indicated by a high mean bias (0·488). The J model under-predicted grass production by an annual average of 3869 kg DM/ha over the 5-year period (Fig. 2), with an under-prediction of 13·9 kg DM/ha/day. A good prediction slope was observed for the J model (line bias 0·089) and the random variation was 0·560 (Table 2). The B model over-predicted grass production (2328 kg DM/ha/year; Fig. 2), with a grass growth over-prediction of 8·3 kg DM/ha/day. The B model reported the best RMSE over the 5-year period (Table 1). Most of the variation in the grass production predicted by the B model was due to random variation (0·73), and overall, a small line bias was observed (0·09; Table 2). In 2006, a year with a high SMD in mid-summer, the B model had the best fit, with the lowest MSPE. Over the 5-year period, the J and B models had similar RMSE, which was approximately five times less than that of the J&T model (Table 1).
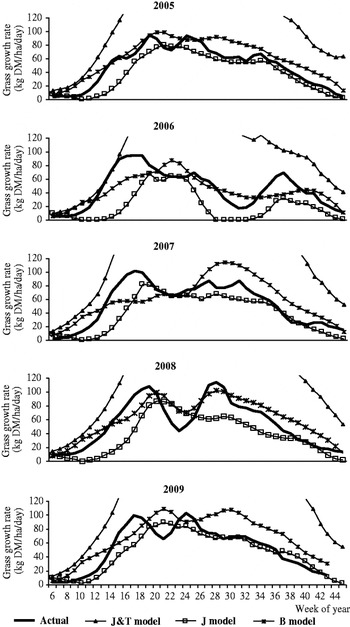
Predicted and measured grass growth data (kg DM/ha/day) for weeks 6–45 for the 5 years 2005–9 at Moorepark. Grass growth was predicted using Johnson & Thornley (Reference Johnson and Thornley1983) Model (J&T model), Jouven et al. (Reference Jouven, Carrère and Baumont2006) Model (J model) and Brereton et al. (Reference Brereton, Danielov and Scott1996) Model (B model). The upper part of the graph was excluded as the Johnson & Thornley model predictions were unrealistic. Grass growth was measured at Moorepark using the methods described by Corral & Fenlon (Reference Corral and Fenlon1978).

Comparison of the precision of the three models: Johnson & Thornley (Reference Johnson and Thornley1983) (J&T model), Jouven et al. (Reference Jouven, Carrère and Baumont2006) (J model) and Brereton et al. (Reference Brereton, Danielov and Scott1996) (B model) using RMSE (kg DM/ha/day) for (a) each of 5 years (2005–9) and (b) for spring (Feb–Apr, weeks 6–13), mid-season (Apr–Aug, weeks 14–30) and autumn (Aug–Nov, weeks 31–45).
Precision of simulation of grass growth by the three models: Johnson & Thornley (Reference Johnson and Thornley1983) (J&T model), Jouven et al. (Reference Jouven, Carrère and Baumont2006) (J model) and Brereton et al. (Reference Brereton, Danielov and Scott1996) (B model) using MSPE (kg DM/ha/day) for (a) spring (Feb–Apr, weeks 6–13), mid-season (Apr–Aug, weeks 14–30) and autumn (Aug–Nov, weeks 31–45) and for (b) 2005–09, 2005, 2006, 2007, 2008 and 2009. Proportions of MSPE may not always sum to 1·00 due to rounding.

Seasonal production
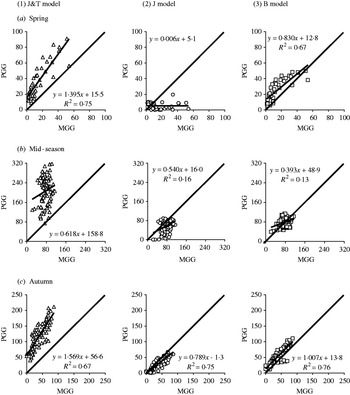
Period 1: spring (weeks 6–13): Average spring herbage production at Moorepark for the period 2005–9 was 864 kg DM/ha (Fig. 1) with a grass growth rate of 15·4 kg DM/ha/day. On average, the J&T model over-predicted in this period (mean bias = 0·781; Table 2) by a mean of 1210 kg DM/ha (Fig. 2) and by an average of 22 kg DM/ha/day (Fig. 3a). The J model under-predicted spring grass production by a mean of 573 kg DM/ha (Fig. 2), corresponding to an average under prediction of 10 kg DM/ha/day (Fig. 3a). The J model had a high random variation (0·621; Table 2). The B model over-predicted spring herbage production, although less than the J&T model, by a mean of 10 kg DM/ha/day (Fig. 2) (mean bias = 0·589; Table 2). The B model had the lowest RMSE for the spring period (Table 1). Weekly grass growth predicted by the models was similar to that measured on the first two measurement dates (weeks 6 and 7), but from week 8 the differences between measured and predicted increased rapidly (Figs 2 and 3a).
Predicted grass growth (PGG) on the Y-axis plotted against measured grass growth (MGG) on the X-axis expressed as kg DM/ha/day for (a) weeks 6–13 (spring), (b) weeks 14–30 (mid-season) and (c) for weeks 31–45 (autumn) for the 5 years 2005–9 at Moorepark. Grass growth was predicted using (1) Johnson & Thornley (Reference Johnson and Thornley1983) model (triangles), (2) Jouven et al. (Reference Jouven, Carrère and Baumont2006) model (circles) and (3) Brereton et al. (Reference Brereton, Danielov and Scott1996) model (squares). All the regressions shown are significant at P < 0·01.

Period 2: mid-season (weeks 14–30): Mid-season herbage production at Moorepark averaged 9135 kg DM/ha (Fig. 1) with a grass growth rate of 77 kg DM/ha/day. The J&T model greatly over-predicted herbage production, by an average of 15407 kg DM/ha (an average of 129 kg DM/ha/day; Fig. 3b). The RMSE and the MSPE were very high at 141·18 and 17529, respectively (Tables 1 and 2). Only 0·016 of the variation was random (Table 2), the rest was due to mean bias (0·956) and line bias (0·027). The J model under predicted mid-season herbage production by 2299 kg DM/ha (Fig. 2), that is, 19 kg DM/ha/day (Fig. 3b). Most of the variation predicted by the J model was due to mean bias (0·508). The B model had the closest prediction for this period with an over prediction of 2·3 kg DM/ha/day (Figs 2 and 3b), as indicated by a low RMSE of 20·74 (Table 1). The highest proportion of the MSPE for the B model was due to random variation (0·650) with a mean bias of 0·014 (Table 2).
Period 3: autumn (weeks 31–45):The average autumn herbage production observed at Moorepark was 4088 kg DM/ha (Fig. 1), equivalent to a growth rate of 39 kg DM/ha/day. The J&T model over-predicted autumn herbage production by an average of 8268 kg DM/ha (Fig. 2), as indicated by a high RMSE of 83·81. The autumn grass growth over-prediction by the J&T model was of 79 kg DM/ha/day (Fig. 3c). The variation between the herbage production measured and predicted by the J&T model was explained in the MSPE by a high mean bias (0·898) and a low random variation (0·022), compared to 0·510 for the random variation for the J model (Table 2). The J model had the closest prediction, under-predicting by a mean of 997 kg DM/ha (Figs 2 and 3c), and a daily grass growth under-prediction of 9·5 kg DM/ha/day (Fig. 3c). The MSPE of the J model was the lowest of the three models, with the variation due to the mean bias (0·423) and the random variation (0·510; Table 2). The B model over-predicted herbage production by 1482 kg DM/ha for the autumn period (Fig. 2; Table 1), and the autumn grass growth over prediction was 14 kg DM/ha/day. The source of the variation for the B model was a high mean bias (0·629), although a good slope of the line was found with line bias of only 0·001 (Table 2).
Peaks
On average over the 5-year period, the primary grass growth peak occurred at Moorepark during week 18 and a secondary peak occurred in week 28; 3 of the 5 years had a small third peak occurring in week 34 (Fig. 2). There was a range of 6 weeks for the primary, 4 weeks for the secondary and 4 weeks for the occasional third peaks (Fig. 2). The J&T model, on average, predicted the primary grass growth peak 5 weeks later than the observed (around week 23), with a range of 9 weeks. The peak predicted by the J&T model was 2·5 times greater than the measured primary grass growth peak (Fig. 2). A small secondary peak was predicted by the J&T model in only 2 of the 5 years, and occurred around week 31 (Fig. 2). The primary and secondary grass growth peaks predicted by the J model were later than measured in all years, occurring on average during week 20 and week 32 (Fig. 2). In 2008, the J model half predicted the secondary peak, and in 2009 the J model only predicted one peak, in week 21 (Fig. 2). All peaks predicted by the B model occurred, on average, 3 weeks later than the observed (around week 21 for the primary peak and 29 for the secondary one) but at a similar grass growth rate to the measured data. In 2006, both peaks occurred 4 weeks later than the actual grass growth data (Fig. 2), and in 2007 only the secondary peak was predicted and at a growth rate of 20 kg DM/ha/day greater than the actual data.
Trends
The J&T model repeatedly over-predicted grass growth in all years, this being most apparent from mid-April to late-summer (Fig. 2). The J&T model failed to predict the large drop in grass growth due to drought conditions that occurred in 2006 (Fig. 2). The J model mostly under-predicted grass growth for the spring period, but it closely followed the trends for the remainder of the year, except in 2008, where it only predicted the primary peak (Fig. 2). The B model over-predicted grass growth during the early spring and late autumn periods, but it followed closely the observed trend during the mid-season with the exception of 2007, where it only predicted the secondary peak.
DISCUSSION
Total production
The J&T model over-predicted total herbage production in all 5 years, the B model also over-predicted but to a lesser degree, while the J model under-predicted herbage production.
In the J&T model, harvested herbage mass was assumed to be total herbage mass minus 1600 kg DM/ha. The literature indicates that herbage mass below 40 mm varies throughout the year (Kennedy et al. Reference Kennedy, O'Donovan, Murphy, Delaby and O'Mara2007). Incorporating a sub-model that can partition energy from photosynthesis to either stubble or herbage mass above 40 mm might increase the accuracy of the quantification of harvested herbage. Increasing the stubble mass (<40 mm) from 1600 kg DM/ha as used in the present analysis, to the 3127 kg DM/ha measured by Kennedy et al. (Reference Kennedy, O'Donovan, Murphy, Delaby and O'Mara2007), would reduce the grass growth peak from c. 284 kg DM/ha/day to c. 232 kg DM/ha/day, a reduction in peak growth of c. 18%.
Annual herbage production above 40 mm predicted by the J model was less than that measured at Moorepark; however, the total quantity of herbage produced above and below 40 mm was very similar to that measured at Moorepark above 40 mm. The initial stubble herbage mass appears to be lower than that measured by Kennedy et al. (Reference Kennedy, O'Donovan, Murphy, Delaby and O'Mara2007) and some modification of partitioning of energy to stubble throughout the year may increase herbage mass above 40 mm. The relationship between growth and senescence, and the allocation function of biomass for green vegetative or green reproductive (depending on the nutrition index and the beginning and end of reproductive growth) may also require some adjustment to match the trend, as the prediction of the first peak by the J model is delayed, and overall spring production predicted by the J model is considerably lower than measured (Figs 2 and 3a).
The B model over-predicted grass growth in all years. In the B model, harvested biomass is calculated from the cutting event, yield, the different growth variables and the timestep (1 h). Adjusting the initial biomass (to increase herbage mass in early spring) and the stubble biomass (to reflect that which has been measured) would reduce the over-prediction.
The over-estimation of total herbage production by the J&T and the B model is similar to that observed by Barrett et al. (Reference Barrett, Laidlaw and Mayne2004). Brereton & O'Riordan (Reference Brereton, O'Riordan and Holden2001) also reported over-prediction of grass growth by the J&T model, however, the same authors reported an over-prediction by the B model only in spring and an under-prediction for the remainder of the year.
Seasonal production
Period 1: spring (weeks 6–13)
The seasonal pattern of sward production is impacted by the change from vegetative to reproductive growth in perennial ryegrass tillers (Hurley et al. Reference Hurley, Gilliland and O'Donovan2008), which occurs in response to photoperiod. Hurley et al. (Reference Hurley, Gilliland and O'Donovan2008) observed that the critical day length required for reproductive initiation was significantly different between perennial ryegrasses cultivars, ranging from 12·8 to 14·5 h for intermediate and late heading cultivars at Teagasc, Moorepark, in the south of Ireland, and that the mean ear initiation (EI) date ranged from 3 to 28 April. Grass growth rates during reproductive initiation and the reproductive stage are approximately double those during the vegetative state. The J&T model does not take account of reproductive growth (Johnson & Thornley Reference Johnson and Thornley1983), but shows a very high peak that corresponds in time with reproductive growth. The over-prediction of grass growth by the J&T model probably occurs due to the high leaf area in the model as a result of the partitioning of available energy to leaf growth rather than to stem and flower production. High leaf area increases light interception and photosynthesis and hence grass growth. The rapid increase in grass growth predicted by the J&T model may also be a result of an increase in tiller number. New tillers produced will contribute to herbage mass provided they are above harvest height. However, if the sward is reproductive, less energy is partitioned for production of new tillers and so there is no overall increase in new tillers to contribute to herbage mass. A reproductive phase could be added to the J&T model to take account of the change from vegetative to reproductive, thereby reducing the rate of new leaf tiller production and hence, herbage production.
Including an adjustment factor that takes account of location and its effect on day length and hence reproductive initiation, as well as average heading date in the J model, may increase spring growth. A default value of the average of late heading perennial ryegrass cultivars could be used in instances where actual heading date is not available as late heading cultivars account for c. 0·80 of perennial ryegrass seed sold in Ireland (Grogan & Gilliland Reference Grogan, Gilliland, O'Donovan and Hennessy2010). The duration of the reproductive growth phase in the J model is the difference between the sum of temperatures at the beginning and at the end of the reproductive period (Jouven et al. Reference Jouven, Carrère and Baumont2006). The thresholds used by the J model for reproductive growth are 600 °C accumulated thermal time for the beginning of the reproductive phase and 1200 °C for its end. Hurley et al. (Reference Hurley, Gilliland and O'Donovan2008) observed that the mean accumulated temperature between EI and ear emergence (EE) calculated from different perennial ryegrass cultivars at Moorepark was 512 °C days. The J model could be adjusted to incorporate this data and therefore reduce the thermal time required to initiate the reproductive phase.
The B model considers the change between reproductive and vegetative stage with a sigmoid curve, taking into account the relationship between the date and the ontogenic factor that represents this change (Burke et al. Reference Burke, Brereton, O'Kiely, Schulte, Keane and Collins2004; Schulte Reference Schulte and Murphy2005). In the model, this change from vegetative to reproductive depends on the mean heading date, standard deviation of heading date, fraction of tillers vernalized and duration of the generative phase of the individual tiller. The B model converts radiation into plant energy and hence herbage mass, it is possible that the equation may be over-predicting light interception and therefore over-predicting grass growth, particularly in early spring. It is also possible, but not verifiable, that the model might be over-estimating N use efficiency and therefore this might be contributing to over-prediction of grass growth in spring. The cubic relationship between the coefficients to accommodate variable N levels may need to be adjusted.
Period 2: mid-season (weeks 14–30)
The J&T model over-predicted grass growth in all weeks but it was more noticeable from c. week 12 onwards. The rapid increase in grass growth predicted from late spring results in an increase in LAI and hence light interception (Leafe et al. Reference Leafe, Stiles, Dickinson, Iglovikov and Movsissyants1975). Light interception, as well as being related to the LAI, is key to morphological processes such as leaf elongation rates and tillering. The rate of new leaf appearance increases as temperature increases. In mid-summer, on average, it takes 7–10 days for one new leaf to appear on a perennial ryegrass tiller, while in winter 35–50 days are required (Davies Reference Davies and Gilsenan1977; Hennessy et al. Reference Hennessy, O'Donovan, French and Laidlaw2008). Leaf appearance as predicted by the J&T model was within the expected range during the summer, while the production in winter was higher than that previously measured. High leaf appearance rates in winter and early spring increases LAI and therefore light interception and photosynthesis, and hence increases the energy available for grass growth in early spring, contributing to the high primary grass growth peak observed in the predictions by the J&T model (Fig. 2).
Drought conditions experienced in 2006, when mid-season grass growth was just 0·49 and 0·36 in July and August of the average of the other 4 years, respectively, was not reflected in the prediction by the J&T model. The inclusion of a water sub-model to account for fluctuations in soil moisture content, particularly in years with drought or over-supply of water through excessive rainfall, may reduce the over-estimation of grass growth in summer. Both the J and B models somewhat accounted for the drought period, although the J model predicted grass growth equal to zero and the B model over-predicted grass growth compared to the measured rate. In the J model, this under-prediction may be related to the ability of the model to deal with the soil water-holding capacity and the water reserve. Modification of the water sub-model may improve the prediction accuracy of the J model, particularly in a drought situation.
The under-prediction of mid-season herbage mass by the J model, the over-prediction by the J&T model and the slight over-prediction by the B model may be related to the tiller number prediction. Tiller population density is usually greatest in the March–May period, and also peaks in July or August (Davies Reference Davies and Gilsenan1977). Mean herbage mass predicted by the J&T model in May, June and July was 5724, 8093 and 6534 kg DM/ha, respectively. Using the methods described by Jewiss (Reference Jewiss, Davies, Baker, Grant and Laidlaw1993) and an average weight of an individual tiller of 0·0481 g in May and 0·0688 g in July as measured by Kennedy et al. (Reference Kennedy, O'Donovan, Murphy, Delaby and O'Mara2007) these herbage masses suggest tiller densities of c. 11900, 13847 and 9497 tillers/m2 in May, June and July, respectively: considerably higher than those measured at Moorepark by Hennessy et al. Reference Hennessy, O'Donovan, French and Laidlaw(2006) but lower than that measured by Davies (Reference Davies and Gilsenan1977) and Kennedy et al. (Reference Kennedy, O'Donovan, Murphy, Delaby and O'Mara2007). Under normal conditions, where plants change from vegetative to reproductive, tiller loss occurs following the removal of the growing point of reproductive tillers by grazing or harvesting (Davies Reference Davies and Gilsenan1977). As the J&T model does not consider the reproductive phase, the loss of tillers is at a lower rate than occurs in reproductive swards. The J model predicted mean herbage mass in May, June and July of 2532, 2744 and 2203 kg DM/ha, respectively. These herbage masses suggest tiller densities of c. 5263, 4694 and 3202 tillers/m2 in May, June and July, respectively, using the same method as described to estimate tiller density in from the J&T model. The tiller densities predicted by the J model are lower than the 9590 tillers/m2 in July measured by Davies (Reference Davies and Gilsenan1977), but somewhat similar to the mean tiller density measured in June at Moorepark, c. 5946 tillers/m2 (Hennessy Reference Hennessy2005). However, tiller density predicted by the J model was just 0·61 of the tiller density previously measured at Moorepark in July (Hennessy Reference Hennessy2005) (5268 tillers/m2).
Period 3: autumn (weeks 31–45)
In autumn, temperature and light are the critical factors affecting herbage production. Laidlaw & Mayne (Reference Laidlaw and Mayne2000) and Hennessy et al. (Reference Hennessy, O'Donovan, French and Laidlaw2008) reported that from October onwards, net grass growth was influenced not only by conditions affecting leaf extension but also leaf senescence which increased relative to leaf production from October to December in underfoliated swards (weeks 39 onwards). The over-prediction of autumn herbage production by the J&T model could be due to a high tiller density and a low level of tiller loss/death and a low leaf senescence rate in the model. It is possible that similar processes could be occurring in the B model, but it is not possible to verify this because crop morphology is not incorporated into the model. The opposite may be occurring with the J model in autumn, a greater loss of herbage material may be occurring in the model than in reality due to an under-estimation of light interception (similar to early spring). During autumn, average daily energy capture decreases, as both light and day length decrease, resulting in a decline in canopy photosynthesis. Hence, tissue production decreases and tissue death increases, and so a smaller ceiling yield is achieved (Parsons & Chapman Reference Parsons, Chapman and Hopkins2000). The J&T model predicts a smaller ceiling yield for the autumn period compared to the spring period, although it is still an over-estimation of measured grass growth. Both the J and B models predictions differ from the actual data by c. 10 kg DM/ha/day, and this could be related to light interception, an adjustment factor could be added to these models to increase light interception and hence autumn grass growth.
Implications
None of the models used in the present study was calibrated for the specific site at which grass growth was measured, apart from cutting height in the J and B models (not applicable in the J&T model), and site latitude in the J&T and the B models (not applicable in the J model). Further site-specific calibration may improve the grass growth predictions of some of the models, particularly the B model and the J model. From the present study, the models with the greatest potential to predict grass growth in Ireland are the J model and the B model, but to predict grass growth accurately, components of both models need to be modified. Empirical models such as the B model require site-specific input parameters which must be either available or calibrated (Barrett et al. Reference Barrett, Laidlaw and Mayne2004; Holden Reference Holden and Holden2001). Using site-specific parameters, the B model would be useful to predict differences in grass growth between regions or years within Ireland, the region in which it was developed, however, the accuracy of empirical models declines with increasing distance from the site of development, because once an empirical model is applied at the extremes of the data range used to formulate it, or to a similar related system, it can rapidly deteriorate in quality of output (Holden Reference Holden and Holden2001). A mechanistic model, such as the J model, requires universal parameters only and is likely to be effective across a range of conditions and is more likely to be of use in situations where climate change may influence meteorological conditions. Grass growth prediction by the J&T model could be improved by incorporating a sub-model that can partition energy from photosynthesis to either stubble or herbage mass above 40 mm as well as incorporating a reproductive phase.
At a minimum, a grass growth predictor must be able to predict the trend in grass growth from week to week. A suitable model to predict grass growth for use as a grassland management tool requires greater accuracy than that available from the three models evaluated. Such a model must be as precise as possible, be dynamic, use realistic input parameters and incorporate meteorological data. Budgeting grass supply allows producers to minimize the quantity of purchased feed and silage required in the diet. Increasing food demand and pressures from climate change will force farmers to be dynamic in the decision-making process and so accurate prediction of grass growth will allow strategic planning of the feed budget.
The present paper reviews three models varying in mechanism and complexity, as well as region of origin. The evaluation identified the strengths and weaknesses of each model. The seasonal grass growth predicted by each model was compared with actual grass growth in that season; this aspect of the analysis of the models allows for easier interpretation of the specific strengths and weaknesses of the models in each season. While this model evaluation was undertaken at one site only, the models were developed in three different regions, indicating that model evaluation is possible across regions/countries. Seasonal evaluation of the prediction of grass growth by a model or models, regardless of region, should allow the identification of modifications necessary to improve the prediction.
In conclusion, none of the existing models in their current format is ideal. Modifications to the models will allow more accurate grass growth predictions to be made. Aspects of the J&T model, such as movement of leaf material from one age category to the next, could be incorporated in other models to improve their description of grass growth. While the J&T predicts the pattern of grass growth, the inclusion of a reproductive phase and a water sub-model, as well as a capability to partition energy to stubble are required, at a minimum, to improve its prediction. Although the B model predicts grass growth closely, particularly in spring and autumn, it is empirical and therefore site-specific, and requires site-specific input parameters to facilitate application across different regions in Ireland. Some modifications that may be required to the B model include an examination of N use efficiency in spring and modification of light interception in early spring. At farm level, where site-specific parameters may not be available, a mechanistic model such as the J model that uses universal parameters can have a role in grass growth prediction. To improve the accuracy of prediction of the J model modification of the seasonal pattern of certain functional traits, as well as spring growth parameters and the reproductive phase including the initiation of the reproductive phase is required.
The first author wishes to thank Teagasc for funding through the Walsh Fellowship Scheme. The authors are grateful to E. Ganche and F. Journot for translating the J model software from French to English.