Introduction
Planetary analog research involves the investigation of terrestrial environments that are comparable to extraterrestrial environments. These analogs tend to be focused, at a high level, on science, science operations, or technology research and testing, or a combination of these topics (e.g. Dickinson & Rosen Reference Dickinson and Rosen2003; Sarrazin et al. Reference Sarrazin, Blake, Feldman, Chipera, Vaniman and Bish2005; Cabrol et al. Reference Cabrol2007; Pollard et al. Reference Pollard, Haltigin, Whyte, Niederberger, Andersen, Omelon, Nadeau, Ecclestone and Lebeuf2009; Lim et al. Reference Lim2011; Abercromby et al. Reference Abercromby, Chappell and Gernhardt2013). Analog field settings are used to evaluate scientific instruments of particular relevance to future flight missions in a rugged field setting. These field tests have, for example, ranged from deserts to underwater settings (e.g. Cabrol et al. Reference Cabrol2007; Jasiobedzki et al. Reference Jasiobedzki, Dimas and Lim2012; Abercromby et al. Reference Abercromby, Chappell and Gernhardt2013), and have taken a variety of forms, from testing a single technology to examine its performance in a particular environment (e.g. Skelley et al. Reference Skelley, Aubrey, Willis, Amashukeli, Ehrenfreund, Bada, Grunthaner and Mathies2007), to fully integrated rover tests utilizing a variety of different instruments (e.g. Schenker et al. Reference Schenker2001).
One environment that has received less attention for analog research, but which holds a great deal of research potential, is the deep subsurface. The MINAR (MINe Analog Research) program is focused on the active potash Boulby Mine site in northern Yorkshire, UK, which is located at 1.1 km depth and one of the deepest mines in Europe. MINAR's primary goal is to test instrumentation designed for planetary exploration through investigating deep subsurface habitability, whilst establishing the potential this technology has to be transferred into the mining industry. Our paper will detail the nature of this deep-subsurface analog environment and highlight the scientific, operational and technical potential of this site. We also outline the objectives of the on-going MINAR program and present results of our recent MINAR I, II and III field instrument testing and evaluation activities.
Site description and background
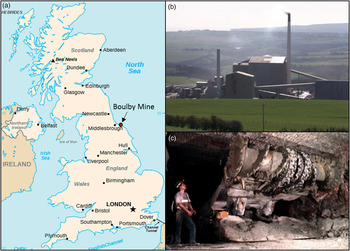
The Boulby Mine exploits a Zechstein evaporite deposit, focusing on a potash seam found approximately 1 km below the surface of north Yorkshire, UK (Fig. 1). The Zechstein sequence is the remnants of a 250 million year old epeiric sea that once stretched from the shoreline of the modern UK to Eastern Europe. The sequence contains a number of repeating evaporite mineral horizons, including both chloride and sulphate salts, including halite, sylvinite, sylvite and polyhalite. The salt minerals contain a variety of clays and other impurities. Brine flows of varying compositions intersect the mine at a number of locations. These originate from the dehydration of gypsum within the sequence, or from connections to the overlying aquifer (Bottrell et al. Reference Bottrell, Leosson and Newton1996). The mine is run by Israel Chemicals Limited (ICL) and produces around half of the UK's potash output.
(a) Location of Boulby mine (red dot). Boulby is an active Potash mine and one of the largest mines in Europe. (b) An image of the mine at the surface. (c) A typical mining scene involving the extraction of economic ore below ground.

Large-scale evaporite deposits, like the example found at Boulby, provide a useful terrestrial analog for parts of the Martian surface and potentially deep subsurface. Chloride and sulphate minerals have been detected over much of Mars’ surface and in Martian meteorites (Bridges & Grady Reference Bridges and Grady1999, Reference Bridges and Grady2000; Squyres et al. Reference Squyres2004; Langevin et al. Reference Langevin, Poulet, Bibring and Gondet2005; Osterloo et al. Reference Osterloo, Hamilton, Bandfield, Glotch, Baldridge, Christensen, Tornabene and Anderson2008, Reference Osterloo, Anderson, Hamilton and Hynek2010; Hynek et al. Reference Hynek, Osterloo and Kierein-Young2015). Brines formed through the dissolution of these surface evaporites and their subsurface counterparts represent a potentially important habitat on Mars. These brines are hypothesized to remain liquid in the shallow subsurface, and even surface regions, of present-day Mars (Martínez & Renno Reference Martínez and Renno2013; Ojha et al. Reference Ojha, Wilhelm, Murchie, McEwen, Wray, Hanley, Masse and Chojnacki2015). The Boulby Mine therefore presents a unique window into a highly uncharacterized region of the Earth and a way to assess the habitability of past and present extraterrestrial environments.
The MINAR Program
MINAR is a set of analog missions aiming to tests instrumentation designed for planetary exploration, whilst improving our understanding deep subsurface habitability. Instrumentation of particular interests is that with the potential to be applied into the mining industry to improve the economic recovery of ores. These goals directly contribute to the primary science objectives of the larger Boulby astrobiology activity, which aims to understand the diversity of life in a deep subsurface hypersaline environment, how it contributes to biogeochemical processes and what it might tell us about the habitability of analogous extraterrestrial environments (Cockell et al. Reference Cockell, Payler, Paling and McLuckie2013).
The initial part of the MINAR program was set out in three phases. MINAR I involved identifying potential sites for analog testing, constructing a long-term plan for the program and developing a workflow for instrument testing. MINAR II & III focused on instrument testing in the deep subsurface. This instrumentation included the ExoMars Panoramic Camera emulator (AUPE-2), Close-Up Imager (CLUPI), Raman spectrometer, Small Planetary Linear Impulse Tool (SPLIT), Ultrasonic Drill and a handheld X-ray diffraction (XRD) (see section ‘MINAR I–III: instrumentation and technical specifications’ for details). The core analog testing and science work carried out during these latter two stages aimed to test this instrumentation combination's ability to characterize evaporite minerals at different scales in the deep subsurface.
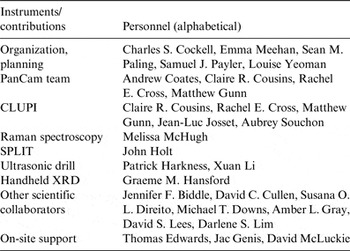
MINAR is a collaborative effort, organized and run by the UK Centre for Astrobiology, the Boulby Underground Facility and ICL. It partners with a number of institutes around the world. Table 1 details the personnel involved with the first three phases of the program.
Contributions of the personnel involved in the first three phases of MINAR

Why is MINAR important?
MINAR operates in a deep subsurface environment. The program's context within a larger deep subsurface science program (Boulby Astrobiology) allows the results from the instrumentation to contribute to the study of deep subsurface habitability, for example through examining variations in minerology.
Technology development
MINAR offers the opportunity to test technology for the exploration of extraterrestrial environments in general, in addition to subsurface extraterrestrial environments. Terrestrial subsurface environments pose special operational challenges in extremes such as darkness, difficulties in accessibility and the presence of dust. This makes them attractive places to test equipment function, assess performance and simulate remote operations. Cave systems on the Moon and Mars which have been observed directly using orbital imagery (Hodges & Moore Reference Hodges and Moore1994; Cushing et al. Reference Cushing, Titus, Wynne and Christensen2007; Léveillé & Datta Reference Léveillé and Datta2010) would provide natural access into the deep subsurface of planetary bodies. As their interiors are sheltered from surface radiation, they may also be preferential targets to search for the presence of habitable conditions. In order to explore such environments, refining the exploration of a deep subsurface environment on Earth using prototype and flight ready instrumentation is required.
Scientific contribution
The Boulby astrobiology activity provides the larger scientific context for MINAR. While deep subsurface evaporite deposits are known to host halophilic microbial communities (e.g. Norton et al. Reference Norton, McGenity and Grant1993; Xiao et al. Reference Xiao, Wang, Wang, Schneegurt, Li, Lai, Zhang, Wen and Cui2013), a dearth of knowledge remains surrounding the diversity of subsurface microorganisms, their role in biogeochemical cycling and their association with specific evaporitic geochemistries.
Crucial to assessing habitability is investigating the presence of geochemical variations. In evaporite deposits, for instance, particular layers are dominated by certain minerals. These minerals in themselves are insufficient to provide life with the full array of macro- and trace-elements required for growth (e.g. halite). Therefore, to assess the habitability of these environments, it is also necessary to be able to map and characterize inclusions of minerals, clays and fractures (through which aqueously entrained nutrients and energy supplies might flow) within the primary salt rocks. The instrument testing during MINAR examined mineral variations, allowing us to assess which instruments might be best for carrying out these investigations and highlighting any geochemical variations relevant to habitability, such as the presence of carbon compounds and energy sources.
Technology transfer
MINAR is distinctive in having a strong industry connection. By testing equipment in a working mine, the performance of instruments that have potential uses in the mining industry can be better assessed and can be demonstrated directly to mining professionals in a real mining context. Unforeseen spin-off opportunities from space exploration to economic mining are more easily identified when planetary scientists and mining personnel from different backgrounds are brought together into a working environment.
MINAR I–III: instrumentation and technical specifications
Instrument testing was carried out in a purposely designed deep subsurface testing area situated at 1.1 km below the surface, in the halite horizon of Boulby Mine. This test area is located close to the Palmer Laboratory which houses a variety of physics experiments and BISAL (Boulby International Subsurface Astrobiology Laboratory). The Palmer Laboratory provided support facilities to the program, including internet, a mess area, clean laboratory facilities and a workshop. Since Boulby is an active mine, the test area had to be situated within a stable, constantly gas-monitored region due to the increased risks of sparks when using prototype electrical equipment.
The instrument selection for MINAR was designed to enable adequate characterization of deep subsurface evaporite minerals at different scales. Three of these instruments have been designed for deployment on the ESA/Roscosmos ExoMars rover (PanCam, CLUPI and Raman spectrometer). The instruments involved include a number of contextual, contact and destructive-sampling instruments described below.
The Aberystwyth University PanCam Emulator MK2 (AUPE-2)
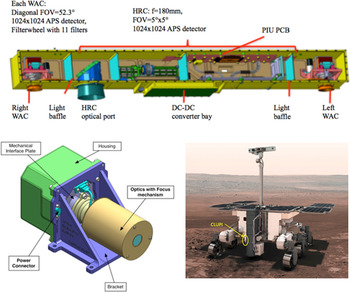
Contextual information is vital to remote operations in the subsurface. The ability for a science instrument to visualize and investigate its surroundings is essential for pathfinding, locating objects of interest, examining large-scale features in detail, and placing other analytical data into spatial context. To achieve this, rovers have often employed mast-mounted panoramic camera systems. The ExoMars 2018 rover will carry a mast-mounted stereo panoramic camera system (PanCam) as part of the Pasteur science payload (Griffiths et al. Reference Griffiths, Coates, Jaumann, Michaelis, Paar, Barnes and Josset2006; Coates et al. Reference Coates2012). The PanCam system will produce wide-angle and high-resolution colour images to provide scientific context for other instruments, multispectral images for the remote detection and identification of priority science targets, and stereo image sets for three-dimensional (3D) terrain mapping. PanCam comprises three cameras mounted within an optical bench (Fig. 2), two wide-angle (38.3° horizontal and vertical field of view) multispectral cameras with a stereo separation of 50 cm and a high-resolution camera (4.8° horizontal and vertical field of view) mounted between them.
Top: ExoMars PanCam optical bench. (©Mullard Space Science Laboratory). Bottom left: CAD (Computer Aided Design) of CLUPI instrument (©Space Exploration Institute). Bottom right: CLUPI and PanCam on the ExoMars rover (©ESA).

The PanCam flight instrument is still under development and so an emulator camera system has been constructed to provide representative data during field testing. Specification differences between the AUPE-2 system and ExoMars PanCam can be found in Harris et al. (Reference Harris, Cousins, Gunn, Grindrod, Barnes, Crawford, Cross and Coates2015). The AUPE-2 used for MINAR is constructed from a combination of commercial off-the-shelf cameras and lenses, and bespoke filter wheels (Cousins et al. Reference Cousins, Gunn, Prosser, Barnes, Crawford, Griffiths, Davis and Coates2012) and control software. It has been used for field testing and in the development of calibration and image processing routines for the PanCam instrument (Pugh et al. Reference Pugh, Barnes and Tyler2012). The deployment of AUPE-2 at MINAR was a collaboration with Aberystwyth and St. Andrews University, UK.
CLose UP Imager (CLUPI)
The use of CLUPI in MINAR was a collaboration with the Space Exploration Institute, Switzerland. CLUPI provides close up contextual images of samples identified as being of interest by PanCam. It is part of the Pasteur Payload onboard the ESA/Roscosmos ExoMars rover and is designed to replicate a geologist's hand lens. Mounted on the drill carried by the rover (Fig. 2), CLUPI's main objectives during the ExoMars mission are to acquire images in order to study the morphology of outcrops, surface rocks and particles, search for signatures of biology and other general geological context information. It also will be used to study drill holes, drilling fines and drilled core samples delivered in the Core Sample Transportation Mechanism (CSTM) prior to their sending to the instruments within the rover.
CLUPI is a powerful, miniaturized, low-power, efficient and highly adaptive system composed of three main parts: an optics with focus mechanism that allows the acquisition of sharp images of any target from 10 cm to infinity, a colour (RGB) Active Pixel Sensor with 2652 × 1768 × 3 pixels, and a high-performance integrated electronics system. The functionality of z-stacking (i.e. combining of many images acquired at different focus positions to generate an image sharp in all areas) is also implemented in order to increase the scientific return. A CAD rendering of CLUPI is shown in Fig. 2.
The CLUPI analog instrument tested during the MINAR campaigns has the same image sensor as the instrument that will be on the ExoMars rover, although with different optics which provide a slightly larger field of view (20° instead of 14°). The CLUPI Calibration Target (CCT, provided by Aberystwyth), 2.5 × 2.5 cm2 in size, was also used. Images were acquired under solar spectrum lamps, as well as under UV lighting (Barnes et al. Reference Barnes2014).
Raman spectroscopy
The use of this instrument in MINAR was a collaboration with University of Leicester, UK. Raman spectroscopy is a well-established and powerful technique that allows fast, non-destructive chemical and structural identification of materials in the solid, liquid or gas state. The technique is used in many fields such as biology, chemistry, archaeology, the pharmaceuticals industry and will deployed in space for the first time in 2018 aboard ExoMars. The so-called Raman Laser Spectrometer (RLS), utilizes a continuous wave, 532 nm laser and will achieve a spectral range of 400–4000 cm−1 with a resolution of ~6 cm−1 (Rull et al. Reference Rull2011).
Two Raman instruments were used during the MINAR campaign. The first was an RLS prototype being developed at the University of Leicester, which uses a 532.3 nm excitation source and a transmission grating based spectrograph. The second was a 785 nm, commercial spectrometer that exhibits a spectral range from 100 to 2000 cm−1 and a spectral resolution of <8 cm−1. Since the RLS prototype is a laboratory-based instrument, the system needed to be reconfigured for operation in the challenging environment of the mine, to prevent problems such as dust accumulating and ultimately obstructing the incident laser light and the signal generated by the samples.
SPLIT
The use of this instrument in MINAR was a collaboration with University of Leicester, UK. A major problem facing remote robotic in situ planetary missions is ambiguity caused by the nature and characteristics of a rock's measurement surface, which may mask an underlying, more representative mineralogy, petrology or hidden biosignatures. Based on the practice of field geology, it has been firmly established for planetary surface exploration, both manned and remote, that effective sampling of rocks is key to maximizing scientific return and the delivery of mission objectives. SPLIT is a novel geo-technics approach to this problem, an instrument that breaks a rock target exactly as a field geologist would with a hammer to expose a deep internal pristine surface.
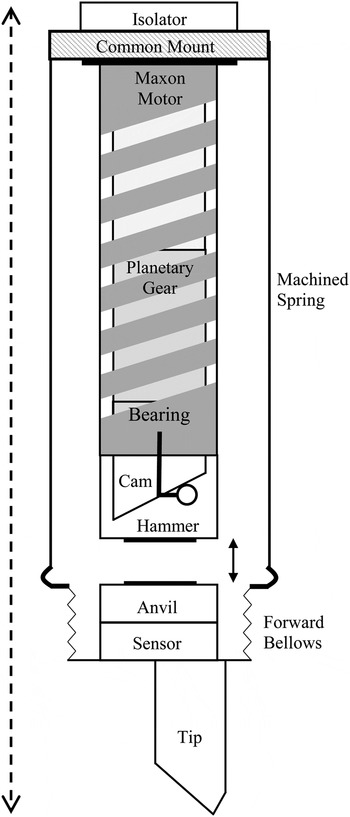
The basic breadboard version of SPLIT (Fig. 3) used during MINAR was manually operated and simulated the operation of the instrument. SPLIT is pre-loaded by approx. 10N with the tip remaining in contact with the rock; some compliance in the system is provided by the forward bellows. The mechanism of SPLIT is actuated with a Maxon EC22 motor such that for each output rotation of the planetary gearbox, the hammer mechanism generates a single impulse. Figure 3 shows the inclined helical cam and the follower, which revolves about the central axis inside the hammer. As the follower progresses the cam track, the cam body, with hammer, is displaced, thereby compressing the machined spring and storing potential energy. On completion of the cam track, the follower falls back to its original position; the compressed spring is released and thus, an impact is delivered by the hammer on the anvil, which couples the high energy impulse to the tip. This repeated impact energy is used to induce brittle fracture at the interface. However, rock materials are generally discontinuous at microscopic scales such that the crystal structure, grain boundaries, cleavage planes, as well as micro fractures and pores, all act as matrix defects exhibiting stress concentrations. SPLIT takes advantage of this feature in the various lithologies expected in planetary exploration where the cumulative effect of the technique is intended to induce low-cycle fatigue through the accumulation of plastic deformations in the rock matrix.
Schematic of the SPLIT instrument.

Complementary to other tools, SPLIT facilitates subsequent targeted sampling and extends sampling depth of current technologies. The technique can take advantage of an irregular surface, further extending the target range of other sampling tools. Furthermore, SPLIT is a controlled technique exposing a rock interior within a few minutes and may be used to manage wear of other tool tips and thus rover energy resources or deployed as a geological ‘triage’ tool to determine rock hardness with its sensor. In terms of planetary protection, the tip never contacts the newly exposed surface and enables the interpretation of a freshly cleaved pristine rock surface.
Ultrasonic drill
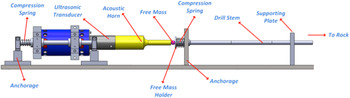
The use of this instrument in MINAR was a collaboration with University of Glasgow, UK. Ultrasonic drilling techniques provide low power, low damage alternative to rotational drills making them ideal for rover operations. The percussive drilling unit for laboratory testing (Fig. 4) is designed to collect core samples from deeper layers of rock for further geological analysis. During in-field tests in the mine, the tool is mounted on a slider which is free to move horizontally along two parallel shafts that are anchored to the ground. The drilling tool consists of an ultrasonic transducer, a free mass, a mass holder threaded for three 10 cm drills, with the end piece toothed to increase impact pressure with rock, a gear box that generates rotation for the drills and two compression springs. One spring is located between transducer and anchorage and the other one is fixed between the free mass holder and anchorage. All components are tightly held together by these two springs initially. Once the ultrasonic transducer is energized, the piezorings convert electrical pulses into small vibrations at an ultrasonic frequency about 20 KHz. The small vibration is amplified through the titanium horn and achieves a considerable level at the horn tip. Due to the pre-compression force applied by two springs, the intensive ultrasonic vibration will cause the free mass to hop between the horn tip and free mass holder chaotically at sonic frequencies. The collision of the free mass creates stress pulses that propagate to the interface of the drill tip and the rock salt (Bao et al. Reference Bao, Bar-Cohen, Chang, Dolgin, Sherrit, Pal, Du and Peterson2003). Meanwhile, rotation is generated in the drills to avoid teeth imprintation as the drill progresses into the rock, which fractures when its compressive level is exceeded. The L500 generator box maintains ultrasonic vibrations at a stable level during percussion by adjusting the supplied voltage into piezorings. During percussion, energy is transferred into the rock to pulverize it, and therefore an increase in the supplied voltage is required while the tool is advanced into the rock.
Experimental setup of the percussive drilling unit.

Handheld XRD
The use of this instrument in MINAR was a collaboration with University of Leicester, UK, while the development of the instrument itself is a collaborative project between the University of Leicester and Bruker Elemental. The target application is the rapid in situ mineralogical analysis of samples acquired in planetary exploration and ore samples for mining and mineral processing. The instrument applies energy-dispersive XRD (EDXRD) in a back-reflection geometry which has the unique characteristic of insensitivity to sample morphology (Hansford Reference Hansford2011), opening the possibility of analysis of unprepared samples. This technique has been proven experimentally in a laboratory configuration (Hansford Reference Hansford2013; Hansford et al. Reference Hansford, Turner, Staab and Vernon2014) and, more recently, the first prototype of a handheld instrument has been produced by modification of a Bruker Tracer handheld X-ray fluorescence (XRF) device. The instrument yields XRF information about the sample in addition to diffraction data. In this paper, both the XRD and XRF data are treated qualitatively. The sampled area measures approximately 8 × 11 mm2 in the prototype instrument.
As an adaptation of an existing instrument, the prototype device necessarily incorporates several design compromises. In order to achieve the required back-reflection geometry, the measurement nose was modified to move the sample further from the X-ray tube source and the detector. This modification has several knock-on effects:
-
1. The greater sample distance necessitates extended measurement times because of the reduced solid angle of the X-ray beam incident on the sample, and the reduced XRD/XRF signal from the sample incident on the detector. Data for each sample were acquired for 20 min, which is still somewhat short. Subsequent measurement times (on a separate project) have been extended to 150 min. A purpose-designed instrument is expected to achieve the same XRD signal as the prototype 150 min measurement in as little as 1–2 min.
-
2. The XRD and XRF signals are attenuated as a consequence of the longer X-ray pathlength in air, especially at lower energies. The spectra also have a relatively strong Ar–K fluorescence signal near 3 keV. Useful XRD measurements are limited to the energy range greater than ~3.2 keV, though XRF information is available down to ~2 keV.
-
3. The aluminium nosepiece is illuminated by the excitation beam in addition to the sample, leading to a significant background in all spectra. This background has been subtracted off by acquiring a spectrum with no sample in place.
The XRD technique used by the instrument relies on good powder averaging, i.e. there should ideally be a large number of randomly oriented crystallites sampled within the illuminated volume. The polyhalite/anhydrite samples appear to be fine-grained and meet this criterion. Conversely, the halite and potash samples have crystallites visible at the mm-scale or even larger. In this circumstance, the diffraction peaks have unpredictable intensities, ranging from missing to relatively intense, depending on which crystal planes happen to be presented to the instrument in the correct orientation for diffraction.
Despite these limitations, the prototype instrument has been used to demonstrate XRD measurements on unprepared rock samples. The prototype device is mounted on a stand in a benchtop configuration, which allows for convenient operation and straightforward radiation shielding. This configuration, rather than a true handheld format, is essential at the present because of the extended measurement times.
Operations and methodology
The core testing activity of the MINAR program involved using the instrumentation detailed above to characterize a set of evaporite minerals. Instruments were transported to the mine a day prior to being lowered underground. All equipment was electrically tested on site to ensure safety and then packaged into a crate. This crate was then lowered down one of the main shafts overnight and transported by forklift to the testing area.
Due to safety restrictions associated with transporting electric equipment around the mine, a number of rock samples were brought to the testing area from distal parts of the mine to diversify the mineralogy available. For the first AUPE-2 (PanCam) images, a scene with a highly diverse set of minerals was utilized (see Fig. 6). This was then cut down to three sample types to pass through the entire instrument cycle. These three lithologies were halite (NaCl), sylvinite (mechanical mixture NaCl, KCl, some CaSO4 and insoluble clays) and polyhalite (K2Ca2Mg(SO4)4•2(H2O)), and were selected due to their prevalence in the mine, economic importance and similarity to the halite and sulphate salts identified in extraterrestrial environments (Bridges & Grady Reference Bridges and Grady1999, Reference Bridges and Grady2000; Squyres et al. Reference Squyres2004; Langevin et al. Reference Langevin, Poulet, Bibring and Gondet2005; Osterloo et al. Reference Osterloo, Hamilton, Bandfield, Glotch, Baldridge, Christensen, Tornabene and Anderson2008, Reference Osterloo, Anderson, Hamilton and Hynek2010; Hynek et al. Reference Hynek, Osterloo and Kierein-Young2015). In addition to these samples, a halite wall in the mine, typical of an active mining face, was drilled into and chippings extracted and characterized.
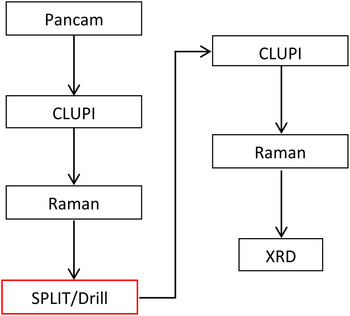
In order to characterize the lithologies accurately with the instrumentation available, it was important to construct a methodical and thorough working system that would mimic remote autonomous operations in a deconstructed format (summarized in Fig. 5). Samples were firstly labelled and catalogued. Matrices were used to monitor the progress of each sample through the instrument chain.
Instrument cycle devised for MINAR III. Non-contact contextual instruments were deployed initially (AUPE-2, CLUPI), followed by non-contact close-up (Raman, XRD) and then destructive instruments. This format is designed to mimic rover operations in a deconstructed format.

The instrument cycle firstly involved deploying contextual instruments to characterize large-scale features in the evaporite minerals. Illumination was provided by 2 × 400 W tungsten halogen lights and images for both AUPE-2 and CLUPI were calibrated using a Macbeth ColorChecker© placed in the scene. The details of the halite face were obscured by a layer of dust and so a region of the wall was washed down with water. AUPE-2 captured images of the exposed halite face and loose samples from a distance of 4.85 m. CLUPI followed AUPE-2, capturing close ups of specific 10 × 7.5 cm2 areas marked out on the surface of the wall and each rock sample, ensuring measurements were taken consistently from the same region. Raman spectra were then acquired on these samples to examine fine-scale variations in mineralogy. To obtain sufficiently high-quality data, the operating modes and acquisition strategies (i.e. integration times, number of acquisitions and laser power) for both Raman instruments were optimized for each individual sample. Once these surface measurements were complete, the samples were fractured with the SPLIT instrument, or drilled using the hypersonic drill. The new fresh surface or drill chippings were then reexamined with the CLUPI and Raman instruments. Finally, XRD/XRF was carried out on the samples at the end of the cycle.
Results
AUPE-2
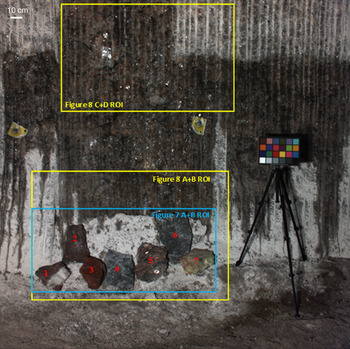
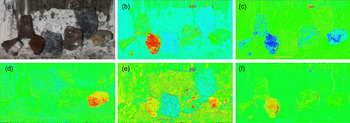
AUPE-2 was able to capture and detail the analog testing area and samples. Images were processed using the data processing pipeline under development for the PanCam instrument (Barnes et al. Reference Barnes2011) and data products including colour composites and spectral parameter maps were generated. A colour image of the scene is shown in Fig. 6 and spectral parameter maps are shown in Fig. 7.
Colour composite image of the test scene and target samples in Boulby mine using the broadband RGB filers. Regions of interest (ROI) for multispectral analysis are shown for Fig. 7. Image was captured from a distance of 4.85 m and illuminated by 2 × 400 W tungsten halogen lights. Samples are: 1, 2 Sylvinite (composed of NaCl, KCl, some CaSO4 and insoluble clays); 3, Carnallite (KMgCl3•6(H2O)); 4, 6, Polyhalite (K2Ca2Mg(SO4)4•2(H2O)); 5, Volkovskite (KCa4B6O8(OH)7Cl•4(H2O)); 7, Boracite Mg3B7O13Cl). The background is the halite wall of the mine.

Spectral parameter maps generated from AUPE-2 WAC multispectral data, demonstrating how the lithological diversity represented by the target samples in A is captured by exploiting particular wavelengths. (a) ROI from the colour composite of the scene (see Fig. 6); (b) Red/Blue ratio (671/438 nm); (c) 600 nm band depth; (d) 950–1000 nm slope; (e) Blue/Red slope (438–671 nm); (f) 532 nm band depth. Artefacts in the corners of the images are due to vignetting.

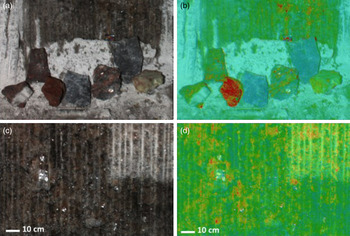
The colour composite image produced by the AUPE-2 wide-angle cameras (WACs) and broadband colour filters accurately represents the true colour within the mine environment, despite challenging lighting conditions and the ubiquitous presence of airborne salt dust. Examination of the specific regions of the multispectral data allowed detailed mineralogical features to be distinguished (Fig. 7). Mapping of the Blue/Red slope (438–671 nm) spectral parameter values proved effective at distinguishing the polyhalite targets [‘4’ and ‘6’ in Fig. 7(e)] from the surrounding lithologies, predominantly chloride-rich salts found within the mine. Importantly, imaging was able to detect the mineralogical and compositional variation seen within target ‘5’, volkovskite. Mapping of the 950–1000 nm absorption slope values typically used to highlight hydrated minerals (minerals with a H2O or OH– as part of their mineral structure) shows widespread hydration across the scene, with the exception of the anhydrous Boracite sample, which is characterized by a strong positive 950–1000 nm slope due to a deep, broad absorption in the near-infrared.
In the halite wall, AUPE-2 was able to emphasize otherwise subtle spectral and colour features, such as the iron-rich components of the mine face revealed by mapping the Blue–Red slope (440–600 nm) values across the field of view (Fig. 8).
Spectral parameter map overlays onto the colour background image showing the correlation of spectral properties with lithological and structural features. (a, b) Colour ROI (see Fig. 6) and associated Red/Blue ratio overlay; (c, d) colour ROI (see Fig. 6) with associated Blue/Red slope (440–660 nm), revealing the iron-rich regions (coloured red) of the exposed surface, in both the cleaned and uncleaned (top right corner) areas of the rock face.

CLUPI
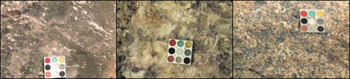
CLUPI was also able to capture suitable images for characterizing samples (Fig. 9). Close up images of the halite, potash and polyhalite samples were captured under normal lighting conditions and UV showing mineral variations and inclusions within the sample set.
Close up images of polyhalite (left), halite (centre) and sylvinite (right) taken under white light. CLUPI Calibration Target measures 2.5 × 2.5 cm2.

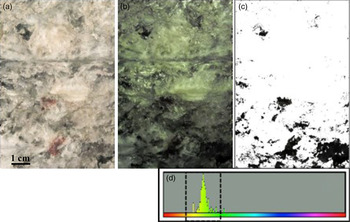
Illumination with UV-A light produced a pale-green fluorescence response within the halite component of this target, and no fluorescence from the clay (dark inclusions) or iron-rich inclusions. By exploiting the green fluorescence, colour threshold analysis can be used to isolate the luminescent parts of the image. This algorithm was able to show that approximately 10% of the halite target (Fig. 10) comprises the non-luminescing clay and iron-rich regions.
Halite sample close-up area B. (a) White light CLUPI image; (b) UV-enhanced CLUPI image; (c) Non-luminescing regions (black) and luminescent regions (white) within the UV-enhanced CLUPI image B; (d) Colour histogram of ‘B’ showing the green fluorescence and resulting threshold boundaries for ‘C’.

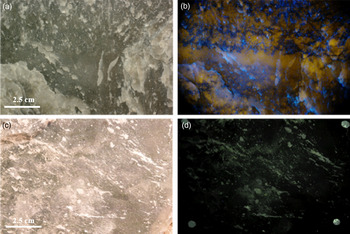
Examining the polyhalite in situ with the UV-enhanced CLUPI system produced less satisfactory images. Consequently, another sample of polyhalite was returned to the laboratory at Aberystwyth University and analysed with a combined UV LED (λ = 365 nm) DSLR setup (Fig. 11). The laboratory setup differed from the UV-enhanced CLUPI in two key ways. Firstly, the output power of the laboratory UV LED light source was significantly more (~360 mW) than that used for the UV-enhanced CLUPI. Secondly, the laboratory DSLR included a UV-blocking filter, which excluded wavelengths <395 nm, thereby allowing only the fluorescence response to reach the camera detector.
Laboratory UV-DSLR and in situ UV-CLUPI imaging of two samples of polyhalite rock. (a) White-light laboratory DSLR image (field of view 11.5 cm across); (b) UV-SLR laboratory DSLR image showing bright yellow fluorescence of the polyhalite component of the rock; (c) White-light in situ CLUPI image; (d) UV-enhanced CLUPI image, showing minor pale-green fluorescence that highlights the fractured areas of the rock surface only.

The different setup used in the laboratory produce different data products (Fig. 11), demonstrating the necessity of a high power UV illumination source for exciting a fluorescence response that is detectable with either CLUPI or DSLR camera systems. Similar colour threshold analysis to that displayed in Fig. 10 reveals that the view in Fig. 11 is approximately 60% polyhalite, 40% anhydrite.
Two significant results from this approach are apparent. Firstly, the UV-enhanced image allows the anhydrite (CaSO4) component of the polyhalite to be quantified. Secondly, fluorescence allowed fracture planes to be distinguished. Such fracture planes can act as conduits for fluids, delivering exogenous nutrients and energy sources to a habitat that is otherwise in low porosity material.
Raman spectroscopy
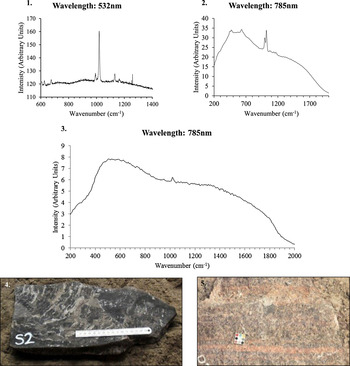
Raman spectra were able to be captured from the surface of the samples and resolve individual minerals. The best spectra came from the freshest, dust-free regions. For example, the panels in Fig. 12 present typical Raman spectra (from the triplicate measurements) obtained from two separate areas on the surface of the polyhalite and sylvinite.
Two representative Raman spectra (plots 1–2) acquired from the surface of a polyhalite sample and one from a sylvinite sample (plot 3). The data were collected with both 532 and 785 nm excitation sources. An excitation peak matches that is expected to be produced by a polyhalite mineral in both the polyhalite rock samples. The single excitation peak in the sylvinite sample (plot 3) is from the rock's small anhydrite component. Photographs 5 and 6 show the polyhalite and sylvinite samples the spectra were recorded from, respectively.

XRD
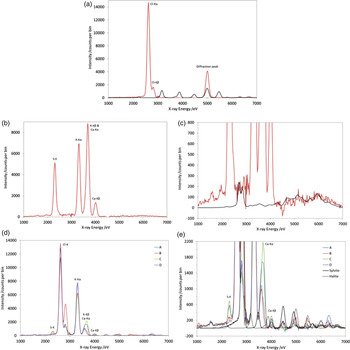
The handheld XRD was then used to carry out further mineral characterization. XRF information was also returned on each sample. Despite the difficulties associated with carrying out XRD on unprepared samples, the instrument was able to record meaningful diffraction patterns associated with evaporite minerals in some lithologies (Fig. 13).
Handheld XRD/XRF results; fluorescence peaks are labelled with the corresponding element. (a) Halite sample: the measured spectrum is shown in red and a diffraction-only simulation in black, illustrating the expected positions of the diffraction peaks. (b) Polyhalite sample with the fluorescence peaks are labelled. (c) As (b) but with an expanded vertical scale and with a diffraction-only simulation in black. The experimental data is negative near 4.5 keV because of imperfect background subtraction. (d) Banded potash sample measured at four different points. (e) As (d) but with an expanded vertical scale. Diffraction-only simulations are shown for sylvite (solid black) and halite (dashed black) minerals.

Figure 13(a) shows the spectrum for a halite sample, with strong Cl–K fluorescence peaks near 2.6 keV. Na–K fluorescence is absent because the characteristic energy (1.04 keV for Na–Kα) is too low to penetrate the air gap. The lack of potassium fluorescence peaks, near 3.3 keV, shows that this sample contains negligible sylvite. There is a single peak near 5 keV which is not assignable to any fluorescence peak, but occurs accurately at the energy expected for one of the halite diffraction peaks. The remaining diffraction peaks which could occur in the observed spectral range are absent, illustrating nicely the issue concerning large crystallites described in the XRD instrument description.
Figure 13(b) and (c) show the XRD/XRF data for a polyhalite sample. S, K and Ca fluorescence peaks are all observed while Mg and O peaks are missing because their energies are too low (1.25 and 0.53 keV, respectively). A simulation of the expected XRD spectrum is also shown. Polyhalite has a low-symmetry crystal structure (space group P
 $\overline 1 $
, triclinic crystal system) which leads to many overlapped diffraction lines: there almost 900 lines in the spectral range 3–7 keV, compared with just 11 lines for halite (high-symmetry: space group Fm
 $\overline 3 $
m, cubic crystal system). Consequently, only a diffraction ‘profile’ can be experimentally observed. Whilst the data certainly would not admit identification of polyhalite in an unknown sample, the agreement between model and data is consistent with polyhalite.
A potash sample was also measured with the handheld XRD instrument. This sample showed banding which was clearly visible to the naked eye as colour variation. Data for one area within each of four bands was acquired, and the results are shown in Fig. 13(d) and (e). The predominance of the K and Cl fluorescence peaks confirms the identification of this sample as potash. The relative quantity of halite in the sample cannot easily be assessed using the XRF information since the Na peak is too low in energy to be observed. Two of the sampling areas have significant Ca and S XRF peaks, suggesting the presence of sulphate minerals in these bands and the reason for their visual difference. The vertical scale has been expanded in Fig. 13(e). The energy range above 4.2 keV is free from XRF peaks, allowing assessment of the diffraction information. Area B clearly shows diffraction peaks consistent with both halite and sylvite, confirming the presence of halite in this sample. Area A shows two diffraction peaks, one of which is consistent with sylvite (4.9 keV) and the other is consistent with either sylvite or halite (6.3 keV). The data for areas C and D are less diagnostic, but are certainly consistent with the presence of these two chloride minerals.
SPLIT and the ultrasonic drill
SPLIT performed well in exposing fresh surfaces in the evaporite minerals. The SPLIT technique successfully exposed a fresh surface by exploiting weak planes in the harder polyhalite samples (exploiting low-cycle fatigue to propagate micro cracks) and induce brittle fracture at the inter-granular boundaries of secondary ore samples (secondary ore containing sylvite, silt/clays, anhydrite & halite with volkovskite formations). The absence of powder covering the freshly exposed surfaces showed SPLIT's potential to expose a pristine surface suitable for analysis with both optical and spectroscopic instruments.
The ultrasonic drill successfully operated in the mine. It was able to core a hole into the halite wall and potash samples, but caused brittle deformation in the polyhalite samples, leading to large-scale fracturing before it could move through the sample. The core hole produced could potentially be explored by non-contact instrumentation such as Raman spectrometry to investigate minerals, mineral variations and the presence of organics in a depth profile into a sample.
Discussion
Crucial to assessing the geology and habitability of surface and deep subsurface environments on the Earth and on other planetary bodies is the ability to map minerals, characterize their composition, quantify their abundance and assess variations and fracture pathways that might create habitable conditions. In this MINAR field campaign, we were concerned with carrying out an integrated test of instrumentation to map defined minerals and their internal variations at metre to millimetre scales in the deep subsurface. This study was focused on the geological and geochemical context for life. We leave the discussion of the subsurface biota to other publications.
The campaign was able to show that several instruments destined for Mars exploration can be used in an integrated fashion to map minerals and their diversity during subsurface exploration. AUPE-2, the PanCam precursor, was able to visualize differences in minerals at the metre scale, but also resolve iron-rich inclusions within the primary mineral (halite) at sub-centimetre scales. An environment which contains only one mineral is unlikely to provide the full nutrient requirements for life (CHNOPS and other elements) or sufficient redox couples to support diverse energy sources. In general, an environment will be more habitable if it contains a diversity of minerals, each of which may contribute to the suite of required elements. As PanCam provides an opportunity to make a first-order assessment of an environment and whether it is worthy of further exploration, these data show that it can be used to select mineralogically diverse evaporitic environments for more in-depth exploration. Furthermore, the ability to identify and map minerals in darkness using artificial lighting and in a dust-laden atmosphere, both challenges associated with terrestrial and extraterrestrial subsurface environments, shows the effectiveness of PanCam and similar instruments in the exploration of subsurface extraterrestrial locations.
At finer resolution, the CLUPI instrument showed that mineral variations and inclusions can be mapped at centimetre scales in smaller sample sets. It also showed that by using specific filters and image processing it is possible to quantify the space in any given micro-environment made up by non-primary minerals, yielding a potentially quantifiable way of assessing the potential of any given micro-environment to provide a range of elements and potentially organics required by life. This can be considered to be a crude measure of habitability. In particular, UV fluorescence was shown to be effective in identifying clay and iron-rich regions, in which sources of macro-nutrients (CHNOPS) and energy sources (e.g. organics), not provided by the halite, would be concentrated. UV fluorescence was also shown to be an effective way of examining not merely mineral variations within a rock, but also fracture planes. Fractures are important features from the point of habitability as they provide access points for exogenous delivery of nutrients, energy supplies and water and they can provide surfaces on which microorganisms can grow (Pedersen Reference Pedersen1997; Geller et al. Reference Geller, Holman, Su, Conrad, Pruess and Hunter-Cevera2000; Cockell et al. Reference Cockell, Lee, Broady, Lim, Osinski, Parnell, Koeberl, Pesonen and Salminen2005). By mapping the fractures within a rock alongside mineral variations, a more accurate assessment can be made as to whether the rock provides a suitable environment for life and may also provide a way of selecting fractures for more detailed analysis with respect to the presence of life or biosignatures.
The detection of these variations in rocks can further be explored using Raman spectrometry to positively identify specific minerals and their distribution in the rocks. In the case of evaporitic minerals, we were able to show that in the field Raman instrumentation can be used to gather spectra of minerals within micro-environments which themselves can be used to determine the presence of particular elements. Raman scattering efficiencies are higher for covalent bonds than for ionic bonds and the technique is particularly sensitive to the sulphate and carbonate groups present in the samples studied here. For example, multiple bands associated with Ca, Mg, Na and K sulphates were evident in Raman spectra. In addition, anhydrite can be readily identified in the sylvinite sample through the sulphate band which appears at 1020 cm−1, despite its relatively small concentration in the material. Bands associated with NaCl and KCl (i.e. lattice modes) occur at much lower wavenumbers and are generally below the effective wavenumber limit of the instruments used in this study. This highlights the importance of a combined instrument suite in the study of evaporitic environments on Mars, since although these primary minerals could not be easily detected by Raman, and they were identified using other instruments.
A method such as XRD can be used to support mineral identification and thus identify elements and potential mineral sources required by life. Despite the limitations described in the section ‘Handheld XRD’, the prototype instrument was able to provide strong supporting evidence for the mineralogical identification for most samples. Crucially, it was able to achieve this in a compact format with no sample preparation.
From a geotechnical point of view we were able to show that a geologist's hammer (SPLIT) can expose fresh, uneroded surfaces that can be examined for mineralogy and habitability. Ultrasonic drilling is able to open up drill holes within rocks, again exposing fresh surfaces which can provide suitable material for examining minerals and habitability.
In summary, the deep subsurface exploration of extraterrestrial evaporite or other mineral environments requires instruments that can operate in darkness using artificial lighting, can tolerate a dust-laden atmosphere and can provide complementary analysis of minerals and elements where weaknesses in detection in one instrument can be overcome by detection capabilities in others. The combined instrument suite tested here could potentially be deployed on a deep subsurface rover or operated by human explorers to successfully characterize deep subsurface geologies from metre to centimetre scales and to locate samples that have potentially habitable conditions for follow-up astrobiological analysis.
Technical advancements
MINAR provided an opportunity to test prototype instrumentation on Mars relevant lithologies in a deep subsurface setting, allowing the teams to investigate the challenges associated with optimizing and improving performance and sampling strategies while operating in challenging environmental conditions. Each instrument benefited from this in a number of areas from testing in the deep subsurface.
The unusual illumination conditions in the mine provided a comprehensive test of the auto-exposure algorithms and data processing pipelines under development for the PanCam instrument, demonstrating their effectiveness in the challenging conditions of subsurface exploration. The value of secondary data was also highlighted to the team during this exercise by demonstrating that the detail obscured by the dust can be enhanced with appropriate image processing (Fig. 14). CLUPI benefited from a similar test of its imaging capabilities, highlighting the need for multiscale analysis with PanCam in order to characterize an unknown rock. The UV irradiation work also confirmed the power of combining close up imagers like CLUPI, with a UV source and filters, to extract more information from evaporite minerals.
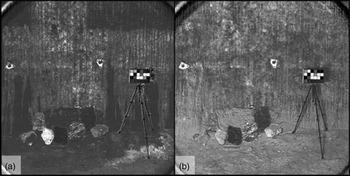
Spectral parameter maps generated using the 438 and 671 nm filters – (a) Red/Blue ratio, (b) Blue/Red slope. Artefacts in the corners of the images are due to vignetting. The halite wall is covered in a 1–3 cm thick layer of halite caked on the wall as a result of the mining process. Time was spent cleaning the lighter areas in image a. with wire brushes and water to expose a fresh surface. Blue/Red slope in the AUPE-2 data is seemingly unaffected by the highly reflective salt crystal surfaces and is able to resolve detail behind the salt crust.

The RLS prototype needed to be reconfigured for operation in the mine. Its success in recording spectra from the geological samples showed that these modifications were adequate for the instrument to successfully function in the subsurface environment. However, the instrument's weakness in examining particular evaporite minerals highlighted the need for the synergy of many instruments.
The deployment of the handheld XRD prototype within the Boulby mine represented the first field test of the adapted instrument. This provided a proof of concept for this instrument, examining its abilities to rapidly characterize evaporite minerals without any of the sample processing typically required for successful XRD measurements. This first test has provided valuable experience in the practical operation of the instrument, particularly with regards to overcoming the compromises inherent in the prototype.
SPLIT and the ultrasonic drill both demonstrated their ability to work in a subsurface field environment and successfully drill into and break evaporite minerals. The drill underwent a number of modifications during MINAR in order to enable it to more effectively drill into the evaporite minerals available and to protect it from the dust that was generated. MINAR allowed SPLIT to be tested on a number of new Mars relevant lithologies, enabling the team to better understand how to approach fracturing these types of rock through measuring the forces required and locating the planes of weakness to exploit. These data are being used to improve the development of SPLIT in the future and the team's experience in dealing with a variety of lithologies, as well as develop autonomous operation of the instrument for future surface and subsurface planetary exploration.
The integration of the operation of different instruments is critical to planetary science missions and would be vital in any attempt to explore the extra-terrestrial deep subsurface. MINAR helped improve communication between the different instrument teams, improving their understanding of the strengths and weaknesses of each instrument and how to work together to maximize scientific return.
Technology transfer to economic mining
One objective of MINAR is to enhance technology transfer from the space sector to the mining industry. A number of potential technology transfer applications to advance mining operations were identified during the campaigns. Here, three examples of the possibilities discovered are briefly described:
-
1. It was observed that under UV illumination, the polyhalite samples displayed distinct visual variation. The bulk polyhalite rock is composed predominantly of a mixture of the mineral polyhalite and anhydrite (CaSO4). The proportion of these two minerals governs the economic viability of the rock. Under white light, the two are hard to distinguish by eye, making qualitative estimations of ore grade underground very difficult to achieve. As a consequence, ore grade has to be determined in the processing plant at the surface. Transporting material from the deep subsurface to the plant is time consuming and costly, meaning assessing ore quality in situ would dramatically increase efficiency. When illuminated with UV light, it was discovered that the anhydrite and polyhalite appeared visually distinct due to the strong luminescence response of the polyhalite, allowing the ore grade of the sample to be estimated. MINAR showed how UV lighting systems could help in the real time in situ assessment of ore quality in a range of different geological settings in deep subsurface mines, where distinguishing ore and gangue is challenging.
-
2. Increasing automation in salt mining is challenging for a number of reasons. Typically as a mining machine removes material it leaves a thick salt crust on the walls and generates a significant amount of dust, hiding the fresh rock face behind. The Blue–Red slope in the AUPE-2 data appears highly effective at revealing the spectral variation of the mining face, both with and without this surface dust cover, seemingly unaffected by specular reflections from highly reflective salt crystal surfaces (Fig. 14). It also appears able to distinguish the iron-rich inclusions of the mine face, highlighted by its increased Blue–Red slope compared to the surrounding rock matrix. This ability to resolve detailed mineralogical information in the presence of an obtrusive salt dust layer could have important applications. More automated mining systems involving the mining machines characterizing the minerals ahead of them, with a real time system using multispectral images, could be developed from this technology. Alternatively, instruments carried by miners could be used to map economic ores on dust-covered mining walls. Whilst further work would be required to integrate such a system effectively into the mining environment, planetary science imaging technologies such as this could help contribute to an increasingly automated mining system, improving efficiency and cutting costs.
-
3. The portable XRD used at MINAR successfully demonstrated its potential to be used for mineral characterization in situ on un-prepared geological samples. Since MINAR III, the prototype has undergone extensive testing with iron ore and limestone samples. The results are very promising (Hansford Reference Hansford2015) and it is anticipated that in many instances, in the context of mining, a rapid in situ semi-quantitative measurement will be possible with a genuinely handheld device without sample preparation.
These examples illustrate the powerful synergies that can be realized in a relatively short period of time by bringing planetary analog research into an industrial environment. It also highlights the potentially untapped benefits space exploration technologies have to offer other industries.
Conclusion
The MINAR I-III program successfully employed a set of planetary instrumentation to study deep subsurface habitability, focusing on characterising the geological context for life. We demonstrate that coordinated testing of instrumentation in the deep subsurface has generated new knowledge for instrument development and refinement for the subsurface exploration of extraterrestrial environments. MINAR also demonstrated that instrumentation already being developed for other planetary exploration missions could be adapted for future deep subsurface exploratory missions.
Through undertaking this research within a working mine, we show that extraterrestrial analog research can be used to achieve progress in solving Earth-based problems such as safe and economically effective mining. As ores become lower grade and more localized, finding ways to improve the economic viability of mining using novel technologies has become crucial. This highlights the potential spin-off opportunities which can arise from developing technology to explore space and the benefits offered by promoting technical discourse between industrial sectors.
Acknowledgements
We thank The Crown Estate, as mineral owner for the part of the mine beneath the seabed, for generous support of the MINAR program. Equally, we thank ICL for extensive logistical support at Boulby. We would also like to acknowledge the funding provided by the STFC Impact Acceleration Fund. Claire R. Cousins is supported by a Royal Society of Edinburgh Research Fellowship. The development of the ExoMars PanCam, the AUPE2 system and the PanCam data processing pipeline has been supported by funding from the UK Space Agency (lead funding agency) and the European Community's Seventh Framework Program.