Among healthcare-associated infections (HAIs), surgical site infections (SSIs) are a major focus of prevention efforts. Many states have enacted legislation to report SSIs to allow benchmarking and to draw attention to problematic outliers, intending to galvanize change. The Centers for Medicare and Medicaid Services (CMS) Hospital Value-Based Purchasing (VBP) program links Medicare’s payment system to national SSI rankings. In October 2014, the CMS began reducing Medicare payments to hospitals participating in the Inpatient Prospective Payment System (IPPS) that ranked in the worst-performing quartile for hospital-acquired conditions. 1 The IPPS hospital reports required data on colon surgery and abdominal hysterectomy via the National Healthcare Safety Network system (NHSN), which generates standardized infection ratios (SIRs) 2 as part of a composite score used by the VBP and the Hospital-Acquired Condition Reduction Program (Online Supplementary Appendix A).
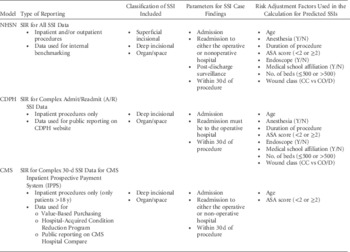
California hospitals can be ranked using 3 different SIR metrics that differ based on patient inclusion criteria and risk adjustment models (Table 1). 2 , Reference Mu, Edwards and Horan 3 Significant differences in SIRs in a hospital may cause confusion for hospital leadership, the patients, and the public. Differences in SIR ranks relative to other hospitals may impact consumer choice and thus have serious implications for facilities under the CMS pay-for-performance financial incentive or penalty programs. In this study, we explored the frequency and magnitude of differences among these 3 models.
Differences Among the 3 Colon SSI SIR Reporting Models Used by California Hospitals

NOTE. ASA, American Society of Anesthesiology; CC, clean contaminated; CDPH, California Department of Public Health; CO, contaminated; CMS, Centers for Medicare and Medicaid Services; D, dirty; NHSN, National Healthcare Safety Network; SIR, Standardized Infection Ratio; SSI, surgical site infection.
METHODS
We conducted a cross-sectional observational study of a convenience sample of teaching and community hospitals. Each hospital downloaded their colon surgery data from the CDC’s NHSN website on July 2, 2015 (including number of procedures, observed and expected numbers of SSIs, SIRs with confidence intervals and P values for January through December 2014). The NHSN generates SIRs using 3 models: (1) the “NHSN” All-SSI model, (2) the “CDPH” Complex Admission/Readmission (A/R) model, and (3) the “CMS” Complex 30-Day model. Hospital performance ratings were determined by statistically significant (P<.05) SIR values <1.0 (a positive rating), statistically significant SIR >1.0 (a negative rating), or values indicating no statistical difference from 1.0 (a neutral rating). Differences in hospital rank according to the 3 SIR methods were assessed using the Friedman test and Kendall’s W. Consistency in the direction of discord was determined by exploratory analysis. Calculations were performed using SPSS version 12.0 (SPSS, IBM, Armonk, NY).
RESULTS
In total, 20 Northern and Southern California acute care hospitals participated: 12 teaching hospitals (60%) and 8 non-teaching hospitals (40%). Among these hospitals, 5 (25%) had >500 beds, 11 (55%) had 250–500 beds, and 4 (20%) had <250 beds. Only 1 hospital (5%), which reported zero SSIs, had the same SIR value in all 3 models.
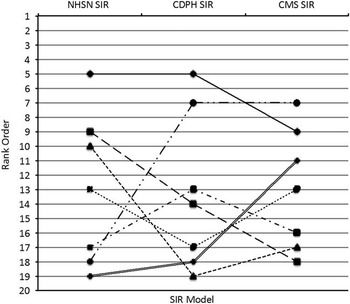
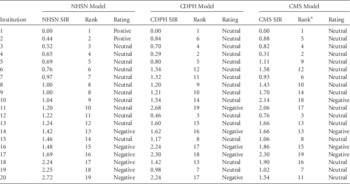
Table 2 shows the extent to which SIR rank (1 [best] to 20 [worst]) and performance rating of California hospitals changed depending on whether the ranks were computed according to NHSN, CDPH, or CMS criteria (Online Supplementary Appendix B). There were statistically significant differences in the percentile distribution of SIR values for the 20 hospitals according to the 3 different models (Friedman χ2=44.93; 19 degrees of freedom; P=.001). The percentile distribution of SIR values generated in the CMS model tended to be higher than that of the CDPH model, and that of the CDPH model was higher than that of the NHSN model. Agreement among CMS, CDPH, and NHSN values was significantly better than zero (Kendall’s W=0.79; P=.001), and the 0.7–0.8 range (Kendall’s W) was often interpreted as reaching “good” agreement. However, this range did not prove good enough for the intended purpose. The magnitude of discord in rank and SIR among the 3 models often reflected a small shift, and the direction of discord (ie, upward or downward) was not consistent (Figure 1). Several hospitals exhibited a hockey-stick–shaped SIR distribution (eg, hospitals 5, 11, 19, 20); some exhibited a V or inverted V distribution (eg, hospitals 14 and 18); and others exhibited a sloped line (eg, hospital 10). Nearly half of the shifts in rank involved >3 positions of movement upward or downward. In 7 participating hospitals (35%), the shift was large enough to create statistically significant SIR interpretations, leading to contradictory conclusions. Of the 5 hospitals in the lowest CMS quartile (ranked 15–19), 2 hospitals would be subjected to financial penalties despite the fact that their SIRs were not statistically high. Teaching status, bed size, and CMS case-mix index showed no statistically significant impact in our analysis.
Selected hospitals demonstrating discordant SIRs and respective rank based on SIR model.

Comparison of Colon SSI SIR Using NHSN, CDPH, and CMS Models for 2014

NOTE. A/R, admit/readmit; CDPH, California Department of Public Health; CMS, Centers for Medicare and Medicaid Services; NHSN, National Healthcare Safety Network; SIR, standardized infection ratio; SSI, surgical site infection. Downloaded July 2, 2015.
a The CMS proposes penalties for poor performing hospitals in the last quartile.
DISCUSSION
Too much of the information reported to the public increases confusion. We found substantial variation across the 3 SIR measures of SSI performance for 20 California hospitals. One-third of the hospitals had significantly discordant quality ratings across these 3 metrics, which could result in different actions by patients seeking high-quality care or by hospital leaders aiming to improve and maintain patient safety and high-quality care. This confusion is heightened because all 3 metrics are identified using the same nomenclature, “SIR,” thus implying that they are comparable. While serious discrepancies have been reported among other aggregate quality metrics, those metrics are at least known by different names.Reference Austin, Jha and Roman 4 – Reference Birnbaum 6
At least 3 possible reasons underly the observed discrepancies. First, the inclusion criteria of SSI differ; only 1 model includes superficial SSI events, whereas the other 2 models do not. Also, the CDPH model includes only SSIs for patients readmitted to the operative hospital. Yokoe et alReference Yokoe, Avery, Platt and Huang 7 report that limiting surveillance to the operative hospital for SSI readmissions underestimates SSIs for total knee arthroplasty and total hip arthroplasty by missing 17% of cases. Failing to count SSIs detected at nonoperative hospitals resulted in a better relative rank for 61% of hospitals performing total hip and total knee arthroplasties.Reference Yokoe, Avery, Platt and Huang 7 Whether a large proportion of colon SSIs are missed due to restriction of surveillance to the operative hospital remains to be determined.
Second, the 3 models use different variables in their risk adjustment calculations. For example, the CMS adjustment model includes only age and American Society of Anesthesiologists (ASA) Physical Status score but excludes wound class, a factor known to impact SSI risk in colon surgery.Reference Hübner, Diana and Zanetti 8 , Reference Serra-Aracil, Garcia-Domingo and Pares 9 This exclusion could explain the smaller number of expected infections compared to observed infections. Furthermore, the CMS model does not account for facility factors that may be associated with SSI risk. Consequently, institutions could be penalized because of their patient population, the calculation method selected, and/or the degree of appropriate risk stratification. Therefore, it is not surprising that hospitals with higher hospital quality summary scores (eg, those that had quality accreditations, offered more services, were major institutions, and/or demonstrated better than average performance on other process and outcome measures) were frequently poor performers and were more often penalized by the Hospital-Acquired Condition Reduction Program.Reference Rajaram, Chung and Kinnier 10 – Reference Minami, Dahke and Barnard 12
Third, it is unknown whether the shifting-base distortion demonstrated with central line-associated bloodstream (CLA-BSI) SIRs might also occur with SSI SIRs.Reference Birnbaum, Zarate and Marfin 13 SSI SIRs are calculated using logistic regression unlike CLA-BSI SIRs that are calculated as a simple weighted average.
Extremely favorable SIRs from a single institution could represent either excellence in SSI prevention processes or underreporting of SSIs. Therefore, validation of HAI reporting processes is critical to ensuring that each hospital’s surveillance program meets predetermined minimum sensitivity and specificity standards for case detection and case classification.Reference Letourneau, Calderwood and Huang 14 In 2013, the CDPH conducted a validation study on the accuracy of SSI reporting following colon surgery using a sample of 47 hospitals that represented ~10% of all SSI-reporting acute-care hospitals in California. The sensitivity of self-reporting was 50%. When diagnostic ICD-9 flag codes were used, it was estimated that 1 SSI would be found for every 2–3 records reviewed, which would improve the sensitivity by ~34%.Reference Calderwood, Huang and Keller 15
This pilot study has important limitations. First, with only 20 hospitals, it has limited statistical power. A broader sample is needed to more fully explore statistical differences among the various models. Second, teaching status was accepted based upon self-report; the accuracy with which California hospitals categorize their extent of teaching is unknown, but discrepancies have been reported elsewhere.Reference Zarate and Birnbaum 16
An ideal model might include the following: better stratification of colon surgery procedures; NHSN’s current risk adjustment factors; nonmodifiable risk factors that addresses the case-mix index differences between institutions; and all SSIs (including superficial incisional that require hospitalization for management of SSI) and deep incisional and organ/space SSIs, regardless of readmission to the operative or nonoperative hospital. The inclusion of superficial SSIs remains controversial because most superficial incisional SSIs are not serious and are often managed in the outpatient setting. However, significant financial and physical morbidity can be associated with superficial SSIs that require hospitalization. From a public health perspective, all SSIs present opportunities for infection prevention interventions.
In summary, this study is the first to examine the extent of agreement and discord among SSI models. A hospital’s colon surgery SSI SIR values and associated ranks differ depending on the SIR calculation used. Readers knowledgeable in the various models might recognize only those differences that are statistically significant; however, the broader public audience might consider any difference in the numbers or rank as important, and CMS incentives and penalties are triggered according to rank. While no single metric is ideal, healthcare quality would be better served if there were a single well-adjusted model that would better reflect quality outcomes.
ACKNOWLEDGMENTS
Financial support: No financial support was provided relevant to this article.
Potential conflicts of interest: All authors report no conflicts of interest relevant to this article.
SUPPLEMENTARY MATERIAL
To view supplementary material for this article, please visit http://dx.doi.org/10.1017/ice.2016.167.