Implications
There is a need to quantify methane (CH4) emission of dairy cows, given the importance of CH4 as a greenhouse gas. This study investigated the relationship between CH4 emission and potential biomarkers in milk, namely fatty acids (FA), volatile and non-volatile metabolites of dairy cows. Results indicate that milk fatty acids (MFA) alone have moderate to good potential to predict CH4 emission, and furthermore that the prediction models become more accurate and precise when including volatile metabolites (V) and, in particular, non-volatile metabolites (NV). These models can aid in the effort to understand and mitigate CH4 emissions of dairy cows.
Introduction
Quantification of CH4 emission of dairy cows is important to understand factors that contribute to the variation in CH4 emission, and to identify effective mitigation strategies. Several CH4 measurement techniques have been developed, but are not suitable for precise and accurate large-scale measurements (Hammond et al., Reference Hammond, Crompton, Bannink, Dijkstra, Yáñez-Ruiz, O’Kiely, Kebreab, Eugène, Yu, Shingfield, Schwarm, Hristov and Reynolds2016). Proxies (i.e. indirect traits related to CH4 emission), such as milk composition, may be good alternatives. Milk contains a large number of metabolites, including MFA, that may give information on rumen metabolism (Fievez et al., Reference Fievez, Colman, Castro-Montoya, Stefanov and Vlaeminck2012). Milk FA arise from two sources, namely de novo synthesis within the mammary gland mainly from rumen acetate and β-hydroxybutyrate, and mammary uptake of FA that originate from intestinal absorption of dietary and microbial FA and FA from body fat mobilisation (Chilliard et al., 2009). Common biochemical pathways between CH4, acetate and butyrate in the rumen, and CH4 reducing effects of dietary long-chain FA (Chilliard et al., 2009), suggest a relationship between CH4 emission and MFA profile, and several studies have predicted CH4 emission of dairy cows from MFA concentrations (reviewed by Van Gastelen and Dijkstra, Reference Van Gastelen and Dijkstra2016). Milk also contains V and NV from different chemical families. Milk V have been used for tracing animal feeding systems (e.g. Villeneuve et al., Reference Villeneuve, Lebeuf, Gervais, Tremblay, Vuillemard, Fortin and Chouinard2013), because diet composition can influence V composition in milk, either by transferring odour-active molecules (Buchin et al., Reference Buchin, Martin, Dupont, Bornard and Achilleos1999) or by interacting with rumen metabolism (Urbach, Reference Urbach1990). Milk NV may be related to the health status of cows, and these metabolites are potential biomarkers for mastitis and subclinical ketosis (Enjalbert et al., Reference Enjalbert, Nicot, Bayourthe and Moncoulon2001; Sundekilde et al., Reference Sundekilde, Poulsen, Larsen and Bertram2013). More recently, Antunes-Fernandes et al. (Reference Antunes-Fernandes, van Gastelen, Dijkstra, Hettinga and Vervoort2016) investigated the relation between both milk V and NV and CH4 emission of dairy cows. They showed that milk NV have a more pronounced relationship with CH4 emission compared with milk V. Based on the relations found between NV and CH4 emission, Antunes-Fernandes et al. (Reference Antunes-Fernandes, van Gastelen, Dijkstra, Hettinga and Vervoort2016) concluded that CH4 intensity (g/kg fat- and protein-corrected milk; FPCM) may be related to lactose synthesis and energy metabolism in the mammary gland, as reflected by the milk NV uridine diphosphate (UDP)-hexose B and citrate. Methane yield (g/kg dry matter intake; DMI) on the other hand, may be related to glucogenic nutrient supply, as reflected by the milk NV acetone. Acetone is a ketone body, related to blood glucose levels, which in turn relate to the supply of glucogenic nutrients, and glucogenic diets are generally associated with reduced CH4 emissions (Antunes-Fernandes et al., Reference Antunes-Fernandes, van Gastelen, Dijkstra, Hettinga and Vervoort2016).
To the best of our knowledge, prediction models for CH4 emission of dairy cows combining MFA and other milk metabolites have not been developed. Therefore, the objectives of this study were (i) to develop prediction models for CH4 emission based on MFA, V or NV alone; (ii) to develop prediction models for CH4 emission combining MFA with V and NV; (iii) to evaluate the improvement in prediction potential upon inclusion of V and NV in the prediction models, compared with the prediction models based on MFA alone.
Material and methods
Experimental design and analyses
Data from a randomised block design experiment with 32 multiparous Holstein Friesian cows and four diets were used. The experiment has been described by Van Gastelen et al. (Reference Van Gastelen, Antunes-Fernandes, Hettinga, Klop, Alferink, Hendriks and Dijkstra2015) and was conducted in accordance with Dutch law and approved by the Animal Care and Use Committee of Wageningen University & Research (Wageningen, The Netherlands). Briefly, diets had a roughage:concentrate ratio of 80 : 20 based on dry matter (DM). Roughage consisted of either 1000 g/kg DM grass silage (GS), 1000 g/kg DM maize silage (MS) or mixtures of both silages (667 g/kg DM GS and 333 g/kg DM MS; 333 g/kg DM GS and 333 g/kg DM MS). Methane emission was measured in climate respiration chambers for a 5-day period and expressed as production (g/day), yield (g/kg DMI) and intensity (g/kg FPCM). Milk yield was recorded and milk samples collected according to Antunes-Fernandes et al. (Reference Antunes-Fernandes, van Gastelen, Dijkstra, Hettinga and Vervoort2016). These milk samples were subsequently analysed for MFA composition (g/100 g FA) using gas chromatography according to Van Gastelen et al. (Reference Van Gastelen, Antunes-Fernandes, Hettinga, Klop, Alferink, Hendriks and Dijkstra2015), for V (peak area in arbitrary units) using gas chromatography–mass spectrometry according to Antunes-Fernandes et al. (Reference Antunes-Fernandes, van Gastelen, Dijkstra, Hettinga and Vervoort2016), and for NV (relative area in arbitrary units) using nuclear magnetic resonance according to Antunes-Fernandes et al. (Reference Antunes-Fernandes, van Gastelen, Dijkstra, Hettinga and Vervoort2016).
Statistical analysis
As described by Antunes-Fernandes et al. (Reference Antunes-Fernandes, van Gastelen, Dijkstra, Hettinga and Vervoort2016), one cow was excluded because of large feed residuals, the gas chromatography–mass spectrometry results of another cow were considered outliers and could not be used, and the nuclear magnetic resonance results of a third cow could not be used because of repeatedly high background interference. Therefore, a total of 29 observations were used to determine the relation between CH4 emission and milk metabolites.
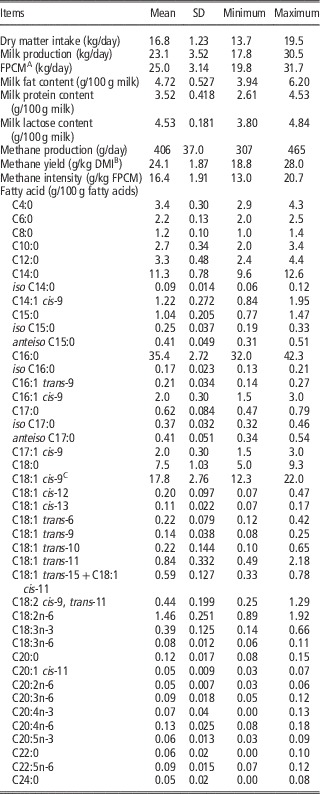
Data on DMI, CH4 emission, milk production, milk composition and MFA are described in Table 1. The PROC REG procedure (SAS Institute Inc., Cary, NC, USA, version 9.2) was used to determine the relationship between individual MFA and CH4 production, CH4 yield and CH4 intensity. The summary statistics of the V and NV and the relation between the individual V and NV and CH4 emission are presented by Antunes-Fernandes et al. (Reference Antunes-Fernandes, van Gastelen, Dijkstra, Hettinga and Vervoort2016).
Summary statistics of experimental data used for modelling (n=29)

Data from Van Gastelen et al. (Reference Van Gastelen, Antunes-Fernandes, Hettinga, Klop, Alferink, Hendriks and Dijkstra2015).
A Fat- and protein-corrected milk (kg/day)=[0.337+0.116×fat (g/100 g milk)+0.06×protein (g/100 g milk)]×milk yield (kg/day) (Centraal Veevoederbureau (CVB), Reference Chilliard, Martin, Roual and Doreau2012).
B Dry matter intake (kg/day).
C C18:1 cis-9 represents the sum of C18:1 cis-9 and C18:1 trans-12, as these two fatty acids could not be separated in the analysis. The portion of C18:1 trans-12 is considered to be negligible, as this fatty acid is always present in small amounts.
The PROC GLMSELECT procedure (SAS Institute Inc., Cary, NC, USA, version 9.2) was used to develop prediction models, with CH4 emission (i.e. production, yield and intensity) as dependent variable, the milk metabolites (i.e. MFA, V and NV) as independent variables, and stepwise selection as selection procedure. Milk fat and protein content, and milk production were also included as selection variables when developing overall prediction models (i.e. all types of milk metabolites combined) for CH4 production and CH4 yield, but not for CH4 intensity because these parameters are part of the FPCM calculation. The significance level for a variable to enter or stay in the model was 0.05 and 0.10, respectively. The best models were selected based on the minimum Akaike’s information criterion statistic. Selected models were evaluated with PROC REG procedure in terms of multicollinearity (variation inflation factor >10), but no multicollinearity was observed in any of the prediction models (i.e. for all prediction models, the variation inflation factors of the variables was <10).
The developed prediction models were evaluated with the coefficient of determination (adjusted R 2) and the concordance correlation coefficient analysis (CCC; Lin, Reference Lin1989). A detailed calculation of CCC is described by Dijkstra et al. (Reference Dijkstra, van Zijderveld, Apajalahti, Bannink, Gerrits, Newbold, Perdok and Berends2016). Briefly, CCC is calculated by multiplying r (i.e. a measure of precision) with C b (i.e. a measure of accuracy). The calculation of the C b variable involves υ (i.e. a measure of scale shift, which indicates the change in standard deviation, if any, between predicted and observed values) and μ (i.e. a measure of location shift).
Results
Relation between individual MFA and CH4 emission
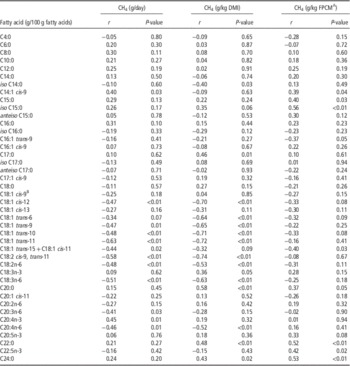
The relationships between individual MFA and CH4 production, CH4 yield and CH4 intensity are shown in Table 2 and Supplementary Tables S1 to S3. Short- and medium-chain MFA (defined here as straight, even chain MFA up to 16 carbon chain length; SMCFA) were not related to CH4 emission, except for C14:1 cis-9 which was positively related to CH4 production (P=0.03) and to CH4 intensity (P=0.04). Of the odd- and branched-chain FA, anteiso FA were not related to CH4 emission. No relation was found between the iso FA and CH4 production, but iso C15:0 tended to be positively related (P=0.06) whereas iso C14:0 was negatively related (P=0.03) to CH4 yield, and iso C15:0 was positively related (P<0.01) to CH4 intensity. In addition, C15:0 and C17:0 were not related to CH4 production, but C17:0 was positively related (P=0.01) to CH4 yield, and C15:0 was positively related (P=0.03) to CH4 intensity. Negative relations were found between CH4 emission and several C18:1, C18:2, and C18:3 isomers in milk, with the exception of C18:3n-3 which was positively related (P=0.05) to CH4 yield. The long-chain saturated FA (SFA) C20:0, C22:0 and C24:0 were not related to CH4 production, but positively related to CH4 yield and CH4 intensity (P<0.05).
Correlations between methane production (g/day), yield (g/kg dry matter intake (DMI)), and intensity (g/kg fat- and protein-corrected milk (FPCM)), and milk fatty acid concentrations

A FPCM (kg/day)=[0.337+0.116×fat (g/100 g milk)+0.06×protein (g/100 g milk)]×milk yield (kg/day) (CVB, Reference Chilliard, Martin, Roual and Doreau2012).
B C18:1 cis-9 represents the sum of C18 : 1 cis-9 and C18:1 trans-12, as these two fatty acid could not be separated in the analysis. The portion of C18:1 trans-12 is considered to be negligible, as this fatty acid is always present in small amounts.
Regression analyses for CH4 emission
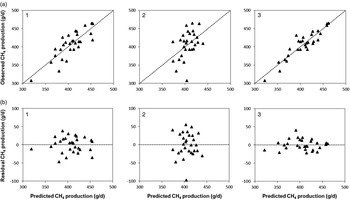
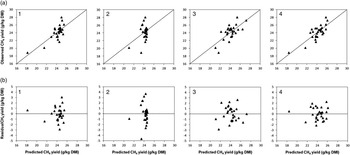
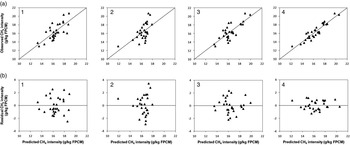
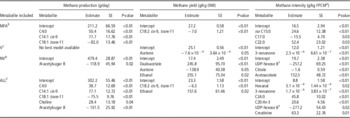
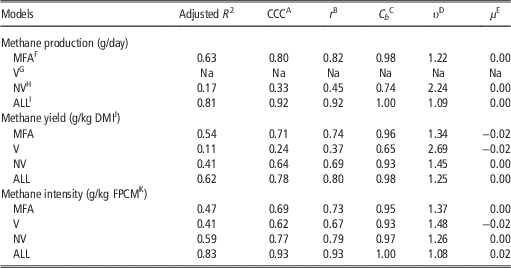
Four sets of test variables were used to develop CH4 prediction models; (1) only MFA, (2) only V, (3) only NV and (4) all three types of metabolites combined. In total, 11 prediction models were obtained; three for CH4 production (no model was obtained with V only), and four for both CH4 yield and CH4 intensity (Table 3). The observed and residuals (observed minus predicted) v. predicted CH4 production, CH4 yield and CH4 intensity plots are shown in Figures 1 to 3, respectively. The results of the CCC analysis of the 11 obtained CH4 prediction models are shown in Table 4.
(a) Observed and predicted methane production (g/day), and (b) residual (i.e. observed − predicted) methane production (g/day) from the regression analyses based on milk fatty acids (g/100 g fatty acids) alone (1), non-volatile metabolites alone (2) and all metabolites combined (3). The slope of residuals regressed on predicted values did not differ significantly from 0.

(a) Observed and predicted methane yield (g/kg dry matter intake (DMI)), and (b) residual (i.e. observed − predicted) methane yield (g/kg DMI), from the regression analyses based on milk fatty acids (g/100 g fatty acids) alone (1), volatile metabolites alone (2), non-volatile metabolites alone (3) and all metabolites combined (4). The slope of residuals regressed on predicted values did not differ significantly from 0.

(a) Observed and predicted methane intensity (g/kg fat- and protein-corrected milk (FPCM)), and (b) residual (i.e. observed − predicted) methane intensity (g/kg FPCM), from the regression analyses based on milk fatty acids (g/100 g fatty acids) alone (1), volatile metabolites alone (2), non-volatile metabolites alone (3) and all metabolites combined (4). The slope of residuals regressed on predicted values did not differ significantly from 0.

The prediction models developed for methane production (g/day), yield (g/kg dry matter intake (DMI)), and intensity (g/kg fat- and protein-corrected milk (FPCM)) based on milk fatty acids (MFA), volatile (V) or non-volatile (NV) metabolites or all metabolites (ALL) combined

A FPCM (kg/day)=[0.337+0.116×fat (g/100 g milk)+0.06×protein (g/100 g milk)]×milk yield (kg/day) (CVB, Reference Chilliard, Martin, Roual and Doreau2012).
B Only MFA as selection variables; in g/100 g fatty acids.
C Only V metabolites as selection variables; peak area value (arbitrary unit of quantity).
D Only NV metabolites as selection variable; peak area relative to calibration standard 3-trimethylsilyl-2,2,3,3-tetradeuteropropionate.
E ALL metabolites combined as selection variables.FUridine diphosphate (UDP)-hexose B.
The coefficient of determination (R 2) and concordance correlation coefficient (CCC) of the prediction models

A CCC=r×C b .
B Pearson correlation coefficient; a measure of precision.
C Bias correction factor; a measure of accuracy.
D Scale shift; change in standard deviation between predicted and observed methane emission.
E Location shift; if positive under prediction, if negative over prediction.
F Only milk fatty acids as selection variables; in g/100 g fatty acids.
G Only volatile metabolites as selection variables; peak area value (arbitrary unit of quantity).
H Only non-volatile metabolites as selection variable; peak area relative to calibration standard 3-trimethylsilyl-2,2,3,3-tetradeuteropropionate.
I All metabolites combined as selection variables.
J Dry matter intake (kg/day).
K Fat- and protein-corrected milk (kg/day)=[0.337+0.116×fat (g/100 g milk)+0.06×protein (g/100 g milk)]×milk yield (kg/day) (CVB, Reference Chilliard, Martin, Roual and Doreau2012).
The adjusted R 2 and the CCC varied between 0.47 and 0.63, and between 0.69 and 0.80, respectively, for the prediction models obtained using only MFA, with the prediction model for CH4 production performing the best. No model was obtained for CH4 production with V only. The significance level for a variable to enter the model was 0.05, whereas the significance level of the strongest correlation between a volatile metabolite (i.e. acetone) and CH4 production was 0.08 (results not shown). The prediction models for CH4 yield and intensity with only V performed worse than MFA alone, with an adjusted R 2 and CCC ranging from 0.11 to 0.41, and from 0.24 to 0.62, respectively, and the prediction model for CH4 intensity performed the best. The adjusted R 2 and the CCC varied between 0.17 and 0.59, and between 0.33 and 0.77, respectively, for the prediction models obtained with NV only, with the prediction model for CH4 intensity performing the best. The prediction models for CH4 yield and for CH4 production with only NV performed worse than the prediction models with only MFA, whereas the opposite was observed for CH4 intensity. Relative to the prediction models with only V, the prediction models with only NV performed considerably better for CH4 production, yield and intensity. The adjusted R 2 and the CCC varied between 0.62 and 0.83, and between 0.78 and 0.93, respectively, for the prediction models obtained combining the three types of metabolites, with the prediction model for CH4 intensity performing the best. Milk production, milk fat and milk protein content were not selected in the prediction models for CH4 production and yield. The three prediction models using the combination of all milk metabolites performed better than the prediction models using the three types of metabolites separately, in particular for CH4 intensity. Milk FA and NV were selected in all three models, whereas milk V were selected only in the CH4 intensity prediction model.
Discussion
Relation between individual MFA and CH4 emission
The lack of relation between SMCFA and CH4 emission differs from most other studies (e.g. Chilliard et al. (2009) for CH4 production; Dijkstra et al. (Reference Dijkstra, van Gastelen, Antunes-Fernandes, Warner, Hatew, Klop, Podesta, Van Lingen, Hettinga and Bannink2011) for CH4 yield; Van Lingen et al. (Reference Van Lingen, Crompton, Hendriks, Reynolds and Dijkstra2014) for CH4 intensity). The absence of a relation between SMCFA and CH4 emission in this study is in line with the absence of a positive relation between CH4 emission and both ruminal acetate and butyrate. Van Gastelen et al. (Reference Van Gastelen, Antunes-Fernandes, Hettinga, Klop, Alferink, Hendriks and Dijkstra2015) observed a decrease in CH4 emission upon replacement of GS with MS, whereas the molar proportion of acetate was unaffected and the molar proportions of butyrate increased; both are substrates for de novo synthesised SMCFA (Bauman and Griinari, Reference Bauman and Griinari2003).
The negative relation of iso C14:0 with CH4 yield was unexpected, because iso FA are generally more abundant in fibrolytic bacteria (Vlaeminck et al., Reference Vlaeminck, Fievez, Cabrita, Fonseca and Dewhurst2006) and thus hypothesised to be positively associated with CH4 emission (Castro-Montoya et al., Reference Castro-Montoya, Bhagwat, Peiren, De Campeneere, De Baets and Fievez2011). The positive relation between iso C15:0 and CH4 yield and intensity is in agreement with this hypothesis and with findings of Castro-Montoya et al. (Reference Castro-Montoya, Bhagwat, Peiren, De Campeneere, De Baets and Fievez2011) and Dijkstra et al. (Reference Dijkstra, van Gastelen, Antunes-Fernandes, Warner, Hatew, Klop, Podesta, Van Lingen, Hettinga and Bannink2011). Both C15:0 and C17:0 are hypothesised to be negatively related to CH4 emission (Vlaeminck and Fievez, Reference Vlaeminck and Fievez2005), which was also found by Castro-Montoya et al. (Reference Castro-Montoya, Bhagwat, Peiren, De Campeneere, De Baets and Fievez2011) and Rico et al. (Reference Rico, Chouinard, Hassanat, Benchaar and Gervais2016). In the present study, however, a positive association was found. Similarly, Chilliard et al. (2009) reported a positive relation between these linear odd-chain FA and CH4 production, Van Lingen et al. (Reference Van Lingen, Crompton, Hendriks, Reynolds and Dijkstra2014) found a positive relation between C15:0 and CH4 intensity, and Dijkstra et al. (Reference Dijkstra, van Gastelen, Antunes-Fernandes, Warner, Hatew, Klop, Podesta, Van Lingen, Hettinga and Bannink2011) found a tendency for a positive relation between C17:0 and CH4 yield.
The generally negative relations between C18:1, C18:2 and C18:3 isomers in milk and CH4 emission, is in agreement with the findings of Chilliard et al. (2009), Dijkstra et al. (Reference Dijkstra, van Gastelen, Antunes-Fernandes, Warner, Hatew, Klop, Podesta, Van Lingen, Hettinga and Bannink2011), Van Lingen et al. (Reference Van Lingen, Crompton, Hendriks, Reynolds and Dijkstra2014) and Rico et al. (Reference Rico, Chouinard, Hassanat, Benchaar and Gervais2016). Possible explanations for these relations, such as dietary unsaturated FA, and their biohydrogenation products, have been described by Van Gastelen and Dijkstra (Reference Van Gastelen and Dijkstra2016). The positive relation between the long-chain SFA and CH4 emission (both yield and intensity) has not been reported in any other study investigating the relation between MFA and CH4 emission (Van Gastelen and Dijkstra, Reference Van Gastelen and Dijkstra2016). The individual relationships found in the present study, in combination with the inclusion of a long-chain SFA in the prediction model for CH4 intensity, suggest that these MFA are important in terms of CH4 prediction.
Overall, the relation between individual MFA and CH4 emission depends on the unit in which CH4 emission is expressed (i.e. production, yield or intensity). For example, similar to Van Lingen et al. (Reference Van Lingen, Crompton, Hendriks, Reynolds and Dijkstra2014), a reduced correlation strength for C18:1 trans-10 and C18:1 trans-11 with CH4 intensity compared with CH4 production and yield was observed. These MFA are associated with milk fat depression, causing a decline in FPCM yield and, therefore, a reduction in correlation strength (Van Lingen et al., Reference Van Lingen, Crompton, Hendriks, Reynolds and Dijkstra2014). In general, the differences found for the various CH4 emission units were expected when considering the discrepancies between other studies. For example, several studies (Chilliard et al., 2009; Dijkstra et al., Reference Dijkstra, van Gastelen, Antunes-Fernandes, Warner, Hatew, Klop, Podesta, Van Lingen, Hettinga and Bannink2011; Mohammed et al., Reference Mohammed, McGinn and Beauchemin2011) found a positive relation between C8:0 and both CH4 production and yield, whereas Van Lingen et al. (Reference Van Lingen, Crompton, Hendriks, Reynolds and Dijkstra2014), Williams et al. (Reference Williams, Moate, Deighton, Hannah and Wales2014), Rico et al. (Reference Rico, Chouinard, Hassanat, Benchaar and Gervais2016) and Dijkstra et al. (Reference Dijkstra, van Zijderveld, Apajalahti, Bannink, Gerrits, Newbold, Perdok and Berends2016) did not find a relation between C8:0 and both CH4 production and intensity. These discrepancies have been reviewed in more detail by Van Gastelen and Dijkstra (Reference Van Gastelen and Dijkstra2016).
Regression analyses for CH4 emission
The prediction model with only MFA for CH4 production performed better than the prediction models with only MFA for CH4 yield and CH4 intensity. This is evident by the higher adjusted R 2 and CCC values. The higher CCC value is mainly caused by the considerably improvement in precision (r) and only to a minor extent by the improvement in accuracy (C b ). In general, the prediction potential of the CH4 prediction models with MFA only appears to be moderate, and the adjusted R 2 reported in this study are lower compared with Chilliard et al. (2009), Dijkstra et al. (Reference Dijkstra, van Gastelen, Antunes-Fernandes, Warner, Hatew, Klop, Podesta, Van Lingen, Hettinga and Bannink2011), Mohammed et al. (Reference Mohammed, McGinn and Beauchemin2011) and Rico et al. (Reference Rico, Chouinard, Hassanat, Benchaar and Gervais2016), but of similar magnitude as Van Lingen et al. (Reference Van Lingen, Crompton, Hendriks, Reynolds and Dijkstra2014). This could be the result of the dietary treatments used in the present experiment, namely replacing GS with MS, and its moderate effect on CH4 emission and MFA composition. Van Gastelen et al. (Reference Van Gastelen, Antunes-Fernandes, Hettinga, Klop, Alferink, Hendriks and Dijkstra2015) reported a reduction of 7% in CH4 production upon completely replacing GS with MS (800 g/kg silage diets on DM basis), and Kliem et al. (Reference Kliem, Morgan, Humphries, Shingfield and Givens2008) reported minor changes in MFA composition upon replacing GS with MS (500 g/kg silage diets on DM basis). This decline is, for example, much smaller than the decline reported by Chilliard et al. (2009) who observed a reduction of 64% in CH4 production and large effects on the MFA composition for linseed oil supplementation compared with a control diet.
The prediction potential of V appears low and considerably less promising compared with MFA, especially for CH4 production (no prediction model could be derived) and CH4 yield (low adjusted R 2 and CCC values). In addition, the variation in predicted CH4 yield was considerably smaller than that in observed CH4 yield, and also smaller than that in predicted CH4 yield based on only MFA, as evidenced by the large-scale shift (υ=2.69). This indicates the inability of only V to predict the range of observed CH4 yield. The potential of V to predict CH4 intensity is greater than their potential to predict CH4 production and CH4 yield, which is evident by the higher adjusted R 2 and CCC values and lower scale shift, and of almost the same magnitude as the prediction potential of MFA only.
These results suggest that V have low potential to predict CH4 emission, except when CH4 emission is expressed as intensity. Antunes-Fernandes et al. (Reference Antunes-Fernandes, van Gastelen, Dijkstra, Hettinga and Vervoort2016) already reported weak correlations between individual V and CH4 emissions and demonstrated that 3-nonanone (i.e. the V in the prediction model for CH4 intensity) is no longer associated with CH4 intensity when including FPCM as a covariate. This suggests that V hold potential to predict CH4 intensity only, which can be explained by the relationship between the V in milk and FPCM yield. In other words, V in the milk which originate from odour-active molecules from the diet, have no clear relations with the ruminal CH4 emission metabolism, but rather are suggested to be related to milk synthesis.
The prediction potential of NV is also low and less promising than MFA alone for CH4 production (low adjusted R 2 and CCC values), and the scale shift is large (υ=2.24), indicating inability of only NV to predict the range of observed CH4 production. Although the prediction potential of NV for CH4 yield is lower than that of MFA alone, the differences in CCC and υ were rather small. The prediction model for CH4 intensity with only NV, however, performed better than the prediction model with only MFA, which is evident by the higher adjusted R 2 and CCC values, and the smaller scale shift. The higher CCC value is caused by the considerable improvement in precision (r) and to a lesser extent by the improvement in accuracy (C b ). These results suggest that NV have a good potential for predicting CH4 intensity, which can be explained to a significant extent by the relation between the NV in milk and FPCM yield (Antunes-Fernandes et al., Reference Antunes-Fernandes, van Gastelen, Dijkstra, Hettinga and Vervoort2016).
To the best of our knowledge, the present study is the first to combine MFA with other milk metabolites to predict CH4 emissions. The prediction potential improved when combining all three types of metabolites. This is evident by the increased adjusted R 2 and CCC values, including r and C b , and the smaller scale shift relative to the prediction models using only MFA, only V, and only NV. For all CH4 emission units, the prediction model combining the three types of metabolites performed the best. In addition, the scale shift (υ<1.25) was minor, indicating the ability of these models to describe most of the observed variation. The improved prediction potential when combining the three types of metabolites relative to only MFA for both CH4 production and CH4 yield, is relatively small (i.e. the increase in adjusted R 2 and CCC is <0.18 and 0.12, respectively) and caused only by NV as no V were included in both prediction models. For CH4 intensity, however, combining the three types of metabolites resulted in significant improvement of the prediction potential; the adjusted R 2 and CCC increase with 0.36 and 0.24, respectively, relative to the prediction model with MFA only. This improvement can be equally assigned to V and NV.
As illustrated, combining MFA with V (CH4 intensity only) and NV helps to improve the prediction potential. Unfortunately, the techniques used for identifying V and NV are not suitable for large-scale measurements. Analyses of these metabolites, however, contribute to our understanding of factors that influence the variation in CH4 emission, and thereby give a better understanding of the relation between milk composition and CH4 emission. Although the present study focussed largely on the statistical relationship between the milk metabolites and CH4 emissions of dairy cattle, the physiological interpretations of relationships between NV or V and CH4 emissions are described by Antunes-Fernandes et al. (Reference Antunes-Fernandes, van Gastelen, Dijkstra, Hettinga and Vervoort2016). It should be noted that the area of validity of the relations that have been established in this study, is limited to roughage-based diets varying in GS and MS content, and the robustness of the reported relationships have not yet been evaluated within this area of validity. As shown by Dijkstra et al. (Reference Dijkstra, van Zijderveld, Apajalahti, Bannink, Gerrits, Newbold, Perdok and Berends2016), quantitative relationships between MFA and CH4 yield in cattle fed grass- or GS-based diets differ from those determined for other types of diets. This might also be valid for the relation between CH4 emission and both V and NV. Therefore, the promising results of this study, need to be validated in further work.
Conclusions
This study demonstrated for the first time that the potential to predict CH4 production, CH4 yield and CH4 intensity in dairy cattle increased, both in terms of precision and accuracy, when combining MFA with V and, in particular, with NV in milk. The combination of the three metabolites also has the ability to describe more of the observed variation in CH4 emission relative to MFA alone. The improved prediction potential was relatively small for CH4 production and CH4 yield, suggesting that it may not be worthwhile to perform complex analyses to determine the V and NV in milk in order to estimate CH4 production or CH4 yield of dairy cows. For CH4 intensity, the prediction potential increased considerably when combining the three types of metabolites compared with MFA alone. Therefore, analysing milk for these types of metabolites may be worthwhile to estimate CH4 intensity of dairy cattle.
Supplementary material
To view supplementary material for this article, please visit https://doi.org/10.1017/S1751731117000295