Introduction
The etiology of pedophilia, that is, a persistent primary attraction to prepubescent children, remains elusive. Literature to date implicates several potential contributing factors, including childhood experiences (Cohen, McGeoch, Gans, et al., Reference Cohen, McGeoch, Gans, Nikiforov, Cullen and Galynker2002), personality (Cohen, McGeoch, Watras-Gans, et al., Reference Cohen, McGeoch, Watras-Gans, Acker, Poznansky and Cullen2002), addiction (Cohen, Grebchenko, Steinfeld, Frenda, & Galynker, Reference Cohen, Grebchenko, Steinfeld, Frenda and Galynker2008), hormone abnormalities (Blanchard et al., Reference Blanchard, Barbaree, Bogaert, Dickey, Klassen and Kuban2000; Bogaert, Bezeau, Kuban, & Blanchard, Reference Bogaert, Bezeau, Kuban and Blanchard1997), and genetics (Gaffney, Lurie, & Berlin, Reference Gaffney, Lurie and Berlin1984, p. 255); however, recent years have produced increasing evidence that fundamental brain anomalies may also play a role. While some of this evidence suggests generalized brain dysfunction (Hendricks, Fitzpatrick, Hartmann, & Quaife, Reference Hendricks, Fitzpatrick, Hartmann and Quaife1988), the frontal and temporal lobes have been continually implicated. Structural neuroimaging studies of child molesters (using a variety of control groups across studies) have reported temporal–parietal abnormalities (Hucker, Langevin, Wortzman, & Bain, Reference Hucker, Langevin, Wortzman and Bain1986; Lang, Reference Lang1993), decreased left and/or bilateral gray matter volume in several frontal and temporal structures (Schiffer et al., Reference Schiffer, Peschel, Paul, Gizewski, Forsting and Leygraf2007; Wright, Nobrega, Langevin, & Wortzman, Reference Wright, Nobrega, Langevin and Wortzman1990), reduced right amygdala (Schiltz et al., Reference Schiltz, Witzel, Northoff, Zierhut, Gubka and Fellmann2007), and reduced temporal and parietal white matter volumes (Cantor et al., Reference Cantor, Kabani, Christensen, Zipursky, Barbaree and Dickey2008). Similarly, reports from positron emission tomography studies indicate reduced cerebral blood flow in the anterior regions of the right cerebral hemisphere (Hendricks et al., Reference Hendricks, Fitzpatrick, Hartmann and Quaife1988) and the right temporal lobe (Mendez, Chow, Ringman, Twitchell, & Hinkin, Reference Mendez, Chow, Ringman, Twitchell and Hinkin2000), as well as bilateral hypometabolism in frontal and temporal cortices (Cohen, Nikiforov, et al., Reference Cohen, Nikiforov, Gans, Poznansky, McGeoch and Weaver2002). Abnormal electroencephalograph activity, altered dominant hemispheric functions, and disruption of frontal–interhemispheric relationships have also been reported (Flor-Henry, Lang, Koles, & Frenzel, Reference Flor-Henry, Lang, Koles and Frenzel1991).
Neuropsychological studies have provided similar evidence of brain abnormalities among pedophiles. Again, while some of these studies suggest somewhat generalized dysfunction, reflected in lower overall IQ (Cantor, Blanchard, Robichaud, & Christensen, Reference Cantor, Blanchard, Robichaud and Christensen2005), poorer academic functioning (Cantor et al., Reference Cantor, Kuban, Blak, Klassen, Dickey and Blanchard2006), and slower processing speed (Suchy, Whittaker, Strassberg, & Eastvold, Reference Suchy, Whittaker, Strassberg and Eastvold2009b), others suggest more focal cognitive problems. These latter studies identified weaknesses in frontal and temporal lobes functions, including verbal abilities (Langevin, Wortzman, Wright, & Handy, Reference Langevin, Wortzman, Wright and Handy1989), verbal and visual–spatial memory (Cantor et al., Reference Cantor, Blanchard, Christensen, Dickey, Klassen and Beckstead2004), verbal learning and verbal fluency (Joyal, Black, & Dassylva, Reference Joyal, Black and Dassylva2007), ability to recognize facial affect (Suchy, Whittaker, Strassberg, & Eastvold, Reference Suchy, Whittaker, Strassberg and Eastvold2009a), attention (Kafka & Hennen, Reference Kafka and Hennen2002), and executive functioning (Kelly, Richardson, Hunter, & Knapp, Reference Kelly, Richardson, Hunter and Knapp2002; Martin, Reference Martin1999; Stone & Thompson, Reference Stone and Thompson2001; Suchy et al., Reference Suchy, Whittaker, Strassberg and Eastvold2009b; Veneziano, Veneziano, LeGrand, & Richards, Reference Veneziano, Veneziano, LeGrand and Richards2004).
However, inconsistencies in findings exist, likely due to (a) heterogeneity of those who sexually offend against children, (b) inconsistent definitions of pedophilia across studies,Footnote 1 and (c) variability in control groups. Importantly, approximately 40–50% of those who offend against children are not pedophiles, that is, they are not preferentially attracted to children (Seto, Harris, Rice, & Barbaree, Reference Seto, Harris, Rice and Barbaree2004). It has been argued that inclusion of nonpedophilic child molesters (NPEDs) in studies may have obscured brain-based abnormalities that are specific to pedophiles (Blanchard, Cantor, & Robichaud, Reference Blanchard, Cantor and Robichaud2006). For these reasons, researchers advocate for distinguishing between pedophilic (PED) and nonpedophilic child molesters, with the latter group representing those who are primarily attracted to adults but sexually offend against children.Footnote 2 These two child molester subtypes are known to differ in clinical presentations (e.g., background, personality, sexual preferences, criminal history) and offending patterns (methods, motivations) (Lanning, Reference Lanning2001), all of which may be related to cognition in general, and executive and emotional functioning in particular (Suchy & Kosson, Reference Suchy and Kosson2005; Williams, Suchy, & Rau, Reference Williams, Suchy and Rau2009). Importantly, because pedophiles tend to have more victims and higher recidivism rates (Abel & Osborn, Reference Abel and Osborn1992), understanding how this group differs from nonpedophilic child molesters may have important implications for treatment and risk assessment.
Despite the growing awareness that not all child molesters are pedophiles, empirical research comparing pedophilic and nonpedophilic child molesters is only just beginning. Thus far, nonpedophilic child molesters have been shown to have poorer facial and prosodic affect recognition abilities (Suchy et al., Reference Suchy, Whittaker, Strassberg and Eastvold2009a) and poorer semantic knowledge relative to demographically matched community controls, whereas pedophiles exhibited slower processing speed (Suchy et al., Reference Suchy, Whittaker, Strassberg and Eastvold2009b). Additionally, both groups have been shown to have poorer executive abilities relative to controls (Suchy et al., Reference Suchy, Whittaker, Strassberg and Eastvold2009b). These findings (a) demonstrate that there may in fact be brain-based differences between the two molester groups, (b) are consistent with the reports of frontal–temporal brain abnormalities among molesters on the whole (as reviewed earlier), and (c) are consistent with previous reports of executive dysfunction among child molesters on the whole, as compared to normative data (Stone & Thompson, Reference Stone and Thompson2001), nonoffenders (Kelly et al., Reference Kelly, Richardson, Hunter and Knapp2002; Kruger & Schiffer, Reference Kruger and Schiffer2009; Martin, Reference Martin1999), nonsexual offenders (Veneziano et al., Reference Veneziano, Veneziano, LeGrand and Richards2004), and rapists of adult victims (Martin, Reference Martin1999).
However, several aspects of prior findings raise questions. First, evidence of frontal–temporal brain abnormalities has also been reported in sexual offenders with adult victims, and in general criminal populations (Anckarsater et al., Reference Anckarsater, Piechnik, Tullberg, Ziegelitz, Sorman and Bjellvi2007; Baker & Ireland, Reference Baker and Ireland2007; Gontkovsky & Morgan, Reference Gontkovsky and Morgan2005; Kiehl, Bates, Laurens, Hare, & Liddle, Reference Kiehl, Bates, Laurens, Hare and Liddle2006; Kiehl et al., Reference Kiehl, Smith, Mendrek, Forster, Hare and Liddle2004; Mercer, Selby, & McClung, Reference Mercer, Selby and McClung2005; Ross, Benning, & Adams, Reference Ross, Benning and Adams2007). Therefore, it is unclear whether such brain and/or neurocognitive abnormalities are unique to child molesters, or whether they simply reflect factors related to incarceration and general criminality. Second, reports of “executive dysfunction” are not very informative. Executive functions refer to a broad range of higher order cognitive processes that include planning, problem solving/abstract reasoning, working memory, response initiation, switching, response selection, inhibition, and attentional and behavioral control (Jurado & Rosselli, Reference Jurado and Rosselli2007; Suchy, Reference Suchy2009). However, in our past study, we examined a single executive composite score that lumped several these processes into one. Thus, it is unknown whether (a) child molesters differ from general criminal populations, and (b) the two child molester groups differ from each other with respect to profiles of executive strengths and weaknesses.
The purpose of the present study was to address the above limitations by further characterizing executive functions (EF) among phallometrically defined pedophilic and nonpedophilic child molesters relative to nonsexual criminal offenders. A nonsexual offender comparison group allows for examination of the effects of general criminality and incarceration. Given the wealth of literature documenting executive dysfunction among general criminal populations (Morgan & Lilienfeld, Reference Morgan and Lilienfeld2000), we did not expect to find overall group differences with respect to a composite of executive functions. We did, however, expect that the groups would differ with respect to the profiles of discrete executive processes. Specifically, based on previous studies (Suchy et al., Reference Suchy, Whittaker, Strassberg and Eastvold2009a, Reference Suchy, Whittaker, Strassberg and Eastvold2009b) we expected that nonpedophiles would be more impulsive than pedophiles. Additionally, we have previously suggested that pedophiles may have a “more deliberate style of responding marked by greater self-monitoring” (Suchy et al., Reference Suchy, Whittaker, Strassberg and Eastvold2009b, p. 255); based on this prior assertion, we now tentatively hypothesize that pedophiles may have a relative strength on planning skills, and a lower rate of errors, relative to nonpedophiles.
Method
Participants
All participants were males, ages 21 to 49, residing in residential programs as an interim between incarceration and community reintegration. Sex offenders were classified as either pedophilic (PED, n = 30) or nonpedophilic (NPED, n = 30). A group of nonsexual criminal offenders (NSO, n = 29) served as a comparison group (one NSO was removed due to missing data).
Classification into pedophilic versus nonpedophilic groups was accomplished using well-established procedures typically used in this line of research (Blanchard, Kuban, et al., Reference Blanchard, Kuban, Blak, Cantor, Klassen and Dickey2006; Cantor et al., Reference Cantor, Kabani, Christensen, Zipursky, Barbaree and Dickey2008; Suchy et al., Reference Suchy, Whittaker, Strassberg and Eastvold2009b). Specifically, offenders were classified as pedophilic if (a) they admitted to being primarily sexually attracted to children under the age of 14, or (b) their penile plethysmography results (PPG)Footnote 3 revealed greatest sexual arousal in response to scenarios involving prepubescent children as compared to adult targets. In contrast, those who (a) reported their primary target of arousal to be adults and (b) this was corroborated by PPG results were classified as nonpedophilic (NPED).Footnote 4
Exclusionary criteria for all participants included colorblindness, deafness, inability to use their dominant hand, fewer than 8 years of formal education, inability to read or write, mental retardation (estimated IQ <70), self-reported history of serious neurologic illness/injury (e.g., stroke, seizures, moderate/severe brain trauma), and self-reported history or evidence of severe mental illness (e.g., psychosis) or current use of any antipsychotics, benzodiazepines, or narcotic pain medications.
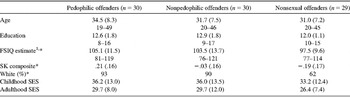
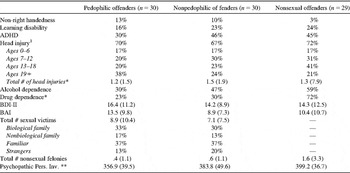
All groups were similar in age, education, and childhood and pre-incarceration estimates of socio-economic status (SES) (Table 1). NSOs had significantly lower estimated IQs (p < .05) and semantic knowledge (SK; p < .05), and were comprised of more non-white participants (p < .01) relative to PEDs. As indicated in Table 2, PEDs and NPEDs were similar in terms of number of sexual victims and relationship to index victim (no distinction was made based on sex of victim). NSOs reported a greater history of drug dependence (p < .01) and mild head injuries relative to PEDs and NPEDs (p < .05). Lastly, both NPEDs and NSOs scored significantly higher on a measure of psychopathy (p < .05, p < .001, respectively) than PEDs. Of the nonsexual offenders, 62% were incarcerated due to drug related crimes, 31% robbery/theft crimes, 17% assault, 10% fraud, and 10% other.
Sample demographics

Note. Table presents mean values, (standard deviations), and ranges. 1Full Scale Intelligence Quotient (FSIQ) estimate based on Shipley Institute of Living Scale Wechsler Adult Intelligence Scale Revised IQ estimate. *Nonsexual offenders (NSOs) had significantly lower estimated FSIQ and lower Semantic Knowledge (SK) relative to pedophilic offenders (PEDs; p < .05), and NSOs were comprised of more non-white participants relative to PEDs and nonpedophilic offenders (NPEDs; p < .01).
Other sample characteristics

Note. 1Percentage of individuals endorsing one or more head injuries at any point in their life. *Nonsexual offenders (NSOs) reported a greater number of lifetime head injuries relative to pedophilic (PEDs) and nonpedophilic (NPEDs) child molesters (p < .05), and a significantly greater number of NSOs met criteria for prior drug dependence to cocaine, inhalants or stimulants, relative to PEDs and NPEDs (p < .001). **NPEDs and NSOs scored significantly higher on the Psychopathic Personality Inventory (PPI) relative to PEDs (p < .05); NPEDs and NSOs did not differ from each other. PPI values represent raw scores.
Measures
Interview
A semi-structured interview was used to gather detailed information on demographics, SES (Hollingshead, Reference Hollingshead1975), index offense, victim characteristics (sex offenders only), legal and medical history. Given previous reports of increased head injury among child molesters (Blanchard et al., Reference Blanchard, Christensen, Strong, Cantor, Kuban and Klassen2002, Reference Blanchard, Kuban, Klassen, Dickey, Christensen and Cantor2003), a detailed inquiry regarding head trauma was completedFootnote 5 (ACRM, 1993; Ruff & Jurica, Reference Ruff and Jurica1999). The Screening Scale for Pedophilic Interests (SSPI) was completed to provide additional information regarding pedophilic interest (Seto & Lalumiere, Reference Seto and Lalumiere2001). The Substance Use module from the Structured Clinical Interview for DSM-IV-TR was administered to assess history of substance use (only past substance use patterns were assessed given that incarceration status typically precluded current substance use).
Questionnaires
Handedness was measured using the Chapman Handedness questionnaire (Chapman & Chapman, Reference Chapman and Chapman1987). Childhood attention deficit hyperactivity disorder (ADHD) was assessed using the 25-item Wender Utah Rating Scale (WURS), a self-report questionnaire that retrospectively evaluates criteria for childhood ADHD (Ward, Wender, & Reimherr, Reference Ward, Wender and Reimherr1993). All participants also completed the Psychopathic Personality Inventory (PPI; Lilienfeld & Andrews, Reference Lilienfeld and Andrews1996), a 187-item self-report questionnaire that measures personality traits characteristic of psychopathy.
Neuropsychological tests
Neuropsychological test variables were combined to create seven executive function subscales. The creation of subscales began with theoretical conceptualizations available in technical manuals (Delis, Kaplan, & Kramer, Reference Delis, Kaplan and Kramer2001a; Wechsler, Reference Wechsler1997a, Reference Wechsler1997b), which guided the initial tentative groupings that were then refined by empirically observed associations. All subscales were derived from subtests from the Delis Kaplan Executive Function Scale (Delis, Kaplan, & Kramer, Reference Delis, Kaplan and Kramer2001b), Wechsler Adult Intelligence Scale, Third Edition, (WAIS-III; Wechsler, Reference Wechsler1997a), Wechsler Memory Scale, Third Edition, (WMS-III; Wechsler, Reference Wechsler1997b) and Shipley Institute of Living Scales (SILS; Zachary, Paulson, & Gorsuch, Reference Zachary, Paulson and Gorsuch1985).
Executive functions (EF)
This domain is comprised of seven subscales that reflect common clinically conceptualized subcomponents of executive functions (Jurado & Rosselli, Reference Jurado and Rosselli2007): (1) Switching, (2) Inhibition, (3) Abstraction, (4) Working Memory, (5) Fluency, (6) Planning, and (7) Simple Attention. Scores for all seven subscales were averaged to create one overall Executive Function Domain composite, so as to allow comparison to prior research that has treated EF as a unitary construct. Each of the seven subscales were composites of two raw scores.
The Switching (SW) subscale provides a measure of cognitive flexibility and switching. This subscale includes the total raw scores from the Number-Letter Switching condition from the DKEFS Trail Making Test (connecting circles alternating between numbers and letters) and the Switch condition from the DKEFS Design Fluency test (making designs by connecting and alternating between empty and filled dots). Of note, the Design Fluency Switch condition has been shown to be more closely related to switching than to fluency (Suchy, Kraybill, & Larson, Reference Suchy, Kraybill and Larson2010).
The Inhibition (IN) subscale is comprised of the total raw scores from the Inhibition and Inhibition/Switch conditions of the DKEFS Color-Word Interference Test and provides a measure of inhibition and response selection. Of note, while the Inhibition/Switch condition involves some cognitive switching, it's more highly correlated with the Inhibition measure than the above switching measures (Delis et al., Reference Delis, Kaplan and Kramer2001a).
The Abstraction (AB) subscale provides a measure of abstract reasoning and problem solving and includes the SILS Abstract Reasoning subtest (a 20-item fill-in-the-blank reasoning task) and the total achievement score from the DKEFS 20 Questions test (a measure of problem solving and higher-order categorical thinking).
The Working Memory (WM) subscale is comprised of the total backward scores from the WMS-III Digit Span (which entails reciting increasingly longer series of numbers in reverse), and Spatial Span subtests (a nonverbal block touching analogue of Digit Span).
Fluency (FL) refers to initiation and efficient information retrieval. This subscale is comprised of the total raw scores from the DKEFS Verbal Fluency Letter condition (rapid naming of words beginning with a specified letter) and Condition One of DKEFS Design Fluency test (the nonverbal analogue of letter fluency entailing drawing unique designs by connecting dots according to specified rules).
The Planning (PL) subscale includes two measures from the DKEFS Tower Test, a task requiring participants to move discs across pegs to replicate towers according to specified rules. The Total Achievement raw score provides a measure of spatial planning and the Move Accuracy Ratio score captures the relationship between the total number of moves made across all items and the total number of minimum moves required to solve each item, providing a measure of planning and strategy effectiveness.
The Simple Attention (AT) subscale is a measure of one's ability to focus attention for brief periods. This subscale is comprised of two WMS-III measures, the total forward scores from the Digit Span (reciting increasingly longer series of numbers) and Spatial Span subtests (touching increasingly longer sequences of blocks).
Semantic knowledge (SK)
To better compare our past and current study samples, a composite of Semantic Knowledge was created. Similar to our prior studyFootnote 6 (Suchy et al., Reference Suchy, Whittaker, Strassberg and Eastvold2009b), this composite is comprised of the WAIS-III Information subtest (a measure of general knowledge and world facts) and the SILS Vocabulary subtest (40-item multiple-choice vocabulary test).
Procedures
Study procedures
Data collection was conducted in compliance with regulations set forth by the University of Utah Institutional Review Board and the Utah State Department of Corrections. Participants were recruited via flyers or brief presentations describing the study. Participants were first screened for basic eligibility criteria (e.g., age, offense type, victim age). Clinical interviews were then completed at their respective facility and entailed completion of IRB approved informed consent procedures, release of information to view PPG records (sex offenders only), a semi-structured interview, and administration of questionnaires. Lastly, participants completed a battery of neuropsychological tests, administered by trained research assistants who remained blind to group membership.
Preliminary statistical procedures
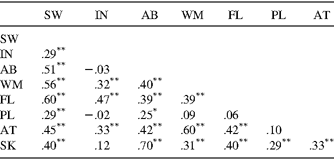
Composites were created from raw scores rather than scaled scores, due to combining variables from different normative samples with varying demographic corrections. Variables were transformed so that higher scores were indicative of better performance. Each subscale composite was comprised of two variables and was generated by conducting a principle component analysis on each set of two theoretically selected scores.Footnote 7 The Eigen values for all subscales ranged from 1.21 to 1.76. The variance accounted for by each factor score ranged from 73% to 88%, except for Simple Attention, which accounted for 60%. Zero-order correlations among composite scores are presented in Table 3.
Zero-order correlations among composite scores (N = 89)
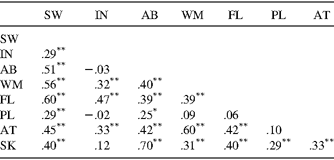
Note. SW = Switching; IN = Inhibition; AB = Abstraction; WM = Working Memory; FL = Fluency; PL = Planning; AT = Attention; SK = Semantic Knowledge; *p < .05, **p < .01.
Results
Executive Function Composites
Multivariate comparisons
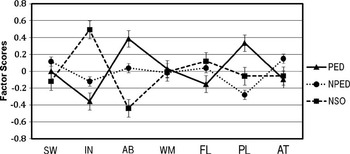
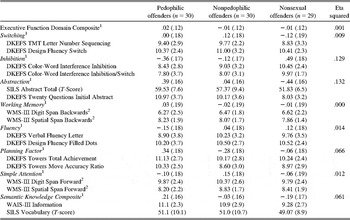
First, consistent with expectation, an analysis of covariance (ANCOVA) with Group (PED, NPED, NSO) as the independent variable, the EF Domain composite as the dependent variable, and age and education as covariatesFootnote 8 revealed no significant group differences [F(2,84) = .023, p = .977]. Next, the EF profiles were examined by performing a multivariate analysis of covariance (MANCOVA) with each of the seven EF subscales (SW, IN, AB, WM, FL, PL, and AT) as dependent variables, age and education as covariates, and Group as an independent variable. This analysis revealed significant group profile differences, [Wilk's Lambda (14,156) = .660; p = .003]. Additional MANCOVAs comparing group pairs revealed that the overall profile differences were driven by a difference between PEDs and NSOs [Wilk's Lambda (7,49) = .612; p = .001]. The child molester profiles did not differ from each other (p = .185), nor did NPEDs differ from NSOs (p = .071). However, the overall profile of the child molester groups combined differed from NSOs [Wilk's Lambda (7,79) = .780; p = .005]. Executive profiles of the three groups can be seen in Figure 1. Mean factor scores are presented in Table 4.
Executive function composite scores of pedophiles (PED), nonpedophiles (NPED), and nonsexual offenders (NSO) after controlling for age and education. The subscales include Switching (SW), Inhibition (IN), Abstraction (AB), Working Memory, (WM), Fluency (FL), Planning (PL) and Attention (AT). Higher scores reflect better performance.

Mean values for domain composites, subscales and individual variables

Note. 1Domain and subscale composites are presented as marginal means and standard errors of factor scores, corrected for age and education. All individual test scores presented are scaled scores, unless otherwise indicated, with standard deviations in parentheses. 2Digit and spatial span scores are raw scores, as scaled scores were not available for these individual scores.
Univariate comparisons
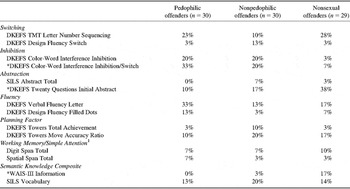
Individual univariate analyses indicated significant differences on the IN [F(2,84) = 6.214; p = .003] and AB [F(2,84) = 6.409; p = .003] subscales, and a trend on the PL subscale [F(2,84) = 2.950; p = .058]. Post hoc follow-up tests revealed that both PEDs and NPEDs performed significantly worse than NSOs on IN (p = .001 and p = .016, respectively) and significantly better than NSOs on AB (p = .001 and p = .044, respectively). Furthermore, PEDs performed significantly better than NPEDs on PL, (p = .019). To facilitate clinical interpretation, means and standard deviations of norm-based standard scores for individual tests that contributed to each subscale are presented in Table 4. Of note, all mean scores were within the low average to average range across all three groups. However, examination of Table 5, which shows percent of individuals with below average scores (defined as one standard deviation below the mean), reveals that PEDs tended to perform worse on tasks that highly emphasized speed of performance (e.g., Verbal Fluency, Color-Word Interference) and best on untimed tasks (e.g., Information, SILS Abstract Reasoning).
Percent of individuals with below average scores

Note. Below average is defined as one standard deviation below the mean. *Chi-square analyses indicated significant differences in the distribution of below average scores across the three groups (all p < .05). 1Scaled scores were only available for total Digit Span and Spatial Span tests.
Within-subjects comparisons
To determine whether the univariate differences on IN, AB, and PL could be interpreted as reflecting differing patterns of relative strengths and weaknesses for each group, we conducted a Repeated Measures ANCOVA, using IN, AB, and PL scores as dependent variables, Domain (IN vs. AB vs. PL) as a within-subjects factor, and Group as a between-subjects factor. Results showed a significant Group-by-Domain interaction for both linear and quadratic within-subjects contrasts [F(2,84) = 6.38; p = .003, and F(2,84) = 8.82; p < .001], suggesting that groups exhibited unique patterns of relative strengths and weaknesses.
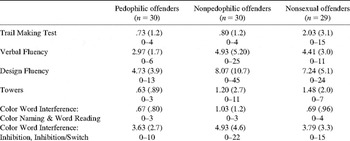
Error Data
Non-parametric analyses of raw error scores (see Table 6) revealed no statistically significant group differences in the numbers of errors on any variables. However, visual examination of the error data across all error variables revealed that in each case, PEDs committed the fewest mean number of errors, and for four of the six variables, NPEDs committed the highest mean number of errors out of all three groups. Similarly, examination of error ranges revealed that in most cases, PEDs exhibited the lowest maximum number of errors, whereas NPEDs exhibited the highest maximum number of errors. We subjected the overall pattern of error distribution to a Chi Square test and found that such a distribution of results across the three groups would be highly unlikely by chance alone, χ 2 = 13.22, df = 2, p = .001.
Total raw errors: Mean (standard deviation) and range

Note. Table presents mean, (standard deviations), and ranges of error data from Delis Kaplan Executive Function Scale (DKEFS) subtests.
Inhibition Speed versus Inhibition Accuracy
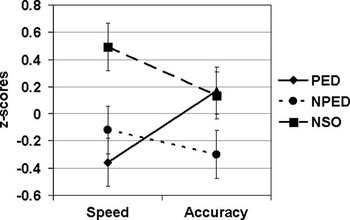
Based on the PEDs’ relative strength in PL and relative lack of errors, one may expect that PEDs would be the least disinhibited of the three groups. However, surprisingly, PEDs performed more poorly on the IN subscale than the other groups. One explanation for PEDs’ low scores on IN is that these scores were not a function of poor inhibition per se, but rather a sign of a planful, deliberate response style. To formally test this assertion, we pitted the IN subscale (which was based on speeded tests) against the IN error data (total errors from the two Color-Word Interference tasks that contributed to the IN subscale). After converting error data to Z-scores to allow a meaningful comparison, we conducted a Repeated Measures ANCOVA, using IN subscale and error scores as the dependent variables, Mode of assessment (speed vs. accuracy) as a within-subjects factor, and Group (PED, NPED, NSO) as a between-subjects factor. Results showed an interaction between Mode and Group [F(2,84) = 4.29; p = .017]. As seen in Figure 2, PEDs performed (a) most slowly out of the three groups, and (b) as accurately as NSOs (who also exhibited the fastest performance out of the three groups in this area), whereas NPEDs were both slow and inaccurate. These results suggest that PEDs’ poor performance on IN was not a reflection of an inability to inhibit, but rather a planful, deliberate approach that prioritized accuracy over speed.
The figure shows the relationship between performance speed and performance accuracy in the Inhibition domain, assessed via the speed and errors from the Inhibition and Inhibition/Switch conditions of the DKEFS Color–Word Interference Test. Higher scores reflect better performance. While non-sexual offenders (NSO) exhibited high speed and high accuracy, nonpedophilic child molesters (NPED) were both slow and inaccurate (suggesting a bona fide weakness on Inhibition in this group). In contrast, pedophilic child molesters (PED) were slow, but comparable to the NSO group in accuracy, suggesting a slow, deliberate response style that prioritizes accuracy over speed.

Other Potential Confounds
As seen in Tables 1 and 2, group differences emerged on estimated IQ, SK, ethnicity, and history of substance dependence and head injury. We conducted additional analyses to examine the contribution of these factors. Of note, covarying variables that are systematically related to an independent variable (i.e., Group) is generally considered statistically inappropriate (Miller & Chapman, Reference Miller and Chapman2001) as it may unduly remove the variance of interest; therefore these additional analyses are offered only tentatively.
Intelligence
PEDs had a higher IQ than NSOs (p = .014), and there was a trend for NPEDs to have a higher IQ than NSOs (p = .051). PEDs also had better SK than NSOs (p = .035). Repeating our principal analyses with these variables as covariates did not change the primary results; however, NPEDs now only showed a trend for better AB than NSOs (p = .065).
Personality
Consistent with prior findings (Suchy et al., Reference Suchy, Whittaker, Strassberg and Eastvold2009b), PEDs exhibited lower psychopathic traits than both NPEDs (p = .020) and NSOs (p < .001). Please note that psychopathy data were missing for 8 subjects (1 PED, 3 NPEDs, 4 NSOs). Adding psychopathy scores as a third covariate did not change any of the results.
Ethnicity
The majority of non-white participants in this study sample were NSOs: 30%, compared to 7% PEDs and 10% NPEDs (p = .003). Including ethnicity (white vs. non-white) as an additional between-subjects factor resulted in no group-by-ethnicity interactions, suggesting that it was appropriate to collapse across ethnicity groups. However, white participants had better AB than non-white participants (p = .008). For reasons explained above, this result is difficult to interpret (Miller & Chapman, Reference Miller and Chapman2001). The differences between PEDs and NSOs on IN (p = .036) and PEDs and NPEDs on PL continued to hold (p = .050).
Neurologic vulnerabilities
NSOs reported a greater history of drug dependence (p < .001), and head injury (p = .026) compared to PEDs and NPEDs (p values < .03). Adding the number of head injuries as a third covariate had no impact on the results. Drug dependence, when used as a second between-subjects factor (positive or negative history of drug dependence), accounted for the overall multivariate profile, although the profile differences between PEDs and NSOs still approached statistical significance (p = .059). With respect to univariate analyses, the same pattern of results prevailed, with the exception that NPEDs were no longer better than NSOs on AB (p = .112).
In summary, personality and history of head injury had no impact on results. Controlling for IQ and history of drug dependence decreased statistical group differences between NPEDs and NSOs on AB, and accounting for ethnicity removed all group differences on AB. Importantly, while ethnicity may contribute to group differences on AB, group differences on IN and PL were unchanged.
Discussion
The present study examined executive abilities among pedophilic (PED) and nonpedophilic (NPED) child molesters and criminal nonsexual offenders (NSOs). As expected, and consistent with prior findings (Suchy et al., Reference Suchy, Whittaker, Strassberg and Eastvold2009b), no group differences were found when EF was examined as a unitary construct. However, when the profiles of EFs were examined, group differences emerged, indicating that (a) child molesters exhibited an overall executive profile that was different from that of NSOs, with PEDs differing from NSOs, and NPEDs performing intermediate; (b) PEDs and NPEDs both performed better than NSOs on abstract reasoning and more poorly on inhibition, and (c) PEDs performed better than NPEDs on planning and exhibited better overall performance accuracy. These group differences on individual EF domains appeared to reflect unique patterns of strengths and weaknesses for each group, as evident by a significant interaction between group and score profiles.Footnote 9 Additionally, to the extent that similar measures were used in both the present and our prior study, scores of PEDs and NPEDs were remarkably similar across the two samples. For example, in both studies, Color–Word Interference performances of PEDs were approximately 2/3 of an SD below normative means and those of NPEDs were approximately 1/3 of a SD below normative mean, suggesting considerable generalizability of the results. Importantly, examination of Table 4 reveals that these differences reflect relative weaknesses, not impairments, as the mean scaled scores for all three groups range from low average to average, consistent with our previous study (Suchy et al., Reference Suchy, Whittaker, Strassberg and Eastvold2009b). In other words, such group differences (a) are not sufficient to explain why one chooses to sexually offend against a child and (b) cannot be used to classify offenders. By the same token, group means in the low average ranges suggest that some individuals’ performances were below average, falling into borderline or possibly even impaired ranges (see Table 5). Additionally, for some individuals, “weaknesses” may actually reflect genuine neurocognitive abnormalities, as many commercially available tests of EF may lack the sensitivity to adequately detect subtle problems.
Inhibition and Planning
With respect to inhibition, both PEDs and NPEDs exhibited poorer performance than NSOs, suggesting a mild relative weakness in this area. This pattern of results is consistent with previously published reports of impaired response inhibition among child molesters (Stone & Thompson, Reference Stone and Thompson2001; Tost et al., Reference Tost, Vollmert, Brassen, Schmitt, Dressing and Braus2004). However, because the typically employed inhibition measures rely heavily on response speed, it is important to examine timed performances in conjunction with error data. As can be seen in Table 6 and Figure 2, NPEDs were not only slow, but they also committed more errors than the other groups, suggesting a bona fide relative weakness in this area. In contrast, PEDs exhibited accurate, albeit slow, performance. Thus, it appears that the PEDs’ poor performance on the speeded portions of the inhibition tasks may reflect slow performance speed (consistent with our prior findings, Suchy et al., Reference Suchy, Whittaker, Strassberg and Eastvold2009a, Reference Suchy, Whittaker, Strassberg and Eastvold2009b), rather than a relative weakness in inhibition. Given that slower performance speed among PEDs in our prior study (Suchy et al., Reference Suchy, Whittaker, Strassberg and Eastvold2009b) was not associated with brain injury, learning disabilities, or other neurologic abnormalities, we hypothesized that it may have reflected “a more deliberate style of responding,” rather than neurologically based decreased speed of processing. In other words, it is possible that individuals who are sexually attracted to children cope with the illegal nature of their sexual preference by developing a cognitive style characterized by greater self-monitoring and ultimately slower, but more accurate responses. Examination of the percent of individuals with impaired scores (Table 5) further supports this notion, as PEDs tended to perform worse on tasks that emphasize speed of performance and best on tasks in which they were allowed to take their time. Clinicians working with this population need to keep in mind that a considerable proportion of PEDs may appear impaired if only speeded measures are used.
Although further empirical investigations of processing speed are needed to tease out this notion of cognitive style versus a neurologic issue, the notion that PEDs may engage in a more deliberate response style is also supported by their relative strength in the area of planning. One explanation for such a strength may be that PEDs spend a considerable amount of time engaging in planning activities as they groom their victims (i.e., as they gradually develop a relationship with the victim that will allow them to engage in abuse). This is very much in contrast to NPEDs, whose child molestation crimes generally occur more impulsively as a product of circumstance (Lanning, Reference Lanning2001). This pattern of offending is consistent with NPEDs’ impulsive and inaccurate presentation on testing (Suchy et al., Reference Suchy, Whittaker, Strassberg and Eastvold2009a, Reference Suchy, Whittaker, Strassberg and Eastvold2009b), as well as with their greater psychopathic personality traits.
Intellectual Functioning
The child molesters exhibited slight superiority over NSOs on abstract reasoning. This result may in part reflect the slightly higher estimated IQ among PEDs relative to NSOs (as the SILS Abstract reasoning score contributes to both composites). However, 38% of NSOs performed in the impaired range on the 20 Questions task, suggesting actual difficulties with problem solving and reasoning. Differential reasoning skills may be explained by ethnicity (and thus a sampling error), or they may also reflect inherent group characteristics, as it makes intuitive sense that it likely takes far greater reasoning and problem solving skills to sexually molest children, compared to committing impulsive theft/drug-related crimes.
Importantly, this study sample was remarkably similar to our previous sample (Suchy et al., Reference Suchy, Whittaker, Strassberg and Eastvold2009a, Reference Suchy, Whittaker, Strassberg and Eastvold2009b). In both samples, IQs and semantic knowledge (SK) were average, with PEDs’ IQ and SK being slightly (nonsignificantly) higher than those of NPEDs, in the context of approximately 13 years of education for both groups. The IQ and SK of child molesters in the present study were slightly higher than those of NSOs. This appears to contradict published reports documenting positive correlations between IQs and victim age (Blanchard et al., Reference Blanchard, Kolla, Cantor, Klassen, Dickey and Kuban2007; Cantor et al., Reference Cantor, Blanchard, Christensen, Dickey, Klassen and Beckstead2004; Cantor, Blanchard, et al., Reference Cantor, Blanchard, Robichaud and Christensen2005). However, such findings may be misleading and can likely be explained by the heterogeneity of study samples and inclusion of individuals with mental retardation. The only other reported comparison between pedophilic and nonpedophilic child molesters (Blanchard et al., Reference Blanchard, Kolla, Cantor, Klassen, Dickey and Kuban2007) found no IQ differences, consistent with our findings. Further examination of phallometrically defined non-mentally retarded pedophilic and nonpedophilic child molesters would likely continue to dispute relationships between pedophilia and lower IQs. This brings the neurodevelopmental hypothesis into question.
Neurodevelopmental Hypothesis
The neurodevelopmental hypothesis of pedophilia posits that some pre-, peri-, or post-natal event disrupts normal brain development, thereby causing or increasing the risk of pedophilia. Evidence for this comes from reports of lower IQs (Blanchard et al., Reference Blanchard, Kolla, Cantor, Klassen, Dickey and Kuban2007; Cantor et al., Reference Cantor, Blanchard, Christensen, Dickey, Klassen and Beckstead2004; Cantor, Blanchard, et al., Reference Cantor, Blanchard, Robichaud and Christensen2005), greater academic problems (Cantor et al., Reference Cantor, Kuban, Blak, Klassen, Dickey and Blanchard2006), greater incidence of non–right-handedness (Blanchard et al., Reference Blanchard, Kolla, Cantor, Klassen, Dickey and Kuban2007; Bogaert, Reference Bogaert2001; Cantor et al., Reference Cantor, Blanchard, Christensen, Dickey, Klassen and Beckstead2004, Reference Cantor, Klassen, Dickey, Christensen, Kuban and Blak2005), and greater incidence of childhood head injuries (Blanchard et al., Reference Blanchard, Christensen, Strong, Cantor, Kuban and Klassen2002, Reference Blanchard, Kuban, Klassen, Dickey, Christensen and Cantor2003) among PEDs, relative to a heterogeneous sample of nonpedophilic individuals with deviant sexual behaviors/impulses. In support of the neurodevelopmental hypothesis, our previous samples of PEDs exhibited higher rates of non–right-handedness and reported greater rates of learning disabilities and involvement in special education as compared to the other groups (Suchy et al., Reference Suchy, Whittaker, Strassberg and Eastvold2009b). However, that was not the case in the present sample. Additionally, in neither sample did PEDs demonstrate a greater incidence of head injury at any age interval. In fact, NSOs in this sample reported over twice as many lifetime head injuries compared to both PEDs and NPEDs, although reliance on self-report for such information limits interpretability.
Limitations
This study has limitations. First, because all offenders came from residential treatment programs, they were deemed appropriate for reintegration into the community. Consequently, child molesters from the more extreme end of the spectrum (e.g., higher number of victims, crimes of a more violent nature), or those who had not been apprehended for their crimes, were not included in the study. However, it could be argued that the “less severe” and “less successful” offenders examined in this study represent precisely the population of interest to clinical professionals, as they are more likely to be enrolled in treatment. In that context, the presently identified cognitive differences between subtypes of child molesters may be particularly relevant. For example, based on our results, NPEDs may benefit more from a behavioral treatment approach that addresses impulsivity, whereas PEDs may benefit more from treatment that focuses on understanding and controlling their deviant sexual attraction. Regardless, the present results may not generalize to those who committed more serious crimes, those who successfully elude the legal system, or those who have not acted on their deviant sexual urges.
Additionally, while the sample size used in the present study was appropriate for group comparisons, it was too small for conducting more sophisticated statistical procedures (e.g., Structural Equation Modeling) that would allow more systematic examination of potential moderating or mediating effects of additional contributing factors, such as SES, substance abuse, or ethnicity. By the same token, a replication of findings using two smaller samples is statistically more robust than a single finding from a larger sample (Cohen, Reference Cohen1994).
Although we consider it a strength that the present study (a) classified child molesters on the basis of phallometrically defined sexual attraction and (b) used a nonsexual offender comparison sample to examine contributions of incarceration and general criminality, other means of sub-classifying offenders (e.g., age of the victim) and other comparison groups (e.g., rapists of adults) may also be of interest in future research, as they may offer additional specificity to the present findings. For example, any aspects of performance in which child molesters as a group (i.e., PEDs and NPEDs combined) differed from NSOs can only be interpreted as being associated with sexual offending, rather than child molestation, as comparisons with other sex offender controls were not conducted.
Lastly, our groups were not perfectly matched, most likely due to inherent differences in certain group characteristics. In other words, if NSOs exhibit lower IQ despite being matched on education and SES, this suggests that matching on both education and IQ is likely not possible or, if attempted, might result in a non-representative sample. Importantly, although the NSOs differed from the child molester groups on some important dimensions (i.e., intelligence, ethnicity, history of drug dependence, number of self-reported head injuries, and psychopathy), controlling for these factors did not substantively change the results, suggesting that the observed group differences are reliable and theoretically meaningful.
Acknowledgments
The authors thank the Utah State Department of Corrections, Duane Bordeaux and the staff at the Center for Family Development, Bonneville Community Correction Center, Fremont Community Correction Center, and the Northern Utah Community Correction Center for their support and assistance throughout the duration of this study. No data in this manuscript have been previously published, either in print or electronically. There are no financial conflicts of interest affecting this manuscript. This study was funded via Yana Suchy's University of Utah faculty start up funds.