1. Introduction
The thickness distribution of sea ice within the Antarctic pack is fundamentally important to the interaction between Antarctic sea ice, the atmosphere and the ocean, and is determined by a combination of dynamic and thermodynamic processes. Observations have shown that during most seasons in the Antarctic a complicated and highly variable mixture of open water and different types and thicknesses of ice are present. Some recent studies indicate that the typical thickness of undeformed Antarctic floes is only 0.3 ‐0.5 m both in the Weddell Sea (Reference Wadhams, Lange and AckleyWadhams and others, 1987) and East Antarctica (Reference AllisonAllison, 1989a; Reference Allison, Brandt and WarrenAllison and others, 1993). Undeformed ice is defined as that which may have been rafted to form thicker uniform floes but has not been ridged; this definition has been adopted because in most cases ship‐based observations cannot distinguish floes which have been uniformly rafted. In spring, up to 25% of the pack around East Antarctica has been estimated to consist of thin sea ice less than 0.3 m thick, with a further 30% being open water (Reference Allison, Brandt and WarrenAllison and others, 1993). These thin‐ice and open‐water areas are important as regions of very high air‐sea heat exchange and rapid new ice formation (Reference MaykutMaykul, 1978; Reference Worby and AllisonWorby and Allison, 1991). In deformed areas, however, ice thickness can exceed 5 m and much of the total ice mass is contained within pressure ridges.
2. Observational data set
In this paper, ship‐based observations are used to estimate and describe seasonal and regional changes in ice characteristics and thickness distribution between 60° and 150° E. The data consist of approximately 1500 observations from 17 voyages between October 1986 and May 1993. Each hourly observation made from the ship is an estimate of the areal coverage, snow cover, topography and floe size of the three dominant ice‐thickness categories within a radius of 1 km from the vessel. The ice‐thickness categories are those defined by the WMO nomenclature (World Meteorological Organization, 1970) and the observations are similar to those described by Reference Allison, Brandt and WarrenAllison and others (1993), although the observational technique has been updated several times to include additional detail. Since 1992, for example, the observations include an estimate of the areal coverage and average sail height of pressure ridges which is used to estimate the average thickness of ridged floes. This contrasts with observations prior to 1992 which are predominantly of undeformed ice.
The accuracy of thickness observations made from the ship is within about 20% of total thickness, but the large sample of observations can be expected to provide a good statistical description of the pack characteristics. At least one of the authors was present on the majority of voyages and, at the start of each cruise, all observers would observe simultaneously to minimize differences due to individual judgment. Snow‐free thin‐ice categories, which are particularly important for heat exchange, can be reliably classified by a trained observer into the correct WMO category from their apparent albedo. For older, snow‐covered floes, ice thickness was visually estimated from broken pieces turned on their side by the passage of the ship (using as a reference scale a spherical buoy suspended over the vessel's side close to the water line), or for very thick floes, from the freeboard. On dedicated scientific cruises, regular in‐situ measurements of ice and snow thickness were also made by drilling: these measurements were used to check and "calibrate" the ship‐based observations. The ship‐based observations of ridge sail height are subject to considerably greater error than the ice thickness, particularly under overcast conditions.
Each voyage was in the pack ice for between 3d and 3 weeks, and was either a resupply voyage to one or more Antarctic bases or a dedicated scientific voyage. The dedicated voyages include sections following specified direct cruise tracks (regardless of ice conditions), generally running north‐south between the ice edge and the continent, whilst the resupply voyages are reliable for visiting roughly the same area at the same time each year. Typical cruise tracks are shown in Figure 1. The data set has been edited to exclude observations biased by slow progress in heavy ice and by open water when transiting near the ice edge. When aircraft were on board, flights were made as frequently as possible to observe sea‐ice conditions and check that ship‐based observations were not biased by easily navigable routes. The differences in mean ice‐thickness estimates between sections along specified tracks and resupply routes were no greater than the differences between individual specified tracks, suggesting that the observations on resupply voyages are not significantly biased towards lighter ice conditions.
Core sampling of ice floes has been undertaken on voyages since 1991. Stratigraphic analyses of sections from 53 cores have been used to determine the crystal structure and growth processes of sea‐ice floes, including any deformation that may have occurred, and the relative percentages of frazil and congelation ice. Salinity and stable‐isotope (δ18O) analyses (typically at 0.03m vertical intervals) have been used to determine the presence of snow ice.
3. Data analysis
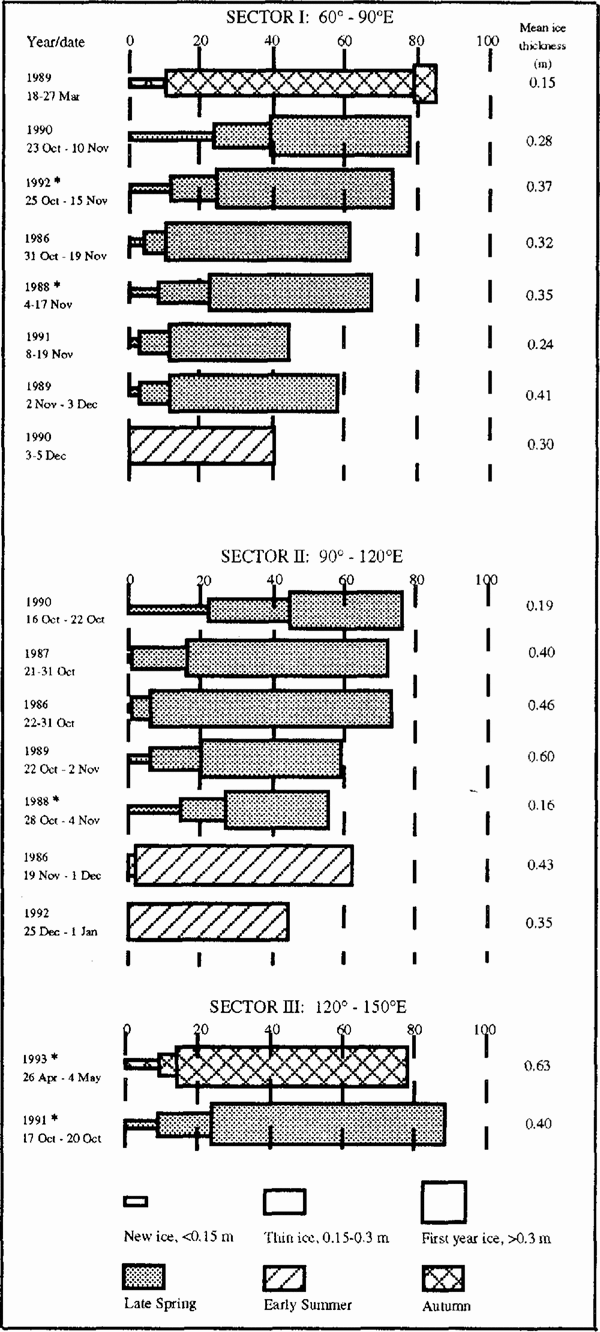
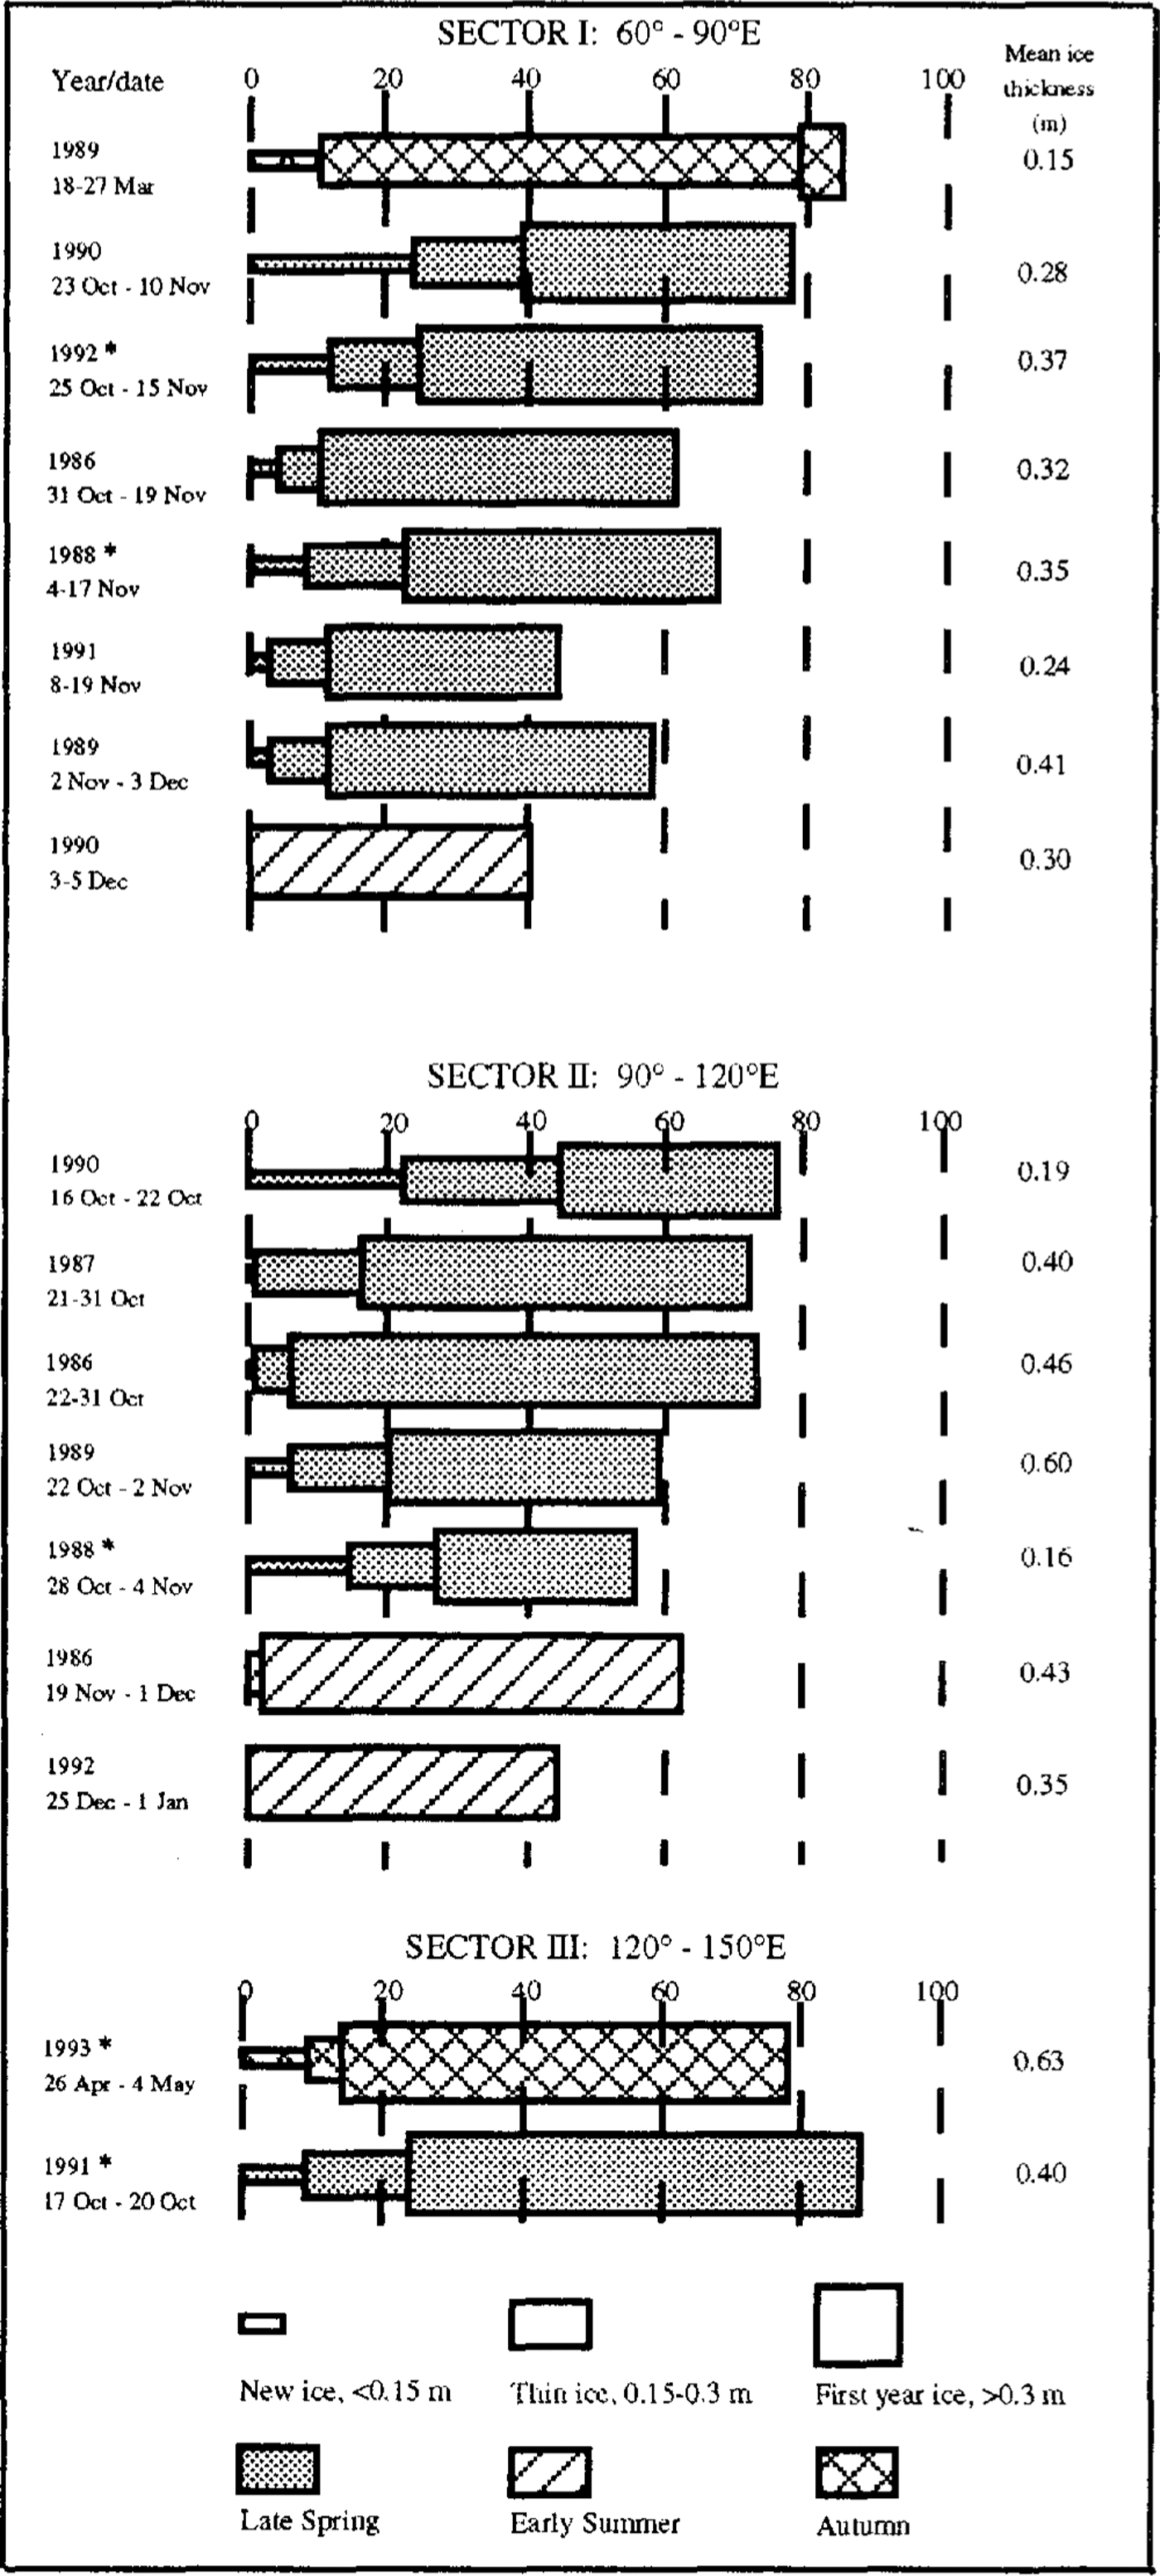
To examine regional and seasonal differences in ice conditions, we have divided the data into three sectors: sector I (60°−90° E), sector II (90° 120° E) and sector III (120°−150° E), and further subdivided these sectors into five zones between the ice edge (defined by the NOAA Joint Ice Centre weekly ice charts at 15% concentration) and the Antarctic continent. These zones are 0−50 km, 50−150 km, 150−350 km, 350−550 km and >550 km from the ice edge. We have also simplified the ship‐based observations into four undeformed ice‐thickness categories based on important phases in the ice‐growth cycle (Reference Worby and AllisonWorby and Allison, 1991). The four categories are open water, 0−0.15 m, 0.15−0.3 m and >0.3 m. The fractional coverage of these categories is shown in Figure 2 as well as the area‐averaged ice thickness, calculated over the total area of the pack (including open water), but excluding the effects of deformation. Dedicated scientific voyages are marked by an asterisk in Figure 2.
East Antarctica showing the regional divisions (sectors 1−111) used in this study and typical cruise tracks on which sea‐ice observations are available. The mean position oj the sea‐ice edge is shown Jar 1 October (U.S. Naval OceanograPhy Command, 1985).

4. Seasonal changes in undeformed ice thickness
4.1. Late spring
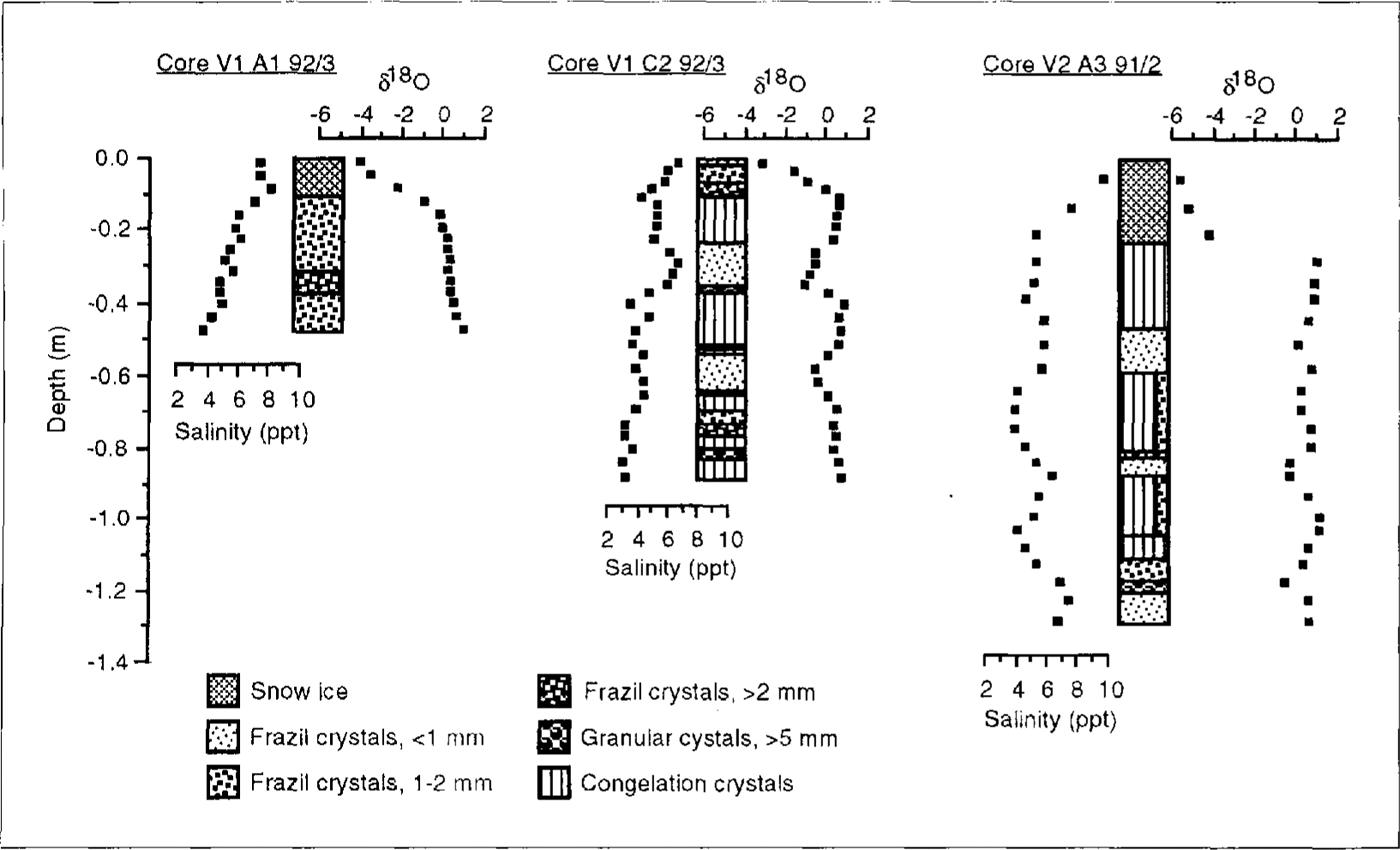
The majority of the data are from sectors I and II during late spring (October‐November) when there is a broad mix of the four thickness categories, reflecting the variation in ice thickness within the pack. At this time of year, open water and ice >0.3 m thick are dominant and account for 60−90% of the total pack. The thinner ice categories are present in lower and more variable concentrations (10−40%) and large areas of nilas or pancake ice are common in newly formed leads. Crystal‐texture analysis of cores has shown that approximately 50% of pack ice is composed of frazil crystals, indicative of rapid new‐ice formation in open water with subsequent thickness increases caused by deformation. Table 1 shows the percentage of different ice types for cores taken from sector I. Structural analysis shows that much of the ice >0.3 m thick has been rafted or ridged and the increases in ice thickness beyond 0.4−0.5 m are usually the result of these dynamic processes. This is exemplified by the typical core profiles shown in Figure 3. Rafted floes can usually be identified by repeated layers of frazil and congelation crystals or by multiple "c‐curves" in the salinity profile. The δ18 O profiles are used to discriminate ice which forms when snow becomes saturated with sea water and refreezes (Reference Lange, Schlosscr, Ackley, Wadhams and DieckmannLange and others, 1990). Visual identification of this ice type is difficult because of its similarity to coarse‐grained frazil crystals but its meteoric water component results in a more negative δ18O value than standard sea ice. In the samples analysed, approximately 12% of the ice cover was composed of this snow ice, which was usually found at the top of cores but also at depth in rafted floes.
During October‐November, 40−50% of the pack in sector I is composed of ice >0.3 m and this shows little inter‐annual variation except in 1991. The inter‐annual changes in total ice concentration during this period therefore reflect changes in the relative percentages of new ice and open water, and this is determined largely by air temperatures becoming warm enough to prevent new ice growth. This typically occurs around mid‐November but there are latitudinal and annual fluctuations. Inter‐annual changes in the mean undeformed spring ice thickness in sector I range between 0.24 and 0.41 m. These somewhat low values reflect the high percentage of open water within the pack at this time of year. The concentration of new ice, and hence the total ice concentration, decreases though October and November as air temperatures rise and leads fail to refreeze.
In sector II, there are fewer data and the thickness distribution shows greater annual variability with the area‐averaged undeformed ice thickness ranging between 0.16 and 0.60 m. In sector III, local influences on pack‐ice drift result in heavy conditions most of the year and the ice is significantly thicker than in sectors I and II. Grounded iceberg tongues near 150° and 136° E, and the remnants of the gigantic B9 iceberg from the Ross Ice Shelf, form barriers to the westward flow of sea ice, causing ice to build up on their windward sides. The subsequent ridging which occurs can result in floes in excess of 10m thick with a snow cover of 1−2m. Near the ice edge, vast pancake‐ice fields have been observed during late spring but heavy ice in the 50−150 km zone has prevented observations further south.
Average percentage of frazil crystals, congelation ice and snow ice for cores from late spring sea‐ice in sector I

Percentage concentration of three ice‐thickness and open‐water categories for each voyage. The relative concentrations of the different categories are shown separately for each regional sector and the voyages are classified by season. The area‐averaged undeformed ice thickness for each voyage is shown at the right. Dedicated scientific cruises are denoted by an asterisk.
4.1.1 Latitudinal variations in ice conditions in sectors I and II
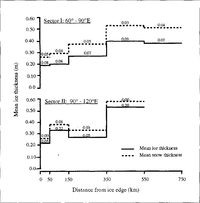
The area‐averaged undeformed ice thickness in October November for sectors I and II, and its variability, is shown as a function of distance from the ice edge in Figure 4. The change in mean undeformed ice and snow thickness with distance from the ice edge is remarkably constant from year to year in sector I but there are significant annual variations in sector II where the ice‐edge location is more variable.
In the two outer zones (0−150km), ice concentration is typically only 20−30% and the area‐averaged ice thickness is heavily weighted by the high percentage of open water. The ice‐covered region in both zones is usually composed of small floes 0.5−2.0 m thick with new ice forming only in the vicinity of thicker floes due to localized cooling.
Profiles of crystal structure. salinity and δ18O for three typical cores collected from late‐spring pack ice in sector 1.
In the 150−350 km and 350 550 km zones, there is an increase in ice concentration, mostly in the >0.3 m category. The concentration of new ice also increases and large areas of nilas are common in leads up to several kilometres across. This ice quickly thickens or is crushed into ridges by thicker converging floes. The mean undeformed thickness in sector II is more variable but comparable with sector I, and the trend toward thicker ice south of the ice edge is clear in both sectors.
In sector I, there is a decrease in the area‐averaged undeformed ice thickness in the >550 km zone where as much as 60% of the pack is composed of open water and ice <0.3 m thick. This is due to a recurrent flaw lead between the fast ice and the pack and the northward advection of new ice away from this area. There are insufficient data to comment on this zone in sector II.
The average snow‐cover thickness as a Function of distance from the ice edge is also shown in Figure 4. The inter‐annual variability in the snow cover in sector I is low and there is a small but uniform increase in average snow thickness from 0.07 m near the ice edge to 0.13 m in the 3.50−.550 km zone. In sector II, there is less snow cover with no significant increase south of the ice edge. The snow‐thickness values are averaged over the ice‐covered area only.
Changes in the undeformed area‐averaged ice thickness and snow thickness with distance from the ice edge for October‐.November. Snow thickness is shown as a cumulative addition to the ice thickness. Numbers on the graph represent one standard deviation of the means for different voyages; averages and deviations are based on data from six voyages in sector I (1986−92) and six voyages in sector II (1986 90).

4.2 Early summer
By December, new‐ice formation has ceased and the thin ice present during November has either melted or been deformed into thicker floes. Most of the ice in sectors I and II consists of floes about 0.7 m thick with an area averaged value between 0.3 and 0.4 m. Whilst this is comparable with the value for late spring, the ice edge is considerably further south and there has been a net loss of ice.
4.3 Autumn
Very little ice survives the summer melt in sector I and by late March the pack consists almost entirely of young ice. The majority of this is <0.3 m thick with a high concentration (80%) which is attributable to the rapid production of ice.
In sector III, a high proportion of the ice trapped near iceberg tongues along the coast survives the summer melt, drifting north whenever the build‐up of ice is too much to contain. Consequently, the ice‐edge zone in autumn contains a high percentage of ice 2.0−5.0 m thick, as well as occasional floes up to 10m thick. Crystallographic analysis of the top 3 m of one 10 m thick floe revealed 100% frazil crystals, suggesting that it formed by continuous deformation of thinner floes. The 2 m thick snow cover showed multiple melt layers, indicative of ice that has survived at least one summer season. During autumn 1993, heavy ice prevented the ship from penetrating beyond the 50−150 km zone but aerial reconnaissance showed vast areas of nilas 0.05−0.15 m thick covering hundreds of square kilometres further south. Because this area was not included in our hourly ship‐based observations, the area‐averaged thickness calculated for this sector is biased by the heavy ice in the 0−150 km zones.
5. Contribution of ridging to total sea‐ice mass
Buoy studies have shown that the pack ice off East Antarctica is highly dynamic. Drift rates of 15−20 km d-1 are typical (Reference AllisonAllison, 1989b) and much higher rates are not uncommon. Such dynamism often results in the deformation of ice soon after it has formed, e.g. finger‐rafting of nilas and stacking of small pancakes as well as rafting and ridging of thicker first‐year floes. Analysis of pack‐ice floes shows that deformation, rather than basal freezing, is the dominant mechanism for increasing ice thickness beyond 0.2−0.4 m. This results in an increase in local ice thickness, whilst at the same time leads open and, during the growth season, new ice is able to form. The net effect is increased ice production, resulting in an increase in the total mass of ice within the pack and changes in the ice‐thickness distribution. There is also an increase in brine rejection to the ocean during the growth season and fresh‐water flux during the melt.
The initial deformation of thin ice creates relatively uniform thicker ice that is included in our observations, but the effect of ridges is not included in any of the estimates of ice thickness given in the previous sections. The accurate assessment of the thickness of ice in heavily ridged floes is impossible from a ship because the bulk of the ice mass is below the water line. We have therefore attempted to relate the average ice thickness of a ridged floe to visible features: the areal extent of ridging on the surface, the average sail height and the undeformed thickness of the floe.
Using a simple model of a ridge with a triangular sail cross‐section of average height S, in ice of undeformed thickness zu, the average ice thickness above freeboard, zf, is given by:

where R is the fraction of surface area ridged. Assuming hydrostatic equilibrium and an ice density of 900 kg m−3, the total average thickness, zr, of the ridged floe is then simply:

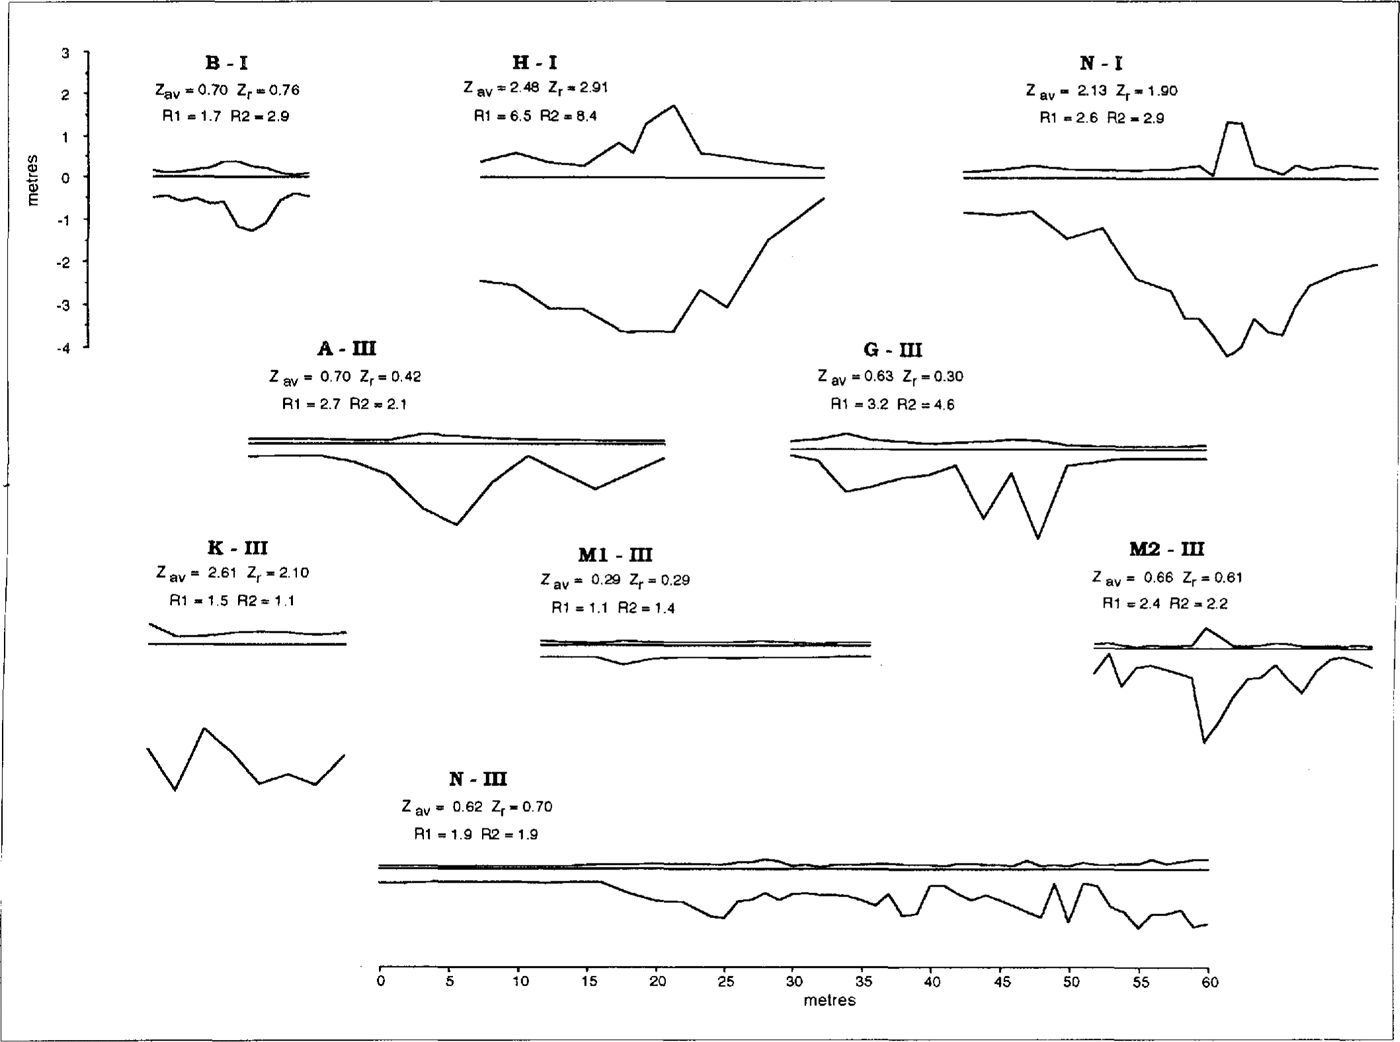
Nine ridge‐thickness profiles from floes in sectors I and III are shown in Figure 5. These profiles were obtained by drilling regularly spaced holes across the ridge and measuring the total ice and snow thickness and freeboard height at each hole. Also shown in Figure 5 for each profile is the average ice thickness from the profile measurements (zav), the average ridge thickness (zr)calculated from Equations (1) and (2), the ratio of zav to the thickness of undeformed ice in the floe (R1) and the ratio of the average thickness required for hydrostatic balance (assuming an ice density of 900 kg m−3 and snow density of 400 kg m 3) to the thickness of undeformed ice in the floe (R2). R1 is the ratio of total mass in the floes compared to that in the thinner undeformed ice and, with the exception of ridge H I, it has a range between 1 and 3. Ridge H I (R 1 = 6.5) is an example of a relatively thin floe ridging against a thicker floe, and hence the undeformed ice thickness used in the calculation is not representative of both floes. Although the measured profiles may represent only a small section of each floe, the good agreement between R1 and R2 shows that the average thickness calculated from the measured profile is close to the hydrostatic average in all cases. The average ice thickness calculated as zr is close to zav and, considering the simplicity of formulation, Equations (1) and (2) provide a reasonable thickness correction for ridging.
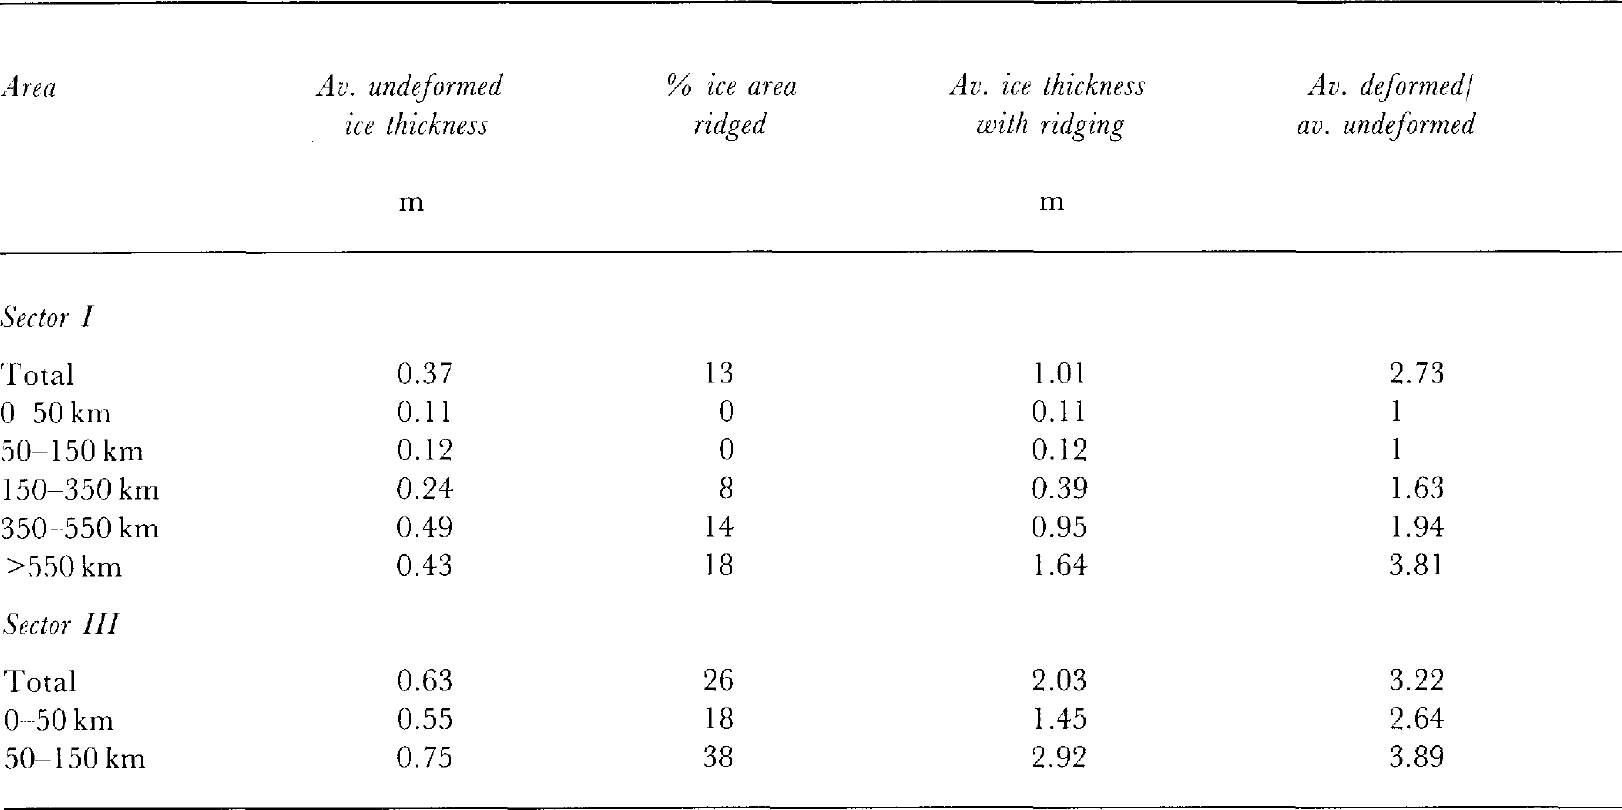
Equations (1) and (2) have therefore been used to derive an area‐averaged ice thickness which includes the effect of ridging from ship‐based estimates of the ridging fraction and sail height for each of the three dominant ice categories around the vessel. This is a more accurate indication of the total mass of ice and hence the total ice production within the Antarctic pack. Table 2 compares the area‐averaged ice‐thickness calculations for undeformed and ridged ice for voyages in sector I (October 1992) and sector III (May 1993). The ratio of deformed to undeformed ice thickness for the total pack is about 3, in general agreement with the ratios for the nine measured ridge profiles on the same voyages.
In sector I, ridging steadily increases from near zero in the zones closest to the ice edge to a maximum near the coast. This effectively increases the corrected average ice thickness by a factor from 1 to nearly 4 over the undeformed estimates shown in Figure 4. The ridging‐corrected estimate of an average pack‐ice thickness of 1.6 m near the coast (Table 2) compares with a typical maximum fast‐ice thickness at Mawson, where the ice growth is purely thermodynamic, of between 1.5 and 1.7 m (unpublished data of I. Allison). The total average, thickness, corrected for ridging, for all of sector I is about 1 m. In sector III, however, there is considerable ridging even in the zone closest to the ice edge and the corrected average thickness for the whole sector is around 2 m. No data are available for sector II.
6. Conclusions
The extremes of ice thickness found within the Antarctic pack are important for different reasons. Thin ice (<0.3 m) is crucial to the exchange of heat between the ocean and atmosphere, and thick ice (> 1 m) contains the bulk of the ice mass within the pack. In this paper, seasonal variations in the cover of different thickness categories, as well as the variation in ice thickness with distance from the ice edge, have been identified in the area 60°−150° E.
Ridge‐thickness profiles from floes in sectors I and III during late spring. Refer to text for details.
Area‐averaged ice thickness for zones of varying distance from the ice edge. The average thickness calculated from observations of undeformed ice only is compared with the average thickness estimated with account of ridging. Observations are from two voyages: (i) 25 October‐15 November 1992 (sector I) and (ii) 26 April‐4 May 1993 (sector III)
The area‐averaged ice thickness has been calculated for the undeformed component of the pack, which comprises 70−80% of the total area in each sector. This undeformed area‐averaged thickness is typically about 0.5 m, and heat loss through thin ice and open water may account for more than 80% of the total heat exchange between the ocean and atmosphere (Reference Worby and AllisonWorby and Allison, 1991). However, to account for the mass of ice in pressure ridges, the undeformed area‐averaged ice thickness in spring must be increased by between 1 and 4 times, to give a total average thickness (depending on region) of between 1 and 2 m. The considerable ice mass in ridges is important for determining the total mass budget of the pack ice, but it has little effect on the total energy budget of the sea‐ice zone, because of the non‐linear relationship between the turbulent heat fluxes and ice thickness discussed by Reference Worby and AllisonWorby and Allison (1991).
In the late spring when the sea ice is at its maximum extent, the mix of ice‐thickness categories is greatest. New ice forming in leads and areas of extensive ridging are present in most zones of the pack. The outer 350 km of the pack, in the Antarctic Circumpolar Current, is a zone of relatively uniform ice characteristics between sectors, whilst further south, local coastal and bathymetric features cause significant variability in ice drift and hence in the thickness distribution. There is evidence of this in sector III, where pressure ridges up to 10m thick can be found in all zones. This contrasts with sectors I and II, where ridges average 1−4 m thick and are confined mainly to the zones > 150 km south of the ice edge. As a consequence, the area‐averaged ice thickness in spring, including ridging, is only 1 m in sector I but 2m in sector III.
The proportion of thin ice within the pack decreases through October and November, and by December only ice >0.3 m thick remains. With the exception of sector III, little ice survives the summer melt and by February‐ March the new growth season starts over again.
Acknowledgements
The authors are grateful to the officers and crew of RSV Aurora Australis and MV Icebird for their assistance in deployment and recovery of personnel and equipment to ice floes, and to passengers who have helped with the field sampling. Passengers and crew have also assisted with ice‐characteristics observations on some voyages.