


I. INTRODUCTION
Geometry optimization has become an important part of mechanical part design (Arora, Reference Arora2004; Janushevskis et al., Reference Janushevskis, Auzins, Melnikovs and Ancane2012). Most advanced commercially available finite-element software allows engineers to design and simulate complex geometries. Nature-inspired designs are just one example of complex geometries (Dickinson, Reference Dickinson1999). Wide ranges of industrial materials, from aircraft engine parts to ceramic dental crowns, not only have complex geometry but are also made of advanced materials with properties that are changed by their production process. The expected material property might alter while sintering, machining, heat treating, or surface coating because of phase transformation, residual stresses, or a combination of both (Bale et al., Reference Bale, Tamura and Hanan2010). Inspection of complex geometry components with non-destructive testing is usually difficult to perform (Wirza et al., Reference Wirza, Bloor, Fisher, Sloot Peter, Hoekstra, Kenneth Tan and Dongarra2002). Measurements require more corrections if probe contact is required for the test such as ultrasonic techniques in contact mode (Chatillon et al., Reference Chatillon, Cattiaux, Serre and Roy2000). X-ray diffraction (XRD) is one the most powerful techniques for structure analysis, phase determination, and residual stress measurement. Complex geometries often have local stress concentration and in some cases exhibit phase transformation. Micro-XRD mapping is a non-destructive way of collecting information on a region of interest (Bruker, 2005).
Currently, laboratory available diffraction mapping tools are limited to two-dimensional (2D) mapping on flat surfaces. It is essential to place the sample surface in the center of diffraction for conventional powder XRD measurements. Displacement of the sample surface from the center creates a systematic error. In mapping, this could be avoided by focusing on each individual mapping. A video-laser auto z-alignment is one way for proper height adjustment before each exposure (He et al., Reference He, Jin, Preckwinkel and Smith2004; Allahkarami and Hanan, Reference Allahkarami and Hanan2011a). Residual stress and phase mapping measurements on complex geometries are challenging and a new field for exploration (Allahkarami and Hanan, Reference Allahkarami and Hanan2011b). It is natural to extend current 2D XRD mapping solutions for 3D surfaces. Avoiding shadowing is one challenge of mapping on 3D surfaces.
Here we demonstrate a method to take the advantage of an accurate five-axis stage, with an auto video-laser z-alignment system, advanced focusing optics, and 2D detector to demonstrate an efficient algorithm for XRD data collection on complex contoured surfaces.
II. EXPERIMENTAL PROCEDURE
A. Shadowing
Detector shadowing in XRD happens when the X-ray detector does not have a full view of the illuminated spot from interception by a foreign object or a part of the sample geometry itself. In the case of a complex geometry, there is a chance of beam blockage even before reaching the desired measurement point. Figure 1(a) shows the case that the 2D detector is completely blocked by some parts of the sample itself. Proper tilt and rotation may completely or partially resolve this issue. Keeping the exposure point constant and rotating the sample around the vertical axis may partially move the obstacle away from diffracted beam path, as shown in Figure 1(b).
(Color online) Schematic illustration of showing (a) completely blocked frame (b) partially blocked frame, and (c) not blocked frame.

Tilting the sample is another way of avoiding the shadowing. A combination of rotation and tilt that successfully removed the shadowing is shown in Figure 1(c).
This requires a precision stage to keep the exposure point coordinates constant while rotating or tilting the sample.
B. Geometry measurement using an auto z-alignment laser-video system
Although one can find a working rotation and tilt angle for a single measurement point by trial and error, implementing the technique for mapping that involves several hundreds of measurement points requires an automated tilt and rotation angle determination. In the case of an ordinary curved surface, a rotation that makes the sample surface normal, n, parallel to the instrument, z, direction is the least shadowing configuration. This requires information about the local geometry to calculate the normal vector at each measurement point.
As a specific example, a dental crown core was selected for this study. Zirconia core dental crowns are a good example because, in addition to having a complex surface geometry, they exhibit geometry-dependent stress-induced phase transformation. The zirconia core is polycrystalline and sintered with randomly oriented grains. Therefore rotating and tilting the sample does not change the phase ratio and stress measurement. Laser-video sample alignment is designed to assist in positioning the sample into the instrument center. This was used for topography. The optical microscope provides a magnified image of the sample, a laser pointer, and a cross hair. The cross hair, laser pointer, and X-ray beam must be calibrated to coincide at the instrument center. Figure 2(a) schematically illustrates that by moving the sample up and down, the cross hair, laser, and desired point can be triangulated.
(Color online) (a) Schematic of laser-video sample alignment system. (b) Photo of the experimental setup showing the goniometer, stage, alignment optics, source, and detector.
Figure 5(a) shows a top view of the optical microscope image 700 points (25 × 28) on the surface of the crown spaced by 0.25 mm in both the x- and y-directions. The initial z-values for all points were assigned a convenient constant, and the system was allowed to find the correct z-value for the points. A predetermined geometry might be collected before installing the sample on the XRD measurement stage using other available techniques such as laser scanning (Forest and Salvi, Reference Forest and Salvi2002) or micro-X-ray tomography (Verdonschot et al., Reference Verdonschot, Fennis, Kuijs, Stolk, Kreulen and Creugers2001; Magne, Reference Magne2007). An advantage of this laser method is the geometry information available at the current instrument reference frame. This eliminates problems related to reference matching, scaling, and rotation transformation involved with using predetermined sample geometries.
(Color online) Translation and Euler's rotations required before each exposure.
Knowing the coordinates of each measurement point Xi(x i, y i, z i) of mapped area the surface unit length normal vector ni was calculated. The normal direction is considered to be pointing outside. n x, n y, and n z are scalar components of the surface unit normal.
 $${\bf n} = {n_x}\lpar x\comma \; y\comma \; z\rpar \; \hat i + {n_y}\lpar x\comma \; y\comma \; z\rpar \; \hat j + {n_z}\lpar x\comma \; y\comma \; z\rpar \; \hat k $$
where n.n = n x2 + n y2 + n z2 = 1
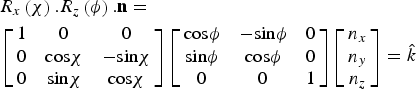
Point heights and outward pointing unit normal vectors obtained from the laser-video auto z-measurement are properly superimposed on the tomography geometry as displayed at Figure 5(b). This graphically validates the laser-based method for auto geometry correction. Translation, rotation R z(ϕ) and tilt R x(χ) are required before each exposure as shown in
In matrix notation:
 $$\eqalign{& {R_x}\left(\chi \right).{R_z}\left(\phi \right).{\bf n} = \cr & \left[{\matrix{ 1 & 0 & 0 \cr 0 & {{\rm cos}\chi } & { - {\rm sin}\chi } \cr 0 & {{\rm sin}\chi } & {{\rm cos}\chi } \cr } } \right]\left[{\matrix{ {{\rm cos}\phi } & { - {\rm sin}\phi } & 0 \cr {{\rm sin}\phi } & {{\rm cos}\phi } & 0 \cr 0 & 0 & 1 \cr } } \right]\left[{\matrix{ {{n_x}} \cr {{n_y}} \cr {{n_z}} \cr } } \right]= \hat k}$$
A rotation ϕ angle is required in such way that rotates the vector  ${\bf n}=n_x \hat i+n_y \hat j+n_z \hat k$ and produces
 ${\bf n}_1=n^{\prime}_y \; \hat j+n^{\prime}_z \; \hat k$ or in matrix notation:
 $$R_z \left(\emptyset \right).{\bf n}=\left[{\matrix{ {{\rm cos}\phi } & { - {\rm sin}\phi } & 0 \cr {{\rm sin}\phi } & {{\rm cos}\phi } & 0 \cr 0 & 0 & 1 \cr } } \right]\left[{\matrix{ {n_x } \cr {n_y } \cr {n_z } \cr } } \right]=\left[{\matrix{ 0 \cr {n^{\prime}_y } \cr {n^{\prime}_z } \cr } } \right]={\bf n}_1 $$
Eq. (3) is equal to three equations and three unknowns n y′, n z′, and ϕ
 $$\eqalign{& {\rm cos}\phi n_x - {\rm sin}\phi n_y=0 \cr & {\rm sin}\phi n_x+{\rm cos}\phi n_y=n^{\prime}_y \cr & n_z=n^{\prime}_z } $$
Substituting ϕ from the first equation into second equation,
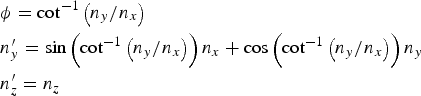 $$\eqalign{& \phi={\rm cot}^{ - 1} \left({n_y /n_x } \right)\cr & n^{\prime}_y=\sin \left({{\rm cot}^{ - 1} \left({n_y /n_x } \right)} \right)n_x+\cos \left({{\rm cot}^{ - 1} \left({n_y /n_x } \right)} \right)n_y \cr & n^{\prime}_z=n_z } $$
The ϕ rotation could transfer the surface normal to be coplanar with the y–z plane, while n′y has  $ \pm {\,\hat{\! j}}$ direction. The ϕ rotation could transfer the surface normal to be coplanar with the y–z plane, while n′y has
 $ \pm {\,\hat{\! j}}$ direction. Because the system driver for χ movement has drive limits from −5° to 55°, however to help prevent collisions 48° was used as the maximum, only rotation was considered that leads to n′y with
 $ -{\,\hat{\! j}}$ direction, in order to use the χ interval of 0° – 48° for the subsequent tilt.
For this purpose, at the first and second quadrant, π + ϕ was considered denoting that ϕ has a negative sign at the second and fourth quadrant and π + ϕ for the fourth quadrant. Figure 4 represents the ϕ angle at different quadrants and required rotation to make n′y parallel to  $- {\,\hat{\! j}}$.
(Color online) The ϕ angle at different quadrants and required rotation to make n′y parallel to  $- \hat j$.
The next step is to tilt the sample in order make surface normal collinear with the z-axis.
 $${R_x} \lpar \chi\rpar .{{\bf n}_1} = \left[{\matrix{ 1 & 0 & 0 \cr 0 & {{\rm cos}\chi } & {- {\rm sin}\chi } \cr 0 & {{\rm sin}\chi } & {{\rm cos}\chi } \cr } } \right]\left[{\matrix{ 0 \cr {{n_y^{\prime}}} \cr {{n}_z^{\prime}} \cr } } \right]= \left[\matrix{ 0 \cr 0 \cr {n_z^{\prime \prime}} } \right]= {{\bf n}_2} $$
From the above equations we can get,
 $${\rm cos}\chi .n^{\prime}_y - {\rm sin}\chi .\; n^{\prime}_z=0 \Rightarrow \chi={\rm tan}^{ - 1} \lpar n^{\prime}_y /n^{\prime}_z \rpar $$
Using the algorithm explained above, a Matlab code was developed that calculates the required tilt and rotation angle for all data points using the z height matrix data. The output result for χ and ϕ graphically superimposed on 3D geometry are shown in Figures 5(a) and 5(b), respectively. The calculated χ and ϕ are in agreement with what we expect from the symmetry and shape of the sample.
(Color online) (a) Typical image from top view of the grid (25 × 28) overlapped on 3D crown sample. (b) Outward-pointing unit normal vectors for measurement points, (c) calculated rotation angle φ, and (d) Tilt angles χ.
Bruker's laboratory D8 discover micro-XRD2 system with focused X-ray beam, precise automatic sample positioning stage, and 2D detector was used in for the experiment design and data collection. The system was equipped with the General Area Diffraction Detection System (GADDS) that allows users control on experiment parameters in the programming mode. Figure 6 shows a flowchart of stepwise data collection and analysis of 2D frames for the example curved surface of a dental crown. XRD was performed with CuKα radiation with tube parameters of 40 kV/40 mA.
(Color online) Flow Chart of the data collection procedure.
III. RESIDUAL STRESS MEASUREMENT
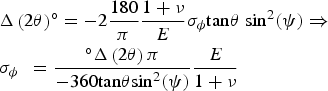
Diffraction rings in the frames collected at higher 2θ have a larger peak shift Δ(2θ)° in the presence of residual stress, and less sample displacement error (Krawitz, Reference Krawitz2001). It is appropriate to find a peak at high 2θ angles for our zirconia case. The selected peak is better to have sufficient intensity and be separated from other peaks. Based on this the (004) tetragonal zirconia peak at 73.065° was selected for stress calculation using the sin2ψ method. Using Bragg's law for λ = 1.541 78 Å and given θ 0 = 73.065 and the (004) ring, the peak shift can be expressed in degrees.
 $$\displaystyle{1 \over {d_{hkl}^2 }} = \displaystyle{{{h^2} + {k^2}} \over {{a^2}}} + \displaystyle{{{l^2}} \over {{c^2}}} \to {d_{004}} = 1.2951\, \AA $$
And
 $$\eqalign{& {\rm \Delta }\left({2\theta } \right)^{\circ} = - 2\displaystyle{{180} \over \pi }\displaystyle{{1 + \nu } \over E}{\sigma _\phi }{\rm tan}\theta \; {\rm si}{{\rm n}^2}\lpar \psi \rpar \Rightarrow \cr & {\sigma _{\phi \; }}\; = \displaystyle{{^{\circ} {\rm \Delta }\left({2\theta } \right)\pi } \over { - 360{\rm tan}\theta {\rm si}{{\rm n}^2}\lpar \psi \rpar }}\displaystyle{E \over {1 + \nu }}} $$
Therefore, for a given maximum sensitivity 0.01° E = 205 MPa, ν = 0.22, the minimum σ ϕ as a function of 2θ and ψ can be obtained. For a typical 2θ = 73° and ψ = 12°, a residual stress with magnitude of ±1 MPa is measurable. Because the (004) and (200) peaks overlap, a combination of two functions each represent one of the peaks.
 $$y{\rm \; }\left({2\theta } \right)= {{\rm A}_1}{\,f_1}\left({2\theta - 2{\theta _1}} \right)+ {{\rm A}_2}{\,f_2}\lpar 2\theta - {\rm \; }2{\theta _2}\rpar $$
where, A1, A2, θ 1, and θ 2 are intensity of the fitted peaks and angular position of fitted peaks centers, respectively.
 $${\,f_i} \; \lpar 2\theta - {\rm \; }2\theta _{\rm i}\rpar = [ 1 + K_{\rm i}^2 \lpar 2\theta - {\rm \; }2\theta _{\rm i}\rpar ^2] ^{ - M{\rm i\; }} $$
where K i determines the width of the fitted curve and M i governs the rate of decay of the tails. For M i = 1, the profile is purely Cauchy, for M i = 2, a Lorentzian function, and for M i = infinity, the profile is purely Gaussian (Allahkarami and Hanan, Reference Allahkarami, Hanan, Narayan and Colombo2012a).
Figure 7, illustrates a typical frame with a segmented region that involves (004) and (220) rings. The integrated intensity for each segment was fit by two Pearson VII functions using a Matlab program. The ψ range was segmented into smaller integration segments of a 1° ψ range. The residual stress for every scan point was evaluated from sin2ψ versus ψ curves using the following equation (Krawitz, Reference Krawitz2001):
(Color online) (a) Segmented 2D diffraction frame. (b) Conventional intensity versus 2θ after integration in the χ-direction.
 $${\sigma _\phi } = \displaystyle{{{\rm Slope}} \over {{d_{\psi \,=\, 0}}}}.\displaystyle{E \over {1 + \nu }} $$
Based on the slope and the intercept (d ψ = 0) the residual stresses were determined. It is convenient to use d ψ = 0 as stress-free reference value, which typically leads to an error of only 0.1% (Krawitz, Reference Krawitz2001; He, Reference He2011).
IV. RESULTS AND DISCUSSION
A. Qualitative phase mapping
All 2D frames were integrated to conventional XRD intensity versus 2θ data by running a .slm script file in Bruker General Area Detector Diffraction System (GADD) software (Bruker AXS Inc., Madison, Wisconsin, USA) in programming mode. The ratio of intensity of the ( ${\bar 1}11$) monoclinic peak to the intensity of the (101) tetragonal phase peak, could be used to qualitatively estimate phase transformation. Intensity versus 2θ data was imported to a Matlab workspace for peak fitting. A range of 26.0 ≤ 2θ ≤ 32.0 of data was selected for peak fitting, as it is a wide range that potentially includes only both major (
 ${\bar 1}11$) monoclinic and (101) tetragonal peaks separated enough from each other. A combination of Lorentzian and Gaussian functions was used for peak fitting (Allahkarami and Hanan, Reference Allahkarami and Hanan2012b). Figure 8 illustrates typical frames in selected the 2θ range with corresponding peak fits. Figure 8(a) only has the (101) tetragonal peak collected from a location with no phase transformation.
(Color online) (a) A typical frame that has only a (101) tetragonal peak. (b) A typical frame with both the tetragonal peak and the stress-induced monoclinic peak. (c) and (d) Pearson VII peak fitting of integrated frames.
Figure 8(b) has also the stress-induced ( ${\bar 1}11$) monoclinic peak along with the tetragonal peak, collected from a location of the crown exhibiting phase change. Monoclinic zirconium yttrium (01-070-4426) and tetragonal zirconium yttrium oxide (01-089-9066) powder diffraction cards from International Center for Diffraction Data (ICDD) were used for phase identification.
A map of the ratio of the monoclinic peak (−111) to the tetragonal peak (101), and overlaid map on 3D real geometry reconstructed from micro-X-ray tomography are illustrates in Figures 9(a) and 9(b), respectively.
(Color online) (a) Ratio map of monoclinic-to-tetragonal peaks (top view). (b) Superimposed phase ratio mapped on the 3D geometry of the crown core.
B. Quantitative phase mapping
The ratio of the peaks related to identified phases only provides an estimation of the amount of the phases. Quantitative determination of phase fraction in two phase zircoina collected patterns benefits from the whole pattern fitting. Successful quantitative analysis usually requires good quality data and understanding of the material under study. Figure 10 exemplifies refinement patterns for typical XRD data in a 2θ range from 5° to 80° for different amounts of monoclinic phase. The difference between the experimental and calculated data is shown under each pattern. The bars in these figures show the peak's location.
(Color online) Observed (red line), calculated (blue line), and difference (bottom) patterns for the Rietveld refinement from the X-ray diffraction data of yttria stabilized zirconia. The short vertical lines below the profiles mark the peak positions of all expected Bragg reflections.
The refinement analysis involves more analysis time. In this paper, a practical way to employ quantitative analysis for a representative subset of the data for training a neural network and predicting the amount of phases for the rest of the data set was used. The neural network approximates a function that relates the ratio of monoclinic-to-tetragonal peak areas to the amount of monoclinic phase in the two-phase zirconia sample calculated from Rietveld refinement using Topas software (Coelho, Reference Coelho2007). The method performed well when trained on a large data set of 30 members. The successfulness of the model depends on how well the training set represents the data. Figure 11 shows the histogram of peak intensity ratio that is not random. The peak ratio data are skew normal distribution so if we randomly select the training set, most of the training set would be from the highly likelihood region causing well model performance in the frequently appearing region and weak on the rest. Therefore the 700 data point set was divided into ten categories with respect to the relative peak ratio and four representative members were randomly selected. Ten members also were selected in the same way as test set.
(Color online) Histogram of monoclinic peak-to-tetragonal peak ratio for typical 700 point mapping.
Refinement for all 40 patterns was performed in Topas software. In this case, because we are using the Bayesian regularization training technique, we do not need to have a validation set. Only after the network was completely trained, testing points were used for testing the network performance.
The input vector for network training will consist of the intensity of the monoclinic peak (−111) to the tetragonal peak (101).
 $${\bf P} = \left[{\matrix{ {{i_1}} \cr {{i_2}} \cr } } \right]\comma \; $$
And the target will be monoclinic phase-to-tetragonal phase ratio from reitveld analysis.
 $$t = r $$
Both the input and target were mapped into the range of [−1,1]. The resulting scaled data are shown in Figure 12.
(Color online) Scaled input-target data.
Figure 13 shows the network architecture with five tan-sigmoid transfer functions in a hidden layer and a linear input layer. The network was trained for 200 iterations. After 50 iterations, the sum of squared error (SSE) was not changed considerably.
(Color online) Neural network architecture.
Scatter plots of network outputs versus targets and testing set shown in Figure 14, indicates that the network is well trained and properly predicts the targets for the testing set. The ideal case is a 45° line between output and targets (Hagan et al., Reference Hagan, Demuth and Beale2002).
(Color online) Network output versus training targets and testing targets.
The trained network was used for calculating the amount of monoclinic phase using the intensity of the monoclinic peak (−111) and the tetragonal peak (101) as input values. The quantitative value of monoclinic phase in the mapped region is illustrated in Figure 15(b). As expected, Figures 15(a) and 15(b) have similar geometry dependence. Comparing height projection of the crown [Figure 15(d)] with either peak ratio map [Figure 15(a)] or monoclinic phase content [Figure 15(b)], the largest values for this phase transformation were observed at the crown's geometric local maximums (cusps). Residual stress was observed to be tensile in all measurement point and as large as 140 MPa. Taken as a whole, an inverse correlation between height and residual stress was observed. Small values for residual stress were observed at the crown's geometric local maximums where maximum phase change happened. For better visualization, the percentage of monoclinic phase and residual stress are superimposed to the 3D geometry and illustrated in Figures 15(e) and 15(f), respectively.
(Color online) (a) Map of monoclinic peak-to-tetragonal peak ratio. (b) Quantitative map of monoclinic phase (using Rietveld). (c) Biaxial residual stress map stress. (d) Height map. (e) Superimposed monoclinic phase on 3D geometry of the core. (f) Superimposed biaxial residual stress on 3D geometry of crown core.
In spite of the fact that there are localized variations, correlations between the height of the measured point and phase percentage and height of the measured point and the measured residual stress, exists. This is shown in scatter plots, Figures 16(a) and 16(b).
(Color online) (a) Scatter plot for the correlation between phase transformation and height. (b) Scatter plot for the correlation biaxial residual stress and height. (c) Scatter plot for the correlation between phase transformation and residual stress measurements.
An ideal sintered crown is not expected to have appreciable residual stress or phase change. But due to different local cooling rates and non-uniform shrinkage imposed by the geometry, in plane tensile residual stress as large as +140 MPa, was observed. Tetragonal zirconia is a meta-stable phase and has transformed to monoclinic locally up to 20%. The observed inverse correlation between bi-axial residual stress and monoclinic phase percentage shown in Figure 16(c) in addition to the geometry is related to the instability of the tetragonal phase that can transform to monoclinic to relax stresses (Allahkarami and Hanan, Reference Allahkarami and Hanan2012b). Stress relaxation via phase transformation might create microcracks that can propagate by fatigue and impact the total life of a crown.
V. CONCLUSION
A new experimental method for residual stress measurement and phase mapping on curved surfaces using micro-XRD was developed. This development deals with the empirical challenges of implementing an efficient algorithm for 3D surface mapping. A rectangular grid projected on the curved surface and the geometry of surface was measured using a video-laser alignment system. The laser height measurement was in good agreement with 3D tomography. Having the surface grid points, surface normals were calculated for each exposure point. For all points on the map, the required local tilt and rotation angles were determined. Calculated rotation angles, tilt angles, and position coordinates were included in a script file.
A zircoina dental crown is a good example of a complex curved which has residual stress and induced local phase transformation. This was studied for testing the method. Residual stress and phase change were successfully mapped and superimposed on the 3D geometry for graphical visualization. An interesting connection between phase transformation and height of the local position for a typical crown sample, and between residual stress and phase transformation was observed. Implementing a six-axis stage instead of a five-axis provides more capability to the algorithm. This is the beginning of phase and residual stress mapping on curved surfaces and superimposing it on the geometry. Applying this method to other material systems will help develop the technique.
ACKNOWLEDGEMENTS
The ceramic dental core was provided by Dr. E. D. Rekow's team at NYU School of Dentistry. Partial research support provided by the Oklahoma Health Research award (project number HR07-134), from the Oklahoma Center for the Advancement of Science and Technology (OCAST).



