Introduction
Prompt initiation of airborne infection isolation (AII) in acute-care settings for individuals suspected of having pulmonary tuberculosis (TB) is critical for preventing transmission of Mycobacterium tuberculosis (MTB). When TB is being considered during diagnostic workup, appropriate specimens like sputum are obtained to test for acid-fast bacilli (AFB) smear and mycobacterial culture, the latter being the gold standard for diagnosis.Reference Lewinsohn, Leonard and LoBue1 Given that mycobacterial culture requires a prolonged incubation time, the criterion for discontinuing isolation is most frequently based on negative sputum smears. The Centers for Disease Control and Prevention guidelines recommend collecting 3 sputum samples for AFB smear and mycobacterial culture 8–24 hours apart while maintaining AII.Reference Jensen, Lambert, Iademarco and Ridzon2
Although the prevention of nosocomial transmission and outbreaks is a top priority for Infection Prevention and Control (IPC) programs, hospital capacity for providing airborne precautions is strained in the face of bed shortages and competing pressures with other diseases as was seen during the COVID-19 pandemic.Reference Bahl, Doolan, De Silva, Chughtai, Bourouiba and MacIntyre3 The process of clearing someone from isolation based on serial AFB smears often requires multiple days, and in high-income, low-TB-incidence countries such as Canada and the United States, most patients will not have TB.Reference Taylor, Nolan and Blumberg4 Unnecessary isolation also carries risks of increased patient adverse events, less attention from healthcare workers, and more social isolation.Reference Sprague, Reynolds and Brindley5–Reference Nair, Perencevich and Goto7 Lastly, the increased costs and environmental impact of medical supplies required for isolation precautions (ie, masks) are gaining more recognition.Reference Shukla, Khan, Saxena and Sekar8–Reference Millman, Dowdy and Miller10
Molecular testing by nucleic acid amplification tests (NAATs) has been shown to have superior sensitivity and specificity compared to sputum smears for detecting MTB.Reference Lewinsohn, Leonard and LoBue1,Reference Zifodya, Kreniske and Schiller11 The GeneXpert® MTB/RIF Assay (Cepheid, Sunnyvale, California) is a fully automated NAAT system for detection of MTB complex and genotypic rifampin resistance by 2 hours once a specimen is loaded into the instrument. It has 85% sensitivity in culture-proven TB compared to serial sputum microscopy which has a sensitivity of ∼ 60–70%.Reference Zifodya, Kreniske and Schiller11 Although the role of GeneXpert in the earlier diagnosis of TB is well established, its role in guiding de-isolation is less widespread in practice, despite recommendations for its use from the FDA and the United States National TB Controller Association in 2016.Reference Bernardo, Warshauer and Anderson12 Although GeneXpert offers greater test accuracy compared to AFB smears, the impact on real-world AII duration is not well characterized. This systematic review and meta-analysis was performed with an aim to compare airborne isolation times when using a GeneXpert strategy versus AFB smears.
Methods
Protocol registration
This systematic review was registered in the International Prospective Register of Systematic Reviews (PROSPERO, CRD42024538644) and reported according to the Preferred Reporting Items for Systematic Reviews and Meta-analysis (PRISMA) reporting guidelines.Reference Page, McKenzie and Bossuyt13
Search method
We systematically searched for publications in MEDLINE (Ovid), Embase (Ovid), and Scopus between January 1, 2001, to April 18, 2025. The search strategy consisted of a combination of medical subject headings and keywords including “TB,” “tuberculosis,” “GeneXpert,” “Xpert,” and “de-isolation” (Supplementary Table 1). We limited the search to articles in English and those indexed from 2001 onward because the GeneXpert system was developed and introduced into clinical settings thereafter.Reference Lawn and Nicol14 In addition, we manually screened the references of eligible studies for potential inclusion. We updated our database search on April 1, 2026, which did not identify additional studies for inclusion.
Eligibility criteria
We included studies (experimental or observational with empirical data collection) that described the difference in duration of AII between GeneXpert for hospitalized adults with suspected pulmonary TB who ultimately tested negative for TB. Testing had to be on respiratory specimens (induced or expectorated sputa, bronchoalveolar lavage, or endotracheal tube aspirates).
We excluded case reports, studies done in the outpatient setting, children, where testing was done solely on non-respiratory specimens, or for screening intent (eg, prior to immunosuppression without suspicion for TB disease).
Study selection and data extraction
Two reviewers (D.C., C.S.) independently screened the retrieved citations from the database search using Covidence (Veritas Health Information). Eligible studies were included after title and abstract screening based on the exclusion criteria, followed by full-text screening using the inclusion criteria. During the screening process, we performed an inter-rater calibration using the first 20 citations to ensure screening agreement (> 90%). Discrepancies in article screening were resolved by consensus.
Two reviewers (D.C. and R.L.) independently extracted data on study characteristics in duplicate using an a priori standardized form. Data extracted were authors, country, publication year, study period, study design, patient population (sample size, age, TB prevalence, HIV positivity, disease severity), intervention (method of sputum collection, concentrated versus unconcentrated specimen, number of sputum samples tested, and outcome measures (median time [with lower and upper interquartile ranges, IQR] or mean [with standard deviation] time to de-isolation, median time to treatment initiation [IQR], median hospital length of stay[IQR], sensitivity and specificity). Discrepancies in data extraction were resolved by consensus.
Outcomes
The primary outcome of this study was the difference in time of airborne isolation when using GeneXpert compared to AFB smears in hospitalized adult patients with suspected pulmonary TB, who subsequently were culture-negative and/or not diagnosed with pulmonary TB. Secondary outcomes included the hospital length of stay (LOS), as well as the sensitivity and specificity of GeneXpert and AFB smears.
Risk of bias assessment
Two reviewers (D.C. and C.S.) independently assessed the risk of bias of eligible primary studies using the Risk of Bias In Non-randomized Studies-of Interventions (ROBINS-I) tool.Reference Sterne, Hernán and Reeves15 Differences in assigned scores were discussed to try to reach consensus but where agreement could not be reached, R.L. arbitrated.
Analysis of studies
We compared the difference in median time to de-isolation for GeneXpert vs AFB smears. As time to de-isolation was not normally distributed, standard meta-analytic methods could not be directly applied to generate a pooled estimate, and therefore we used the median-based quantile estimation method described by McGrath et al with the R package “metamedian” to calculate the pooled difference of medians.Reference McGrath, Sohn, Steele and Benedetti16,Reference McGrath, Zhao, Ozturk, Katzenschlager, Steele and Benedetti17 Studies where only mean duration of isolation was reported were not included in meta-analyses. We quantified statistical heterogeneity for median differences in de-isolation time between studies using the I 2 statistic where values of <25%, 25–50%, and >50% represented low, moderate, and high degree of heterogeneity, respectively.Reference Higgins, Thompson, Deeks and Altman18 Median LOS in hospital was reported in only 2 studies, and meta-analysis was not performed due to sparse data.
As a secondary outcome, the sensitivity and specificity of AFB and Xpert tests were calculated based on the number of true positive, false positive, false negative, and true negative cases reported. Meta-analyses of sensitivity and specificity were conducted using bivariate binomial (generalized linear mixed) models, assuming a common threshold for each test across studies, as recommended.Reference Takwoingi, Dendukuri, Schiller, Deeks, Bossuyt, Leeflang and Takwoingi19 This was visualized using a receiver operating characteristic (ROC) plot where the performance of each test in each study was displayed as an open circle according to its reported sensitivity and specificity (with the size proportionate to the size of the study). The pooled sensitivity and specificity were displayed as solid circles, surrounded by the corresponding 95% confidence region as a dotted line. The summary points for sensitivity and specificity of the different tests were compared (as limited to studies where direct head-to-head comparisons were available) using meta-regression with unequal variances. The likelihood ratio test was used to formally test for statistical differences. We relied on visual inspection of the coupled forest plots and the summary ROC plots to describe heterogeneity, rather than using the I 2 statistic, as the latter is univariate and not recommended for meta-analyses of studies of diagnostic test accuracy. Reporting bias was not assessed as no validated methods exist to assess for small study effects using medians and IQRs.Reference Zwetsloot, Van Der Naald and Sena33 Statistical analyses were performed using R version 4.5.0 (R Foundation for Statistical Computing, Vienna, Austria), Stata version 17.0 (StataCorp, College Station, TX, USA), and RevMan version 5.4.1 (The Cochrane Collaboration, Copenhagen).
Results
Search results
We retrieved 875 citations, of which 746 remained after duplicate removal. Title and abstract screening excluded 704 papers. Of the resultant 42 full-text reviews, only 7 were eligible for inclusion into our systematic review, and 5 were included in subsequent meta-analyses (Figure 1).Reference Chaisson, Roemer and Cantu20–Reference Chaisson, Duong and Cattamanchi26 Manual bibliographic search of the full-text articles yielded no further studies eligible for inclusion. Most of the excluded studies did not quantify the difference in median isolation time (n = 14), were of inappropriate design (n = 4), or were conducted in a patient population that was not of interest (n = 4). There was high inter-rater reliability for both abstract screening (k = 90%) and full-text review (k = 94%).
PRISMA diagram.

Figure 1. Long description
Flowchart illustrating the identification, screening, and inclusion of studies via databases and registers for a review on pulmonary tuberculosis. The process begins with the identification of 875 studies from Embase, Medline, and Scopus databases. Duplicate records (129) are removed before screening. Of the remaining 746 records, 704 are excluded after screening. Reports sought for retrieval total 42, with none not retrieved. These 42 reports are assessed for eligibility, and 35 are excluded for various reasons such as wrong setting, wrong outcomes, insufficient comparator, wrong study design, inability to locate the study, wrong patient population, and lack of quantitative data for analysis. Finally, 7 studies are included in the review.
Risk of bias assessment
Risk of bias assessment of included studies is reported in Figure 2. Most of the included studies had moderate (n = 4) or severe (n = 2) risk of bias; this was mostly attributable to confounding and missing data. Potential residual confounding factors may include the ability to obtain sputum samples promptly due to patient or hospital-related delays in sputum collection, transportation of specimens to an off-site lab, triaging of multiple samples for processing, and delays in de-isolation following final lab results.
Risk of bias of included studies using ROBINS-I.

Figure 2. Long description
The table presents the risk of bias assessment for seven studies using the ROBINS-I tool. It includes columns for different bias domains labeled D1 through D7 and an overall judgment column. Each row corresponds to a different study, with the study names listed on the left. The bias domains are bias due to confounding, selection of participants, classification of interventions, deviations from intended interventions, missing data, measurement of outcomes, and selection of the reported result. Each cell contains a color-coded judgment: red for serious, yellow for moderate, and green for low risk of bias. The studies listed are Chaisson (2014), Lippincott (2014), Cowan (2017), Poonawala (2018), Chaisson (2018), Parraga Acosta (2020), and Menon (2020). Notable trends include varying levels of bias across different studies and domains, with some studies showing more serious risks in specific areas.
Study characteristics
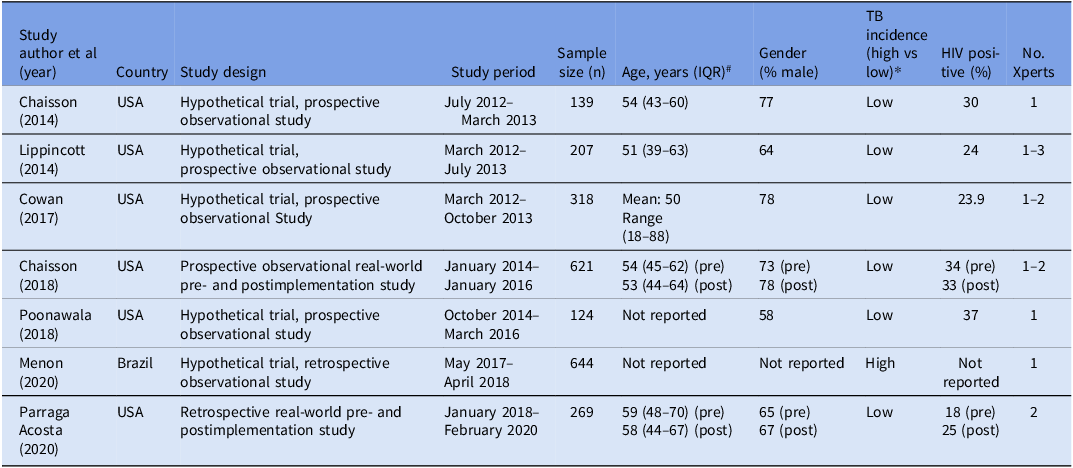
Characteristics of the included studies are presented in Table 1. Studies were published between 2014 and 2020. All included studies were observational cohorts (prospective [n = 4], retrospective [n = 1], before-and-after [n = 2]), performed in acute-care inpatient settings, with a median study duration of 17 months. Five studies were hypothetical trials due to GeneXpert not yet being approved in their centers for making de-isolation decisions. In these studies, the time to de-isolation in real life was typically measured by electronic/paper order times when guided by serial AFB protocols and the theoretical time for GeneXpert protocols determined by real-life run times for GeneXpert done on residual sputum specimens and adding hypothetical time for reporting. Menon et al was the only study that took place in a high-incidence TB setting (Brazil); all others were conducted in the United States.
Characteristics of studies included

Table 1. Long description
The table presents characteristics of studies on tuberculosis and HIV positivity rates, including study author, country, study design, study period, sample size, age, gender, TB incidence, HIV positive percentage, and number of experts. The table has eight columns and seven rows, with each row representing a different study. The studies were conducted in the United States and Brazil between 2012 and 2020. The sample sizes range from 124 to 644 participants, with varying ages and gender distributions. TB incidence is categorized as high or low, and HIV positive percentages range from 18 to 37 percent. The number of experts involved in the studies ranges from one to three.
Note. TB, tuberculosis; HIV, human immunodeficiency virus; No, number; pre, preimplementation; post, postimplementation; IQR, interquartile range.
# indicates median, unless otherwise reported.
* high TB incidence defined as greater than or equal to 40 cases per 100,000 people.
In a hypothetical study by Lippincott et al, patients were de-isolated based on 3 sputum AFB smear results, with leftover specimens tested using GeneXpert (1–3 samples per subject).Reference Lippincott, Miller, Popowitch, Hanrahan and Van Rie22 The median AII duration for 207 subjects who tested negative for TB was 68 hours (IQR 47.1–97.5 hours), whereas a single GeneXpert sample would have reduced AII duration to 41.2 hours (IQR 26.6–54.8 hours).
Chaisson et al (2014) analyzed 142 specimens to compare AII durations using at least 2 negative sputum AFB smears versus GeneXpert performed on unconcentrated and concentrated sputum samples.Reference Chaisson, Roemer and Cantu20 The authors concluded that during the 1-year period, the GeneXpert protocol would have reduced between 159 and 258 isolation days.
Cowan et al included 318 admissions for evaluation for pulmonary TB with at least 1 respiratory sample where leftover aliquots were reserved for GeneXpert testing.Reference Cowan, Chandler and Kracen25 The authors considered 4 hypothetical strategies to compare with the 3-smear strategy: single unconcentrated GeneXpert, single concentrated GeneXpert, 2 concentrated GeneXpert, and 2 AFB smears. They concluded that an Xpert done on 1 unconcentrated sputum was the most cost-effective strategy and did not compromise sensitivity.
Poonawala et al studied hypothetical durations for the GeneXpert strategy based on real-life laboratory processing times for GeneXpert in addition to extra time to enter and relay results to clinicians.Reference Poonawala, Leekha and Medina-Moreno21 Based on 124 subjects, the median duration of AII was 67 hours (IQR 48.9–95.6 hours) using the standard AFB smear protocol, while reporting a negative GeneXpert result reduced the duration to 42.3 hours (IQR 28.2–65.3 hours).
Menon et al investigated 224 Brazilian patients admitted for suspected pulmonary TB.Reference Menon, Feliciano, de Campos and Bollela24 The mean isolation duration was 84 hours and 24 hours for AFB smear and GeneXpert (standard deviations not reported), respectively, which in total would have saved 560 patient-days in isolation during the 1-year study period.
Two before-and-after implementation studies examined the real-world impact of GeneXpert-guided de-isolation. A retrospective cohort study by Parraga Acosta et al compared AII durations for 1-year periods before and after GeneXpert implementation in 269 admissions for suspected TB.Reference Acosta, Vahia and Hanna23 Compared to 3 AFB smears, 2 negative GeneXpert’s to discontinue AII resulted in reduction of almost 24 hours (70.2 hours vs 93.7 hours). Similarly, a prospective before-and-after cohort study by Chaisson et al (2018) compared AII duration after a negative GeneXpert and/or AFB smears if subjects had low probability of TB, or 2 negative GeneXpert’s and/or 2–3 negative AFB smears in high-probability cases.Reference Chaisson, Duong and Cattamanchi26 Sputum testing occurred for 621 patients during the entire study period, and postimplementation, 234 of 320 patients had GeneXpert testing. Median duration of isolation decreased from 2.9 days (IQR 2–3.7 days) to 2.5 days (IQR 1.7–3.4 days).
Primary outcome
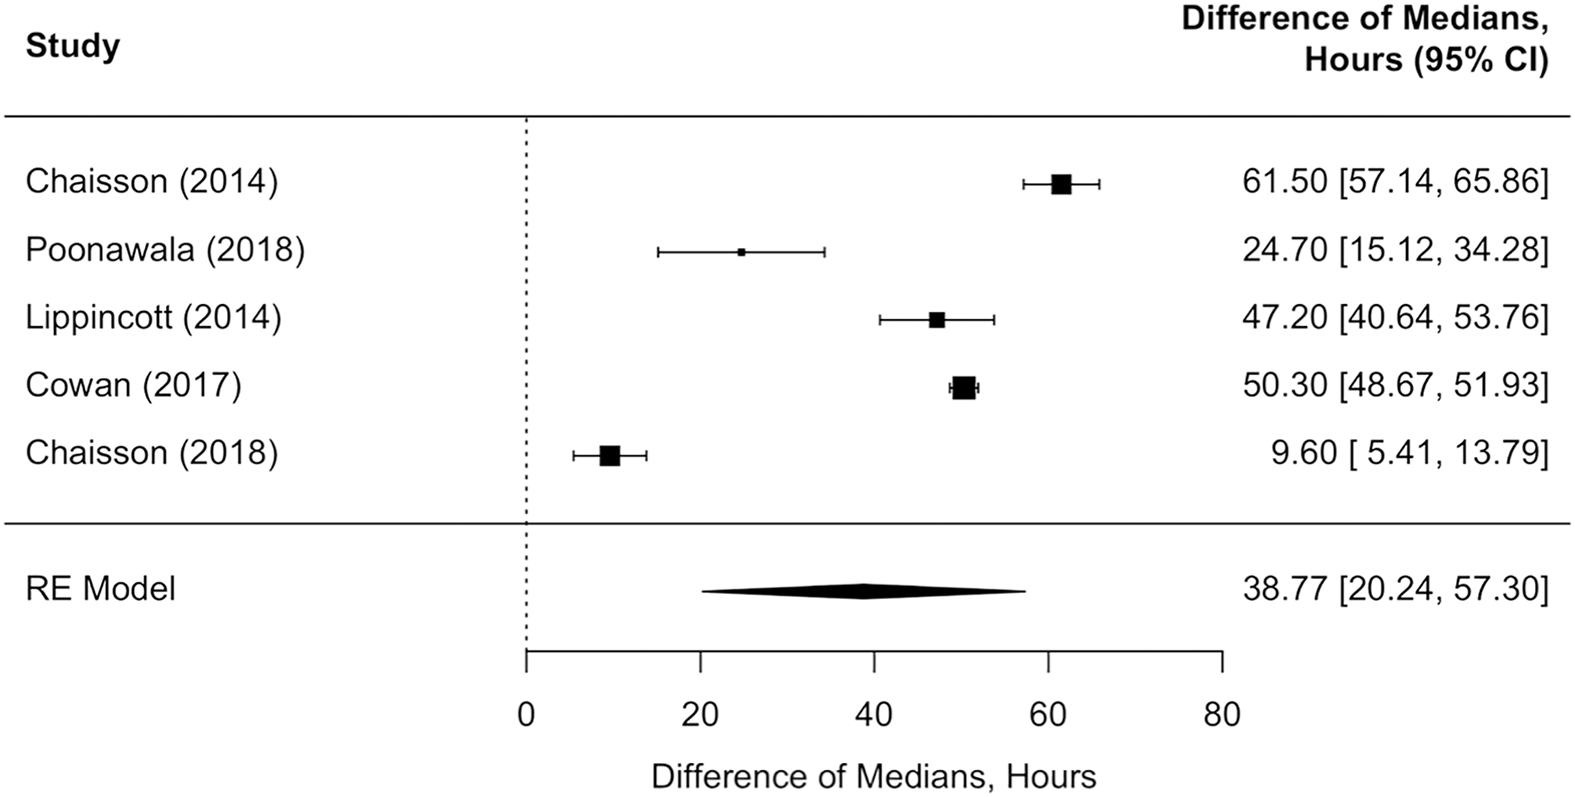
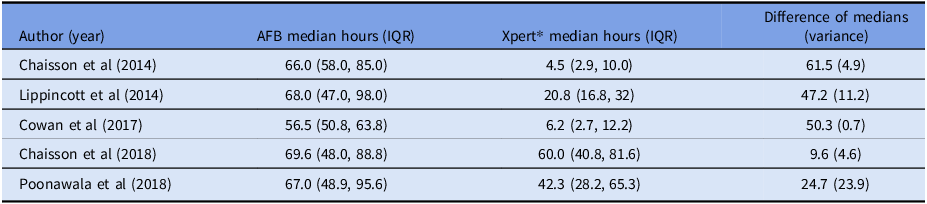
Comparing a single GeneXpert on an unconcentrated specimen compared to serial microscopy, there was a pooled reduction in time under AII of 38.8 hours (95% confidence interval 20.2–57.3) (Figure 3). AII durations from included studies are depicted in Table 2 and Supplementary Figure 1.
Forest plot of reduction in time of airborne infection isolation between acid-fast bacilli smears and a single unconcentrated GeneXpert.

Figure 3. Long description
The box-and-whisker plot compares the difference of medians in hours for various studies on airborne infection isolation. The x-axis represents the difference of medians in hours, ranging from 0 to 80 hours. The y-axis lists the studies: Chaisson (2014), Poonawala (2018), Lippincott (2014), Cowan (2017), and Chaisson (2018), along with an RE Model. Each box plot shows the median, lower quartile, upper quartile, and whiskers indicating the range of data. Chaisson (2014) has a median of 61.50 hours, Poonawala (2018) has a median of 24.70 hours, Lippincott (2014) has a median of 47.20 hours, Cowan (2017) has a median of 50.30 hours, and Chaisson (2018) has a median of 9.60 hours. The RE Model shows a median of 38.77 hours. The plot highlights the variability in the reduction of time for airborne infection isolation across different studies.
Airborne isolation durations for the included studies

Table 2. Long description
The table presents data on airborne isolation durations from various studies. It includes columns for the author and year, AFB median hours with interquartile range, Xpert median hours with interquartile range, and the difference of medians with variance. The studies listed are Chaisson et al 2014, Lippincott et al 2014, Cowan et al 2017, Chaisson et al 2018, and Poonawala et al 2018. The AFB median hours range from 56.5 to 69.6, while the Xpert median hours range from 4.5 to 60.0. The difference of medians varies significantly, with the highest being 61.5 hours and the lowest being 2.47 hours.
Note. AFB, acid-fast bacilli; IQR, interquartile range.
* GeneXpert on an unconcentrated sputum.
We performed subgroup analyses comparing time to de-isolation using AFB smears and 1 concentrated GeneXpert sample (Supplementary Figure 2) and 2 concentrated GeneXpert samples (Supplementary Figure 3). When concentrated GeneXpert sample(s) were compared to AFB smears, there was a trend toward reduced AII time, but it was not statistically significant. There was not enough data reported in the included studies to perform other planned subgroup analyses.
Secondary outcomes
Two studies reported outcomes on hospital LOS for GeneXpert-based de-isolation protocols. Parraga Acosta et al showed a non-significant reduction in LOS of 0.8 day (P = .5) using GeneXpert.Reference Acosta, Vahia and Hanna23 In contrast, Chaisson et al demonstrated a statistically significant reduction in LOS by 1.1 days using GeneXpert (P = .003).Reference Chaisson, Duong and Cattamanchi26
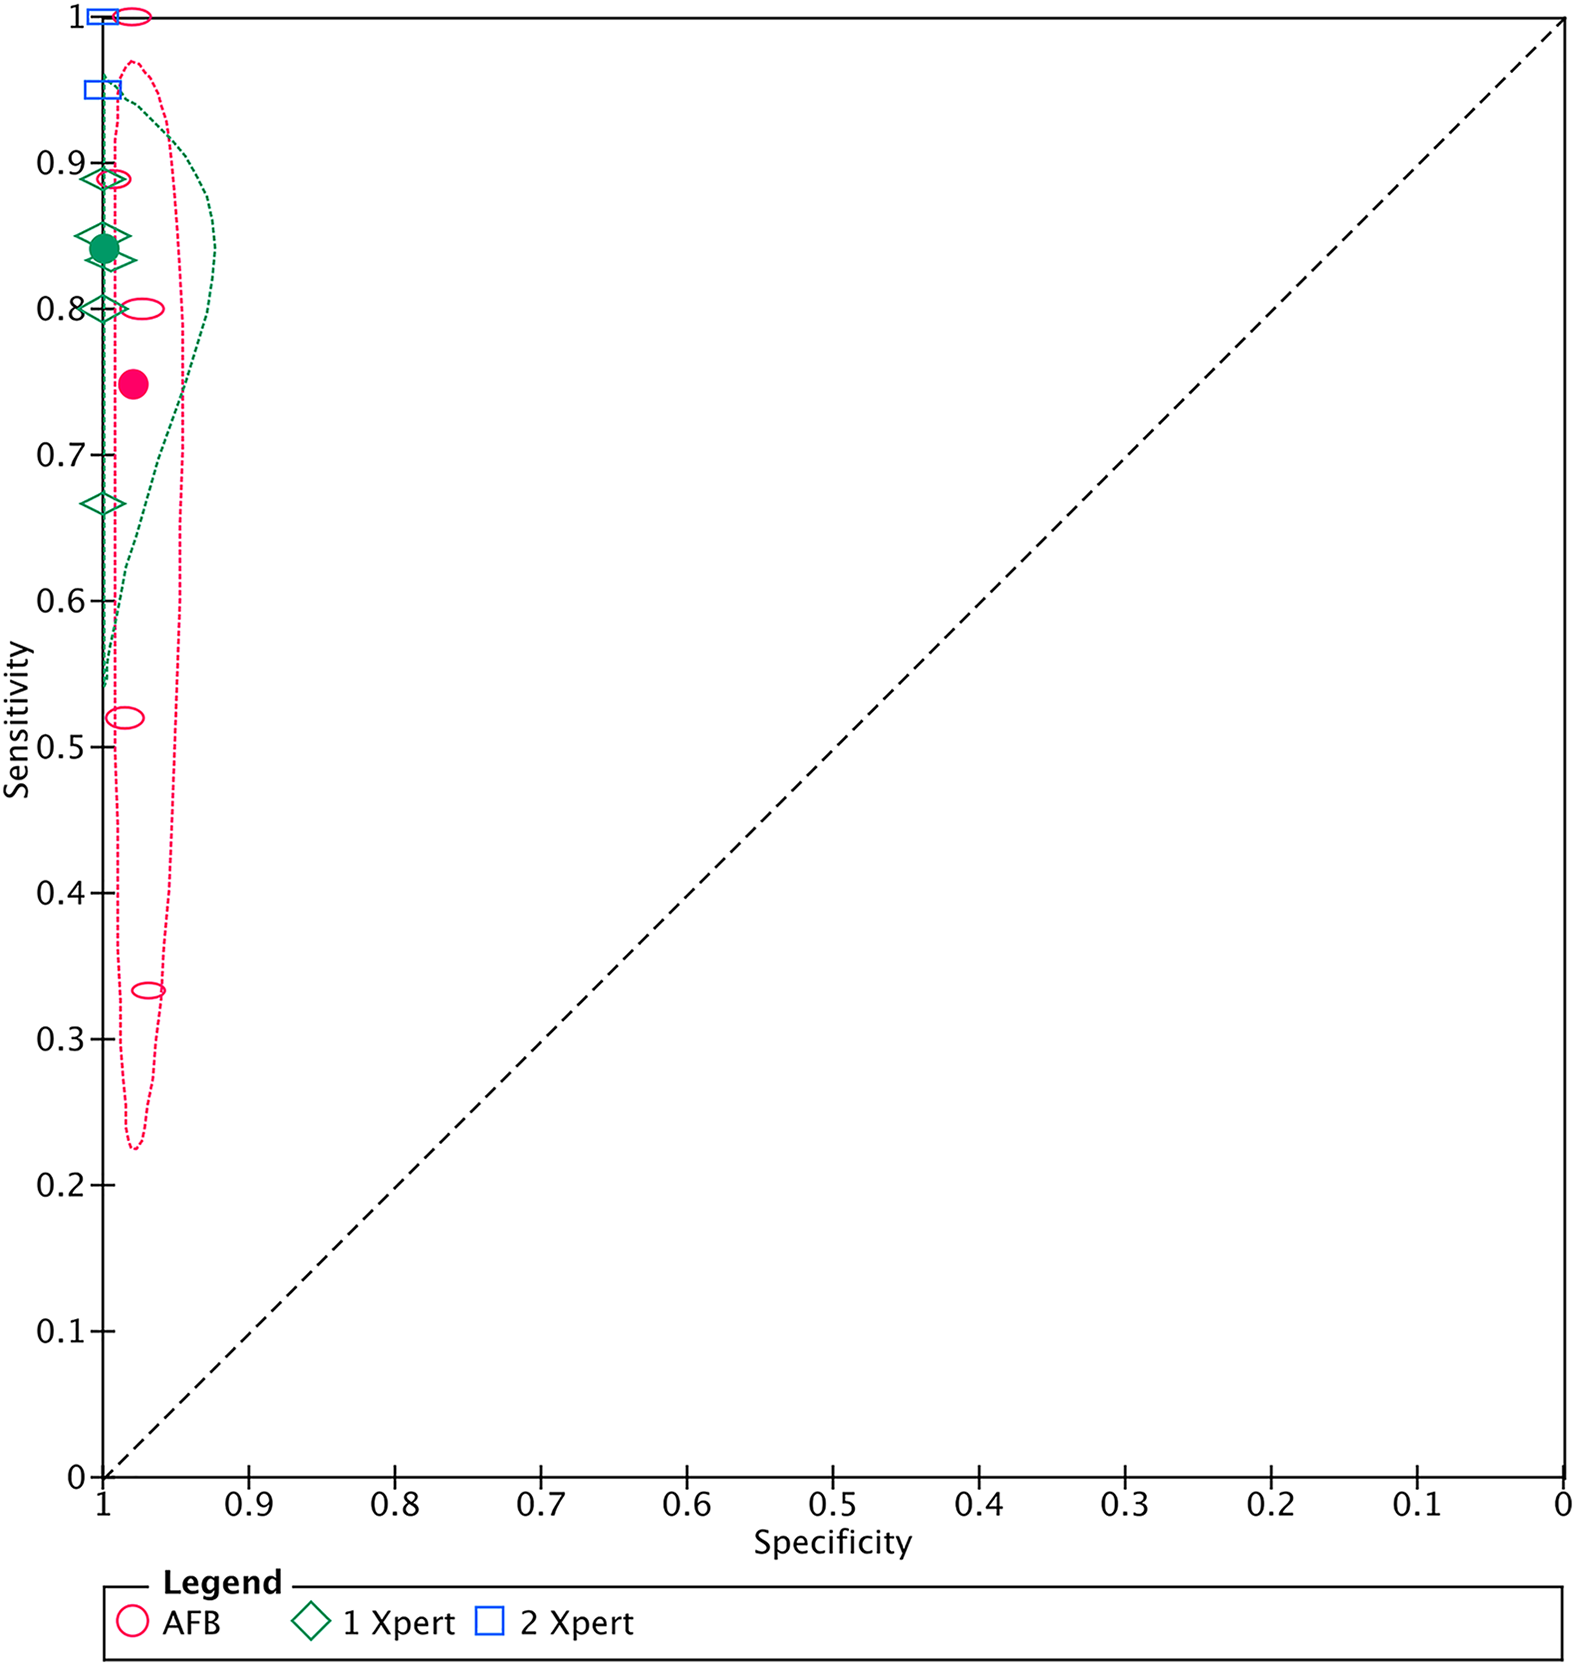
Five studies were analyzed to estimate the sensitivity and specificity of GeneXpert compared to AFB.Reference Chaisson, Roemer and Cantu20–Reference Lippincott, Miller, Popowitch, Hanrahan and Van Rie22,Reference Menon, Feliciano, de Campos and Bollela24,Reference Cowan, Chandler and Kracen25 For 2 Xpert tests, there were 2 studies.Reference Lippincott, Miller, Popowitch, Hanrahan and Van Rie22,Reference Cowan, Chandler and Kracen25 Figure 4 outlines the coupled forest plots. Figure 5 shows the ROC plot from the bivariate binomial model. The pooled sensitivity and specificity for AFB was 74.8% (95% confidence interval 51.0–89.5) and 97.9% (95% confidence interval 96.8–98.7), respectively. The pooled sensitivity and specificity for 1 Xpert was 82.5% (95% confidence interval 71.2–90.1) and 99.9% (95% confidence interval 99.3–100.0), respectively.
Coupled forest plot of sensitivity and specificity. AFB, acid-fast bacilli; TP, true positive; FP, false positive; TN, true negative; FN, false negative; CI, confidence interval.

Figure 4. Long description
The table compares the sensitivity and specificity of AFB and Xpert tests across multiple studies. It includes data on true positives, false positives, false negatives, true negatives, and confidence intervals for each study. The studies listed are Chaisson 2014, Cowan 2017, Lippincott 2014, Menon 2020, and Poonawala 2018. The table is divided into sections for AFB, one Xpert, and two Xpert tests. Each section provides detailed metrics for sensitivity and specificity, along with graphical representations of these metrics. The data highlights variations in test performance across different studies and conditions.
SROC plot of Xpert for detection of pulmonary tuberculosis, microbiological reference standard. The solid red dot is the pooled sensitivity and specificity for acid-fast bacilli; the solid green dot is the pooled sensitivity and specificity for 1 Xpert. There is no solid dot for 2 Xpert because there was a single study. Each open circle represents an individual study, and the size is proportionate to the study size. The height/width of each open circle represents the variance of each individual study. The dotted red and green lines represent the 95% confidence region around each pooled estimate.

Figure 5. Long description
A line graph displays the sensitivity and specificity of Xpert for detecting pulmonary tuberculosis using different methods. The x-axis represents specificity, ranging from 0 to 1, while the y-axis represents sensitivity, also ranging from 0 to 1. The graph includes three data series: AFB, 1 Xpert, and 2 Xpert. The solid red dot indicates the pooled sensitivity and specificity for acid-fast bacilli, while the solid green dot represents the pooled sensitivity and specificity for 1 Xpert. There is no solid dot for 2 Xpert due to a single study. Each open circle represents an individual study, with the size proportionate to the study size. The height and width of each open circle indicate the variance of each individual study. The dotted red and green lines represent the 95% confidence region around each pooled estimate. All values are approximated.
Discussion
Instituting airborne isolation for the purposes of excluding TB is a resource-intensive task, particularly involving personal protective equipment, human resources, and bed capacity. Rapid molecular testing to guide the discontinuation of airborne isolation has been shown to be beneficial in multiple single-center studies, by reducing airborne isolation duration without compromising the risk of transmission. We found that the median difference in airborne isolation time was reduced by approximately 38 hours when compared to smear microscopy. There was insufficient evidence to analyze whether this translated to reduced LOS, although one study did find a significant difference.Reference Chaisson, Duong and Cattamanchi26 In keeping with prior studies, our analysis demonstrated higher sensitivity of GeneXpert compared to serial AFB smear microscopy, and the specificity of GeneXpert was 99%.Reference Chaisson, Roemer and Cantu20,Reference Poonawala, Leekha and Medina-Moreno21,Reference Cowan, Chandler and Kracen25
Unsurprisingly, there was significant heterogeneity across studies. Although all studies had a similar comparator, being AFB smear microscopy, there were significant differences in the study designs. Due to the lack of implementation of GeneXpert across centers, many utilized a hypothetical design, where GeneXpert was performed on residual specimens and assumptions were made about the estimated time to discontinue isolation. Poonawala et al also compared multiple hypothetical scenarios for reporting the Xpert result, which likely contributed to the higher observed variance in the median difference in isolation compared to the other studies. Although hypothetical trials can explore the impact of GeneXpert-based de-isolation, the findings may overestimate or underestimate the true effects in practice. Hospitals and labs have varying logistics with regard to processing specimens, conducting assays, and relaying the information to clinicians for action. Study protocols differed in terms of whether sputum specimens were concentrated or not before performing GeneXpert. The current manufacturer’s instructions state that GeneXpert may be performed on either raw or concentrated sputum.27 To our knowledge, there have been no studies to determine whether test accuracy changes if done on concentrated sputum. As sputum concentration often occurs before inoculation onto culture medium, both options seem feasible. The importance of specimen quality for determining isolation decisions cannot be overstated. Regardless of decision making via smears or Xpert, the volume and quality of the respiratory specimen should be adequate to avoid decisions that lead to premature de-isolation.
The number of GeneXperts required for de-isolation is somewhat contentious. The 2016 recommendations from the TB controllers in the United States recommend 2 GeneXperts.Reference Page, McKenzie and Bossuyt13 However, almost half of the studies utilized a single GeneXpert as the intervention, along with 2 studies examining 1- or multiple GeneXpert strategies simultaneously. A recent review evaluating diagnostic accuracy for 1 versus 2-Xpert strategies found that a 2-Xpert strategy only improved pooled sensitivity by 8% (86% vs 92%) while increasing AII duration and cost.Reference Gandhi, Shah, Gautam and Meena28 Institutions may need to decide between single versus 2-Xpert strategies balancing operational efficiency with diagnostic accuracy. An existing gap in knowledge is whether GeneXpert Ultra may perform well as a single specimen strategy for discontinuing isolation, as this newer version has improved sensitivity. Regardless of the method, clinicians should always practice clinical judgement, particularly in cases where there is higher suspicion for TB, such as among immunosuppressed individuals or in areas with higher prevalence of TB. In these cases, a second GeneXpert could be utilized in addition to careful IPC review before discontinuing isolation. The evidence suggests that GeneXpert would reduce the number of false negative cases compared to serial microscopy, though the sensitivity is notably lower than culture, which remains the gold standard for diagnosing TB. Fortunately, the potential transmissibility of those with negative AFB and NAAT is low, and reported cases of transmission from smear-negative cases from genotype-confirmed transmission reports are extremely rare in acute-care hospitals.Reference Khan, Nakasone and Ghajar29
Although GeneXpert has been available for more than a decade, its uptake for guiding de-isolation decisions has been slow. This is likely due to the upfront increased lab costs and labor associated with performing the assay on all admitted patients with possible TB. This is shortsighted though, as there have been multiple cost-benefit analyses that have shown cost savings driven by a reduction in isolation bed use, thereby saving total hospitalization cost.Reference Zifodya, Kreniske and Schiller11,Reference Cowan, Chandler and Kracen25,Reference Chaisson, Duong and Cattamanchi26 Chaisson et al determined an average savings of $13,347 per patient in their real-world study, while Cowan et al estimated a savings of $7,002 per patient in their hypothetical trial. Reference Cowan, Chandler and Kracen25,Reference Chaisson, Duong and Cattamanchi26 Although our results demonstrate a median reduction in isolation time of 38 hours, there is not a lot of real-world evidence that such a reduction would translate to cost savings. There is also a paucity of evidence to determine whether Xpert strategy reduces LOS. As many hospitals across North America are experiencing capacity issues, it seems prudent to expedite the evaluation of individuals with suspected TB, and an Xpert-strategy is likely to improve health-system costs and patient outcomes.
Aside from an Xpert-strategy, additional measures may further improve the process of ruling out TB in hospitals. A recent study by Dugdale et al developed and validated an innovative clinical decision support tool (TBorNotTB) to inform whether AII could be discontinued, following negative AFB smears and polymerase chain reactions.Reference Dugdale, Zachary and Craig30 They evaluated certain TB risk factors within a cohort of 208 matched case-controls and demonstrated that their tool had 100% sensitivity and 27% specificity to detect TB. Other strategies like reducing the number of AFB smears required for de-isolation from 3 to 2 have also been studied.Reference Dugdale, Zachary and McEvoy31 Simple means of further reducing the time in isolation may include faster orders for sputum collection/testing or direct communication between the laboratory and clinician, as was assessed in one study.Reference Poonawala, Leekha and Medina-Moreno21 Electronic order set implementation has also been shown to reduce isolation and admission durations.Reference Eddy, Seth, White, Sulis, Fagan and Bernardo32
There are several limitations in this study. There was significant heterogeneity among studies for reasons discussed above. Risk of bias included residual confounding and/or missing data, which may have affected the results. Most of the studies were hypothetical in nature when determining time to de-isolation using GeneXpert; therefore, the external validity and generalizability of the results are limited, although the few real-world implementation studies available show similar benefits. Due to the nature of the data, we could not assess for reporting bias due to risk of false-positive results.Reference Zwetsloot, Van Der Naald and Sena33
Conclusion
Using 1 GeneXpert to make de-isolation decisions may significantly reduce the duration of airborne isolation compared to serial AFBs, based on real-world evidence and hypothetical trials. The results of this systematic review and meta-analysis suggest benefit with Xpert-based strategy, but well-designed randomized clinical trials are warranted. Barriers to implementing Xpert-based de-isolation strategies in hospitals should be studied to facilitate better uptake.
Supplementary material
The supplementary material for this article can be found at https://doi.org/10.1017/ice.2026.10486.
Acknowledgments
None.
Author contribution
DC and RKL conceived the study. DC, CS, and RKL were responsible for study methods and data collection. DC, CS, AL, and PR conducted data analysis and interpretation. DC, CS, and RKL prepared the draft manuscript, and all authors reviewed the manuscript.
Financial support
None reported.
Competing interests
All authors report no conflicts of interest relevant to this article.