

Introduction
With its 255.5 million citizens, Indonesia is the fourth most populous country in the world (Badan Pusat Statistik 2014) and the “giant” of Southeast Asia (Hirschman Reference Hirschman1994, 391). It is no accident that, since its independence in 1945, Indonesia has been the focus of large and rich literatures in the social sciences, including anthropology, demography, economics, history, political science, and sociology. Yet a significant demographic event, the widespread anti-communist violence of 1965–66 that led to the transfer of power from Sukarno to Suharto, has received scant attention from quantitative social scientists, including demographers and economists. This violence was sparked by the kidnapping and murder of six senior Indonesian generals in the early hours of October 1, 1965, and in turn precipitated a prolonged period of mass killing fueled by long-simmering tensions between competing political power bases in Indonesia. These included then-president Sukarno and his allies in the Indonesian Communist Party (Partai Komunis Indonesia or PKI), the various factions within the Indonesian National Party (Partai Nasional Indonesia or PNI), the Indonesian army and army-affiliated militias, and Islam-based political parties including the Nahdlatul Ulama (NU).
The killings of 1965–66 have been called a genocide (Cribb Reference Cribb2001a) and “one of the twentieth century's more extensive mass murders” (Cribb Reference Cribb and Cribb1990b, 1). Estimates of the loss of life range from 78,000 to two million (Cribb Reference Cribb and Cribb1990b, table 1, 12). Pinning down an exact number is impossible, given the often secretive and dispersed nature of the killings (Cribb Reference Cribb, Wessel and Wimhöfer2001b; Oei Tjoe Tat Reference Tat1995). Strict curbs on discussion of the subject placed by the authoritarian New Order regime of Suharto, a key beneficiary of the violence, until its fall thirty-two years later, have further muddied the waters, placing the critical barrier of the passage of time in the way of understanding the events. Yet, since the fall of Suharto in 1998, scholars of Indonesia both in Indonesia and abroad have gradually come around to publicly reflecting on the events and their implications. In the context of this renewed interest and the recent fiftieth anniversary of the killings, the time for such a study is ripe.
While anthropologists, historians, journalists, and political scientists have produced numerous works that focus on this traumatic period (Cribb Reference Cribb1990a, Reference Cribb2001a, Reference Cribb, Wessel and Wimhöfer2001b; Crouch Reference Crouch1978; Fealy Reference Fealy2010; Hearman Reference Hearman2010, Reference Hearman, Kammen and McGregor2012; Hughes Reference Hughes1967; Kammen and McGregor Reference Kammen and McGregor2012; Kammen and Zakaria Reference Kammen and Zakaria2012; Melvin Reference Melvin2014; Robinson Reference Robinson1995; Roosa Reference Roosa2006, Reference Roosa2016; Sulistyo Reference Sulistyo1997), this rich literature has not been complemented by the formal statistical approaches that demographers and economists have to offer. Leading scholars of the subject have rightly lamented that “there has been no serious attempt to look for the demographic consequences of the Indonesian killings of 1965–66” (Cribb Reference Cribb, Wessel and Wimhöfer2001b, 86) and that the evidence about how the killings were carried out, where present, has been “anecdotal, fragmentary, and unreliable when not downright fraudulent” (Roosa Reference Roosa2016, 283). Given the traumatic nature of the killings, their sheer magnitude, and the devastation they wreaked on the populations and economies of the affected areas, the absence of these events from the mainstream discourse in development economics and demography on late twentieth-century Indonesia is nothing short of stunning. This lack of recognition very likely renders important aspects of the demographic analyses that ignore the events invalid or at best significantly compromised, at least for the period during which they were occurring. Examples of this lacuna can be found in Widjojo's (Reference Nitisastro1970) work on Indonesian demography, now considered a classic, and Hugo et al. (Reference Hugo, Hull, Hull and Jones1987), both of which mention the events only in passing and make no attempt to explicitly and systematically incorporate them into demographic analysis, even though they purport to study in detail Indonesian demography of that time period. Roosa (Reference Roosa2016) points out a similar silence in the work of leading Indonesian historians in the 1970s and 1980s. Even today, Cribb's claim is borne out by an analysis of the demographic literature on Indonesia, which continues to ignore these events at its own peril, producing portraits that may not be entirely accurate because they fail to account for the dramatic one-time changes in population that occurred in 1965–66, instead attributing their effects to longer-term secular trends in fertility, mortality, and migration.
The overarching aim of this article, therefore, is to begin to fill this significant gap by contributing a demographic and statistically driven perspective to the already-rich and qualitative cultural, historical, and political literature on the killings. After briefly reviewing the existing literature on the killings of 1965–66, I pay special attention to discussion of the demographic impact of the events. The specific objectives of this article are to answer two basic questions about the killings of 1965–66. The first question has to do with the magnitude and geographic distribution of losses in population as a result of the violence, and the second has to do with the cultural and political geography of the violence. I use a variant of the population loss method demonstrated in Chandra, Kuljanin, and Wray (Reference Chandra, Kuljanin and Wray2012) and Chandra (Reference Chandra2013) in conjunction with statistical data from population censuses of Indonesia to compute total and regional population loss estimates in the province of East Java. Using the available demographic data and demographic and statistical methods, I estimate, for the first time, a population growth model for the various regencies (kabupaten) of East Java, allowing for a one-time change in population coinciding with the timing of the killings. After producing estimates of population loss for the regencies of East Java, I interpret these estimates in light of the rich set of prior studies on the subject and examine associations between the varying cultural and political milieux across East Java and the intensity of the violence as measured by the estimated change in population associated with the violence. A study of this nature is of special significance because of its comprehensive regional (rather than local) scope and the fresh methods it brings to an otherwise heavily researched subject. It is hoped that this perspective will complement the existing literature, and will be expanded in subsequent demographic studies of the available data, thereby contributing to a better understanding of the massacres, their causes, and their consequences.
Literature Review
The killings of 1965–66 have been studied in a variety of disciplines, including anthropology, history, and political science. The works that inform this study include Cribb (Reference Cribb1990a, Reference Cribb2000, Reference Cribb2001a, Reference Cribb, Wessel and Wimhöfer2001b); Crouch (Reference Crouch1978); Fealy (Reference Fealy2010); Fealy and McGregor (Reference Fealy, McGregor, Kammen and McGregor2012); Geertz (Reference Geertz1960); Hearman (Reference Hearman2010, Reference Hearman, Kammen and McGregor2012); Hefner (Reference Hefner1990); Jay (Reference Jay1963); Jenkins and Kammen (Reference Jenkins, Kammen, Kammen and McGregor2012); Kammen and McGregor (Reference Kammen and McGregor2012); Kammen and Zakaria (Reference Kammen and Zakaria2012); Lyon (Reference Lyon1970); Melvin (Reference Melvin2014); Ricklefs (Reference Ricklefs2012); Robinson (Reference Robinson1995); Roosa (Reference Roosa2006, Reference Roosa2016); and Sulistyo (Reference Sulistyo1997). Cribb (Reference Cribb, Wessel and Wimhöfer2001b), for example, undertakes as systematic a study of anecdotal data as might be possible to provide a rich portrait of the events and to produce, on the basis of that analysis, estimates of the magnitude of the massacres with indications about geographic hotspots. He examines intercensal population growth rates for the regencies of the province of East Java, “widely regarded as a major region of killing” (Cribb Reference Cribb, Wessel and Wimhöfer2001b, 86), and relates them to the degree of local political support for the PKI in the elections of 1957 that preceded the killings. Crouch (Reference Crouch1978) provides early evidence of reasons that the role of the Indonesian army in the violence in East Java may not have been as pronounced as it was in, say, Central Java. Among the important anthropological works that inform this study, Geertz (Reference Geertz1960) formalized the notion of cultural streams or aliran in Java, which formed the basis for inter-group conflict in the 1960s, as demonstrated by Jay (Reference Jay1963), Lyon (Reference Lyon1970), and Ricklefs (Reference Ricklefs2012). Building on this and related literatures, Hefner (Reference Hefner1990) provides a rich, compelling, and more nuanced portrait of the cultural and geographic fault-lines in a limited area of East Java and their role in precipitating the violence in varying degrees of intensity depending on local cultural milieux. A related and important line of research pursues the issue of culpability (Roosa Reference Roosa2016, 286–89). Kammen and McGregor (Reference Kammen and McGregor2012) edited a collection of thematically and locally oriented works on the violence, which includes studies of the role played by a key actor in the violence in East Java, the politico-religious Nahdlatul Ulama party (Fealy Reference Fealy2010; Fealy and McGregor Reference Fealy, McGregor, Kammen and McGregor2012), and the nature of the violence in the Blitar regency of East Java (Hearman Reference Hearman, Kammen and McGregor2012). In the absence of action from the army in parts of East Java, for example, “leaders of Ansor decided to take the initiative” (Crouch Reference Crouch1978, 147). A number of studies have also emphasized the role of the Indonesian army in the violence in Central Java (Crouch Reference Crouch1978; Jenkins and Kammen Reference Jenkins, Kammen, Kammen and McGregor2012; Roosa Reference Roosa2006), Bali (Robinson Reference Robinson1995), and Aceh (Melvin Reference Melvin2014).
Given the methodological scope of the above projects, however, the killings of 1965–66 are analyzed either in a geographically limited manner, with emphasis on those events and regions for which anecdotal evidence is available or, when geographically broad in scope, using methods that do not systematically penetrate to geographically disaggregated units such as regencies (kabupaten) or districts (kecamatan). Such methods, while valuable for the specific uses for which they have been deployed in the above works, cannot provide a comprehensive picture of events at the provincial or national level that equally weights the experiences of all regions. As a result, in their descriptions of the geographic scope of the killings, they are vulnerable to the “Streetlight Effect,” a form of observational bias that occurs when a study focuses on a limited set of available evidence to shed light on a problem whose scope is broader than that illuminated by the limited evidence being examined. Finally, because of their focus on the killings, without exception, they do not provide a treatment of the phenomenon of systematic migration that this analysis demonstrates was likely as significant as the killings that drove it.
The present article advances the above literature by providing, for the first time, a systematic treatment of demographic and geographic aspects of the violence, which allows for comparisons across all of the kabupaten of East Java based on figures that have been derived using a uniform method. In doing so, it addresses important questions about the scale of the killings viewed through a new lens and highlights new phenomena, such as migration, that have received little or no attention in the literature to date.
Data
The data used in this study are drawn from two different sources. The first is the three population censuses of Indonesia, conducted in 1961, 1971, and 1980, that are closest in time to the massacres (Biro Pusat Statistik 1962, 1971–78, 1974; Kantor Statistik Propinsi Jawa Timur 1982). These data are used to estimate population trajectories for the regencies of East Java, thereby generating estimates of the “missing” population at the regency level. After the estimates have been generated, the findings are interpreted using the body of available anecdotal data, collected from various sources in the anthropological, historical, and political science literatures, to confirm and generalize some of the phenomena highlighted in them and, where there are new statistical findings or discrepancies between them and the anecdotal material, to highlight and attempt to understand possible reasons for these findings and discrepancies.
Prior to the analysis, an understanding of the three censuses from which the data are drawn is necessary. These censuses were conducted on October 31, 1961; September 24, 1971; and October 31, 1980, respectively. The 1961 census was the first to be conducted in independent Indonesia (Bhatta Reference Bhatta1961; Biro Pusat Statistik 1962; Domschke and Goyer Reference Domschke and Goyer1986; Widjojo Reference Nitisastro1970, chap. 10), the preceding census having been conducted in 1930 during the late colonial era (Departement van Landbouw 1933–36).
For the 1961 census, interim results were published, which were then improved to produce revised but still interim results. These revised results have been widely used by demographers to study trends in Indonesia's population in relation to the 1971 and later censuses (see, e.g., Hugo et al. Reference Hugo, Hull, Hull and Jones1987, 119, 136, 246, 248; Quick Reference Quick1979). Because the 1961 census was conducted during a time of turmoil, complete and final results for all of Indonesia were not published at the time. The data for Java are considered to be among the more comprehensive, and final results were prepared for Jakarta, East Java, and Yogyakarta, though those for the latter two regions were not published at the time (Domschke and Goyer Reference Domschke and Goyer1986, 649), and were released as part of a more comprehensive set of provincial-level reports in 1980 (Pusat Penelitian dan Studi Kependudukan 1980). This study uses the figures from this last publication, reported at the regency level. The 1971 and 1980 censuses were conducted in times of relative stability, and the final results, which were published, are also used in this study to complement the data from the 1961 census (Biro Pusat Statistik 1974; Domschke and Goyer Reference Domschke and Goyer1986; Kantor Statistik Propinsi Jawa Timur 1982).
A common measure of the accuracy of a census, under-enumeration (or under-counting of people, leading to lower-than-actual population totals), was estimated at 5.9 percent for the 1961 census, 4.9 percent for the 1971 census (Quick Reference Quick1979), and 3.1 percent for the 1980 census (United States Bureau of the Census 1983, 223). For want of better data, demographers have used data from these three censuses in combination in order to analyze population trends in Indonesia. Notably, the under-enumeration estimates for the 1961 and 1971 censuses were calculated without taking into account the one-time downward adjustment to the population during the time of the killings (Quick Reference Quick1979, 29–31); hence it is not possible to ascertain whether adjustment of the results for under-enumeration using those estimates will improve the quality of those data. Out of an abundance of caution, however, an alternate set of population loss estimates was also computed by adjusting population figures upward to take the under-enumeration into account. The key results using these alternate population figures were similar to those presented in this study, and are therefore not presented here.
Finally, because a few major changes in the boundaries of the regencies of East Java occurred during the 1961–80 period, the population data from the three censuses were adjusted to reflect areas that were uniform and therefore comparable over time.Footnote 1 The benchmark census for the definition of the regencies of East Java is 1971, and adjustments are made to the census data for 1961 or 1980 as necessary.
Methods
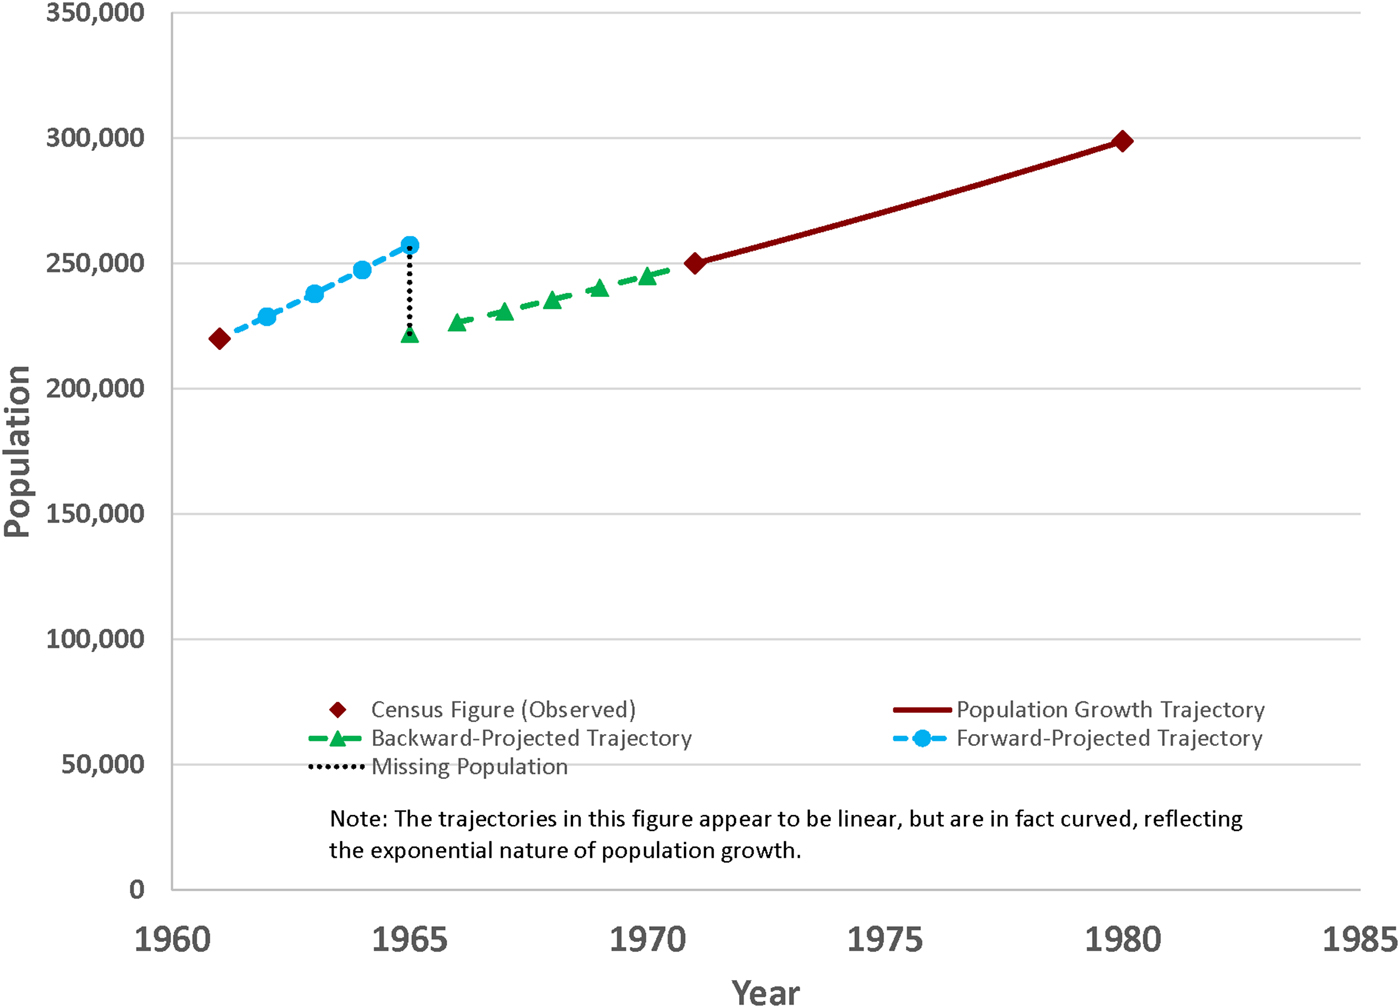
This study uses the population loss method for estimating a one-time population shock, defined as a break in an otherwise smooth population growth trajectory, using census data (Chandra Reference Chandra2013; Chandra et al. Reference Chandra, Kuljanin and Wray2012; Davis Reference Davis1951). Briefly, this method involves estimating population loss as the discrepancy between the “expected” population, estimated using a trajectory calculated with census data from before the shock, and the “observed” population using a trajectory calculated with census data from after the shock (see figure 1). These two population trajectories can be extrapolated forward and backward respectively to the time at which the shock occurred, producing discrepant (or similar) estimates of the “expected” (based on the pre-shock trajectory) and “observed” (based on the post-shock trajectory) populations at the time of the shock. The difference between the “expected” and the “observed” population is the number of “missing” or, where there is a one-time increase in the population, the number of “surplus” people. This method is suited for the analysis of data that are collected over intervals of time, such as those from the three population censuses of Indonesia. Further details of the computations are presented in the technical appendix at the end of this article.
Computation of population loss from the 1965–66 massacres.

The availability, for each regency, of only three observations on population, one corresponding to each of the three censuses in 1961, 1971, and 1980, necessitates a number of assumptions about population growth in order to estimate the one-time population change attributable to the 1965–66 killings. The first is that, for each regency, there were no other major one-time intervening events that significantly disrupted the population growth trajectory. In other words, with the exception of the one-time break in the population growth curve in 1965–66, shown in figure 1, there are no significant breaks in the trajectory between 1961 and 1980. Second, the population growth rate between 1971 and 1980 is constant and is equal to the population growth rate calculated using the census observations for 1971 and 1980, as described above. A third assumption is about the population growth rate before 1971. A simple version of this assumption would be to set the pre-1971 population growth rate equal to the post-1971 population growth rate, and to calculate the population in late 1965 by growing the population observed in 1961 at this rate. However, the vast preponderance of the literature (Cho et al. Reference Cho, Feeney, McDonald, Mamas, McNicoll, Singarimbun, Suharto, Suyono and Lapham1987, 8; McNicoll and Mamas Reference McNicoll and Made Mamas1973; McNicoll and Singarimbun Reference McNicoll and Singarimbun1986, 47; Poedjastuti Reference Poedjastuti1987, 26; Quick Reference Quick1979, 7) demonstrates a large drop in fertility in East Java after 1971 compared to that before 1971 as the result of a number of factors including but not restricted to the concerted Suharto-era family planning program (Hull Reference Hull and Hull2005; McNicoll and Singarimbun Reference McNicoll and Singarimbun1986), stepped-up transmigration (Hugo et al. Reference Hugo, Hull, Hull and Jones1987), and the post-1965 economic stabilization. In East Java, fertility decline was particularly pronounced (McNicoll and Singarimbun Reference McNicoll and Singarimbun1986, figure 3, 47). Added to the fact that mortality rates dropped more slowly than fertility rates during this time period (Quick Reference Quick1979, 7) and that average annual net migration stemming from the transmigrasi (transmigration) program was higher during the 1970s than it was in the prior decade (Swasono Reference Swasono, Swasono and Singarimbun1986), this phenomenon suggests that the pre-1971 population trajectory should show a higher growth rate than the post-1971 trajectory. In figure 1, this is shown by the steeper slope of the pre-1965 portion of the trajectory compared with the post-1965 portion of the trajectory. The same adjustment was made for the 1965–71 portion of the trajectory (not shown in figure 1). Note that the absence of a second census before 1965Footnote 2 precludes the estimation of a separate pre-1965 population growth rate using pre-1965 census data. Based on the estimates provided in some of the above-cited works (e.g., Poedjastuti Reference Poedjastuti1987, 26; Quick Reference Quick1979, 7), therefore, an annual pre-1971 growth rate that is uniformly 0.2 percent higher than that observed for the post-1971 period was used across all regencies. It should be noted that the choice of the pre-1971 population growth rate will influence the estimate of population loss by tilting the two pieces of the pre-1971 population trajectory upward or downward, thereby increasing or decreasing the gap between the “expected” and “observed” populations at the time of the 1965 killings. The comparison across regencies will, however, be stable; a regency that shows a large loss relative to other regencies when the pre-1965 trajectory is steep will continue to show a large loss relative to other regencies even when the pre-1965 population growth rate is adjusted upward or downward uniformly across all regencies. In sum, the population loss estimates reflect the change in population unaccounted for by the growth trend and, to the extent that the assumptions of the model listed above hold, can be used as a proxy for the severity of the 1965–66 violence. As the results demonstrate, even under these strong simplifying assumptions about population growth in East Java, a compelling picture of the massacres emerges.
In this framework, the one-time change in population can be interpreted as the loss in population associated with the violence of 1965–66. While this change corresponds to the severity of population changes at the time of the killings, it comprises not only mortality (i.e., the killings), but also the two other fundamental drivers of demographic change, fertility and migration, and does not distinguish among these three key effects. It does, however, allow for and is robust to regional variations in steady ongoing demographic phenomena, such as constant in- or out-migration or a consistently lower or higher fertility rate in one regency compared to another. As will be shown, in some regencies, an unexpected one-time increase in population corresponding to the 1965–66 upheavals is observed, suggesting migration from other, perhaps more troubled, regencies. In this sense, this study emphasizes the migration impacts of the violence as much as it does the mortality effects, and a large one-time drop in population can be interpreted as an indication of the severity of the killings, because the associated migration and fertility impacts will likewise be negative and very likely reflective of the severity of the violence.
Results: The Geography of Demographic Change in 1965–66
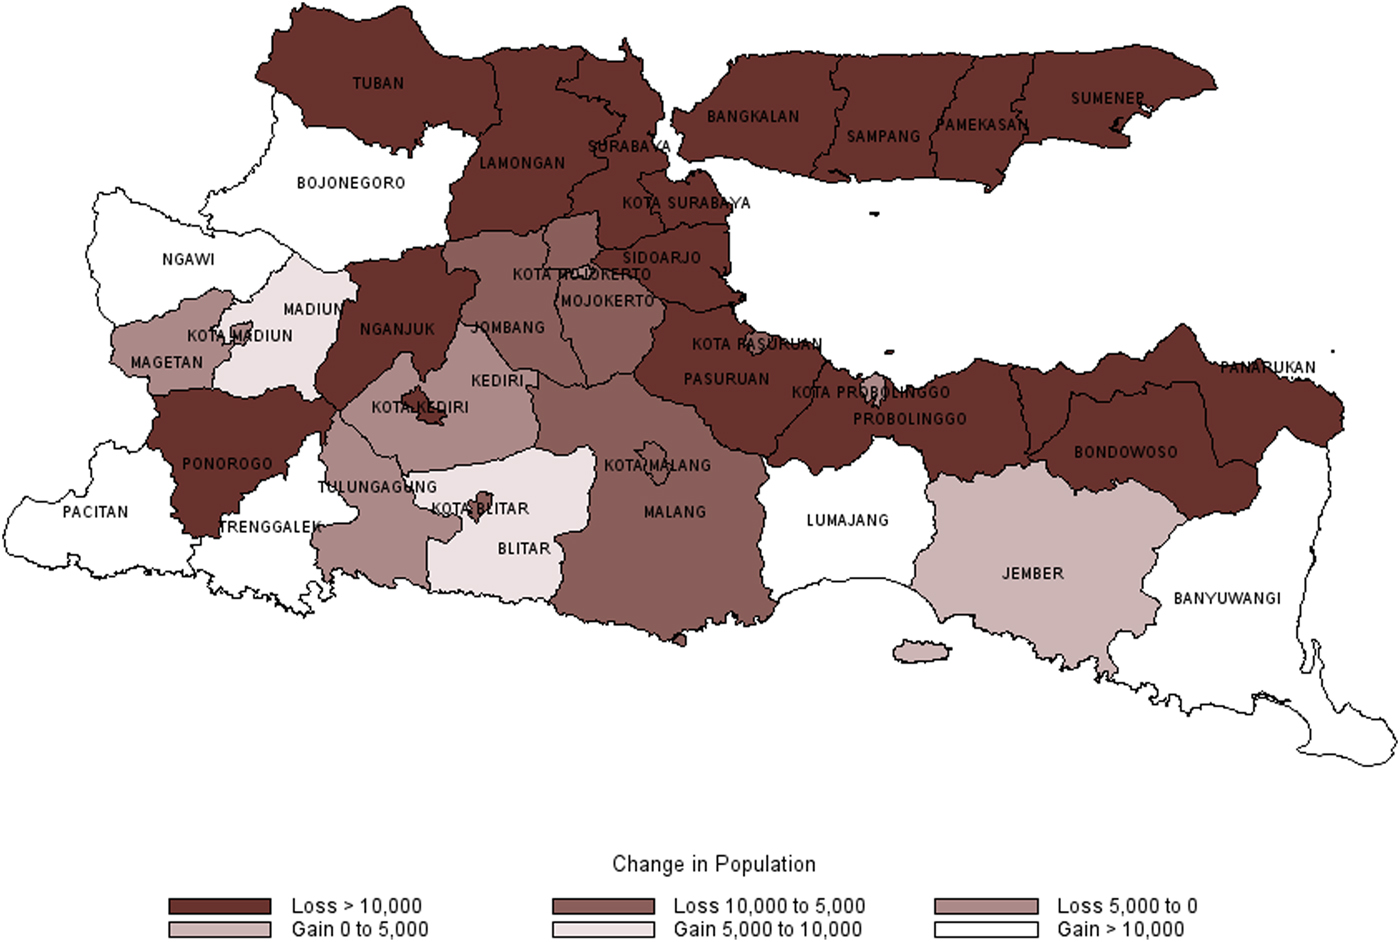
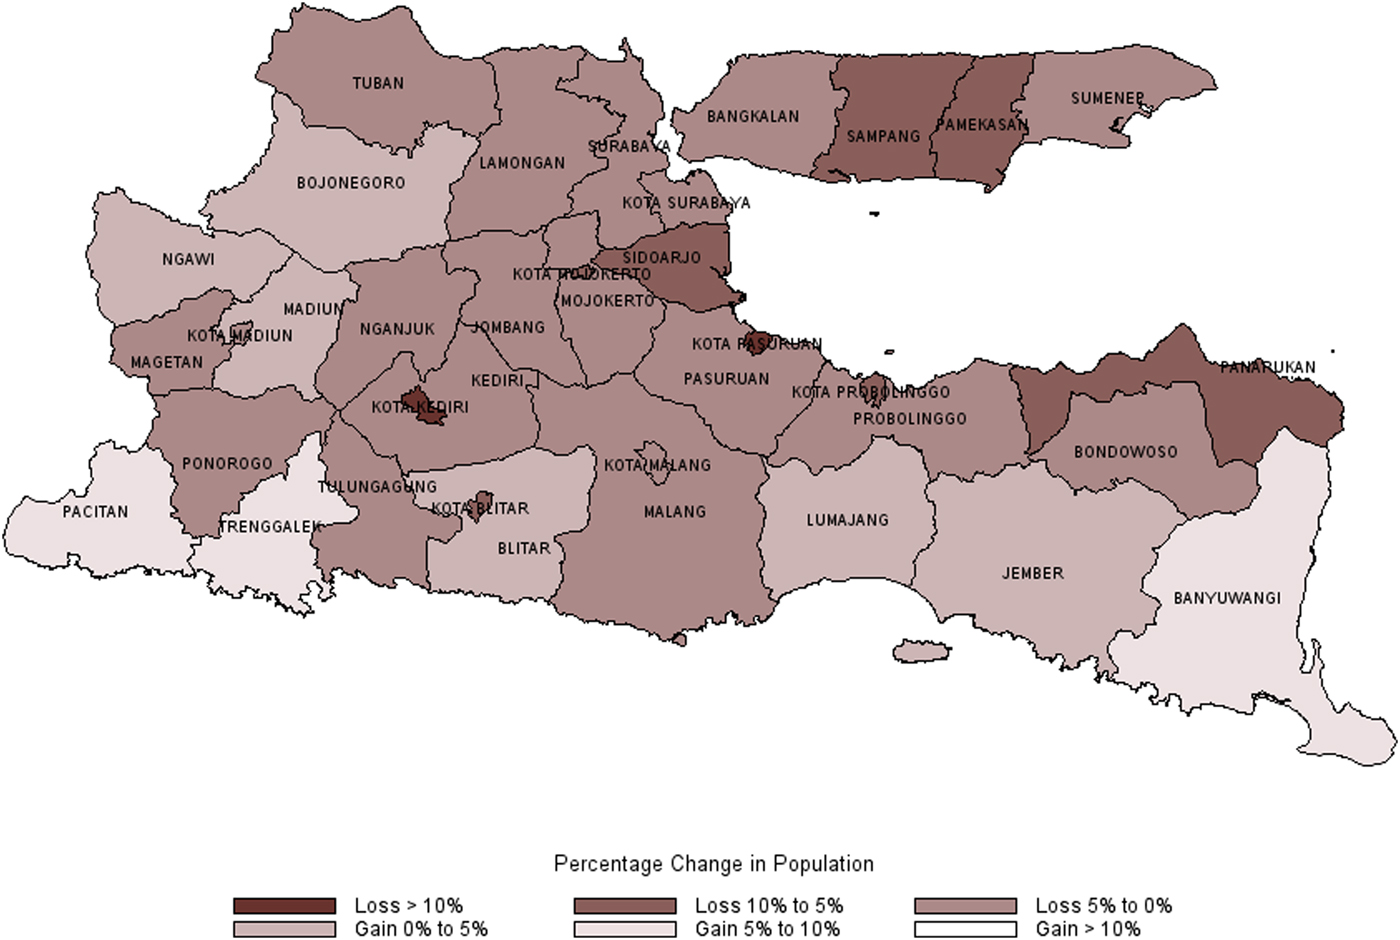
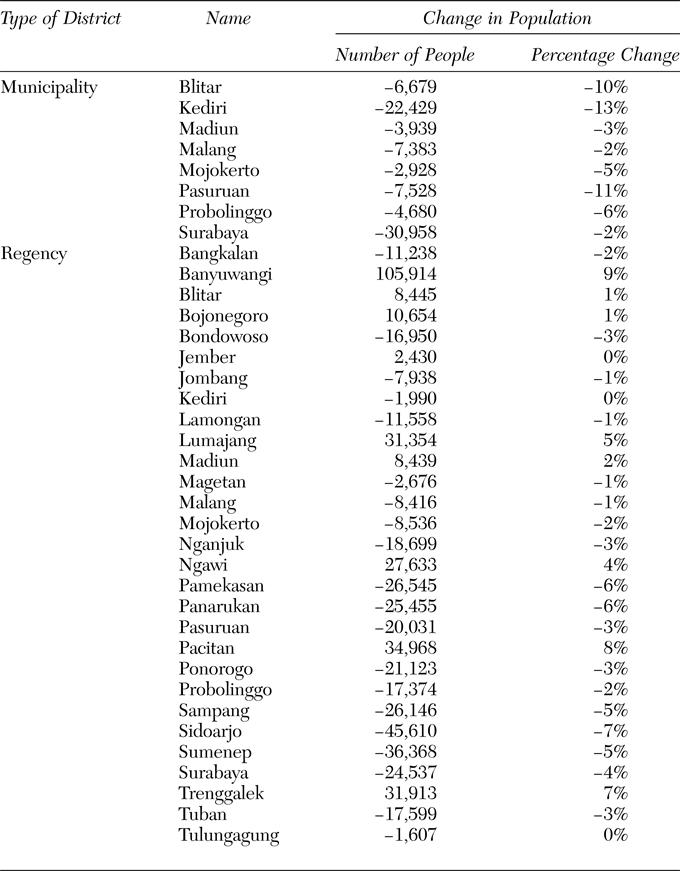
Table 1 lists the unaccounted-for change in population computed using the methods described above. The total estimated net population loss in East Java is 175,169, which is evenly split between the eight urban areas, which lost 86,524 people, and the twenty-nine rural areas, which lost 88,646 people. While the urban areas uniformly lost population, the rural areas reveal a much more mixed pattern, ranging from a gain of 105,914 people in Banyuwangi, on the far southeastern tip of Java, to a loss of 45,610 people in Sidoarjo, the rural regency abutting the city of Surabaya. In percentage terms, among the cities, Kediri, Pasuruan, and Blitar showed the largest declines in population, all in the vicinity of 10 percent. Among the rural regencies, the largest losses in percentage terms occurred in Sidoarjo, Pamekasan, Panarukan, Sampang, Sumenep, and Surabaya. Three of these regencies are located on the island of Madura, two border the city of Surabaya, and one is on the eastern edge of Java. All six regencies are in the northeastern coastal region of the province. The maps in figures 2 and 3 provide clear evidence that, in terms of population loss, Madura and the northeastern coast of East Java were far more severely affected than the interior central and southern regencies of the province.
Estimated change in population attributable to 1965–66, East Java.

Percentage change in population attributable to 1965–66, East Java.

Estimated population change by municipality or regency in 1965–66.

Political Aspects of the Killings
How are we to explain these patterns? In East Java, we know that the killings were, for the most part, perpetrated by two sets of forces—the Indonesian army and supporters of the key politico-religious party, the NU, and its youth wing, Ansor, in particular (Fealy and McGregor Reference Fealy, McGregor, Kammen and McGregor2012). In areas where the army was hesitant to take action and the NU and Ansor maintained a strong presence, they initiated the violence and, in some places, even had to be restrained by the army (Crouch Reference Crouch1978; Fealy and McGregor Reference Fealy, McGregor, Kammen and McGregor2012). In other locations, where the NU had a weaker presence, the army orchestrated the killings in a more systematic, targeted, and organized manner, often with support from non-local NU and Ansor members (Hefner Reference Hefner1990).
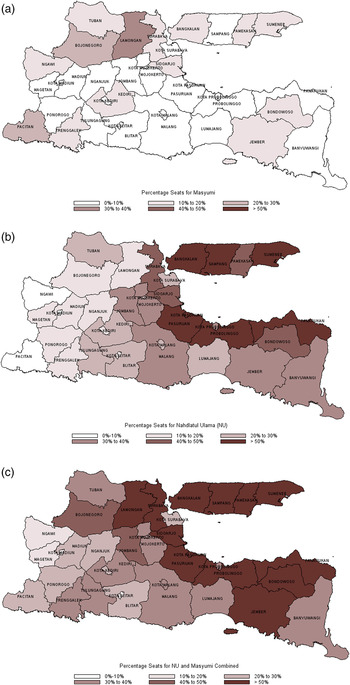
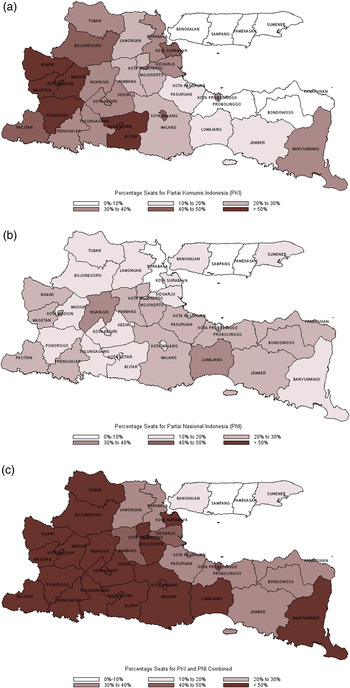
Following the above characterization, in order to examine the extent to which the killings and related demographic change were related to the political leanings of residents in the various regencies, maps were plotted showing the support for the four key political parties in East Java in the 1957 election, the last election preceding the violence. Figures 4 and 5 are regency-level maps of the shares of seats in the parliament won by the two key politico-religious parties (the NU and Masyumi; see figure 4) and the two other major political parties, (the PKI and the PNI; see figure 5). These maps, and in particular figure 4, show a striking similarity with the maps in figures 2 and 3, suggesting an association between the severity of the violence and the local political milieux.
Percentage of seats won by Masyumi and the Nahdlatul Ulama in the 1957 election, East Java.

Percentage of seats won by Partai Komunis Indonesia and Partai Nasional Indonesia in the 1957 election, East Java.

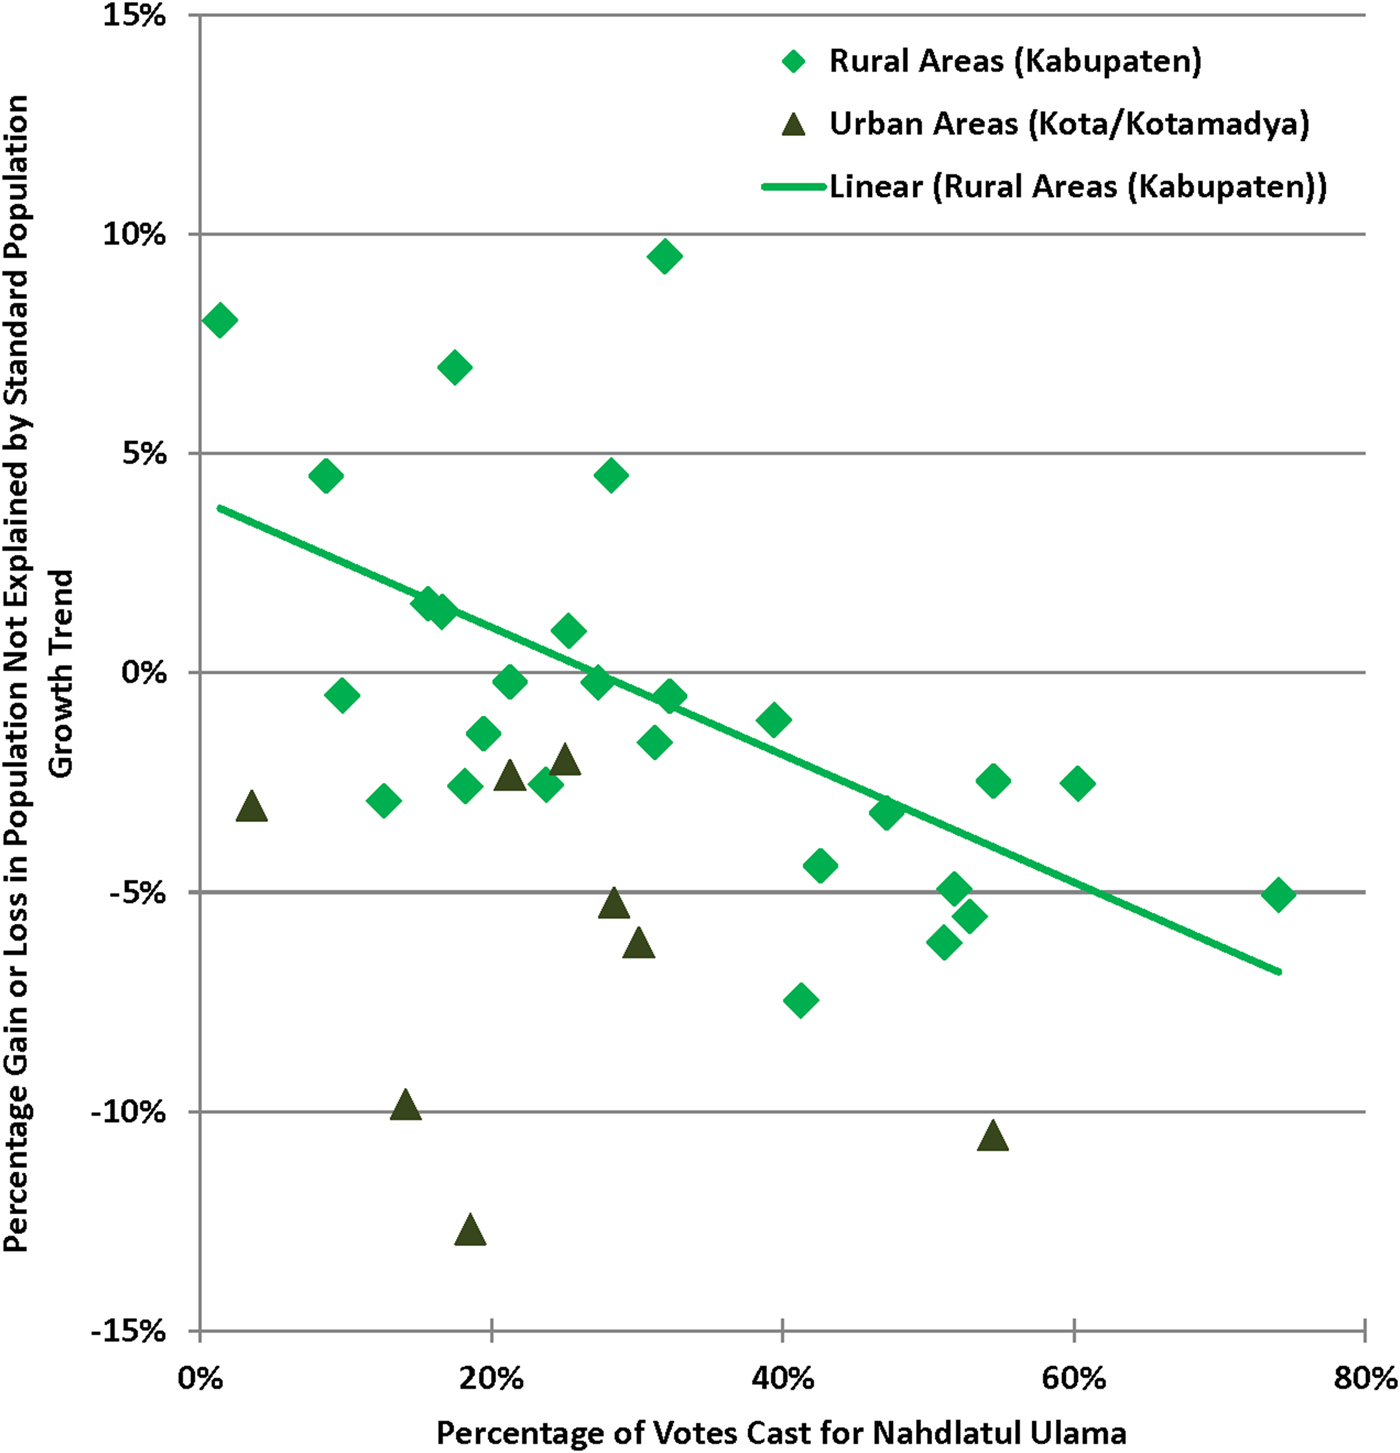
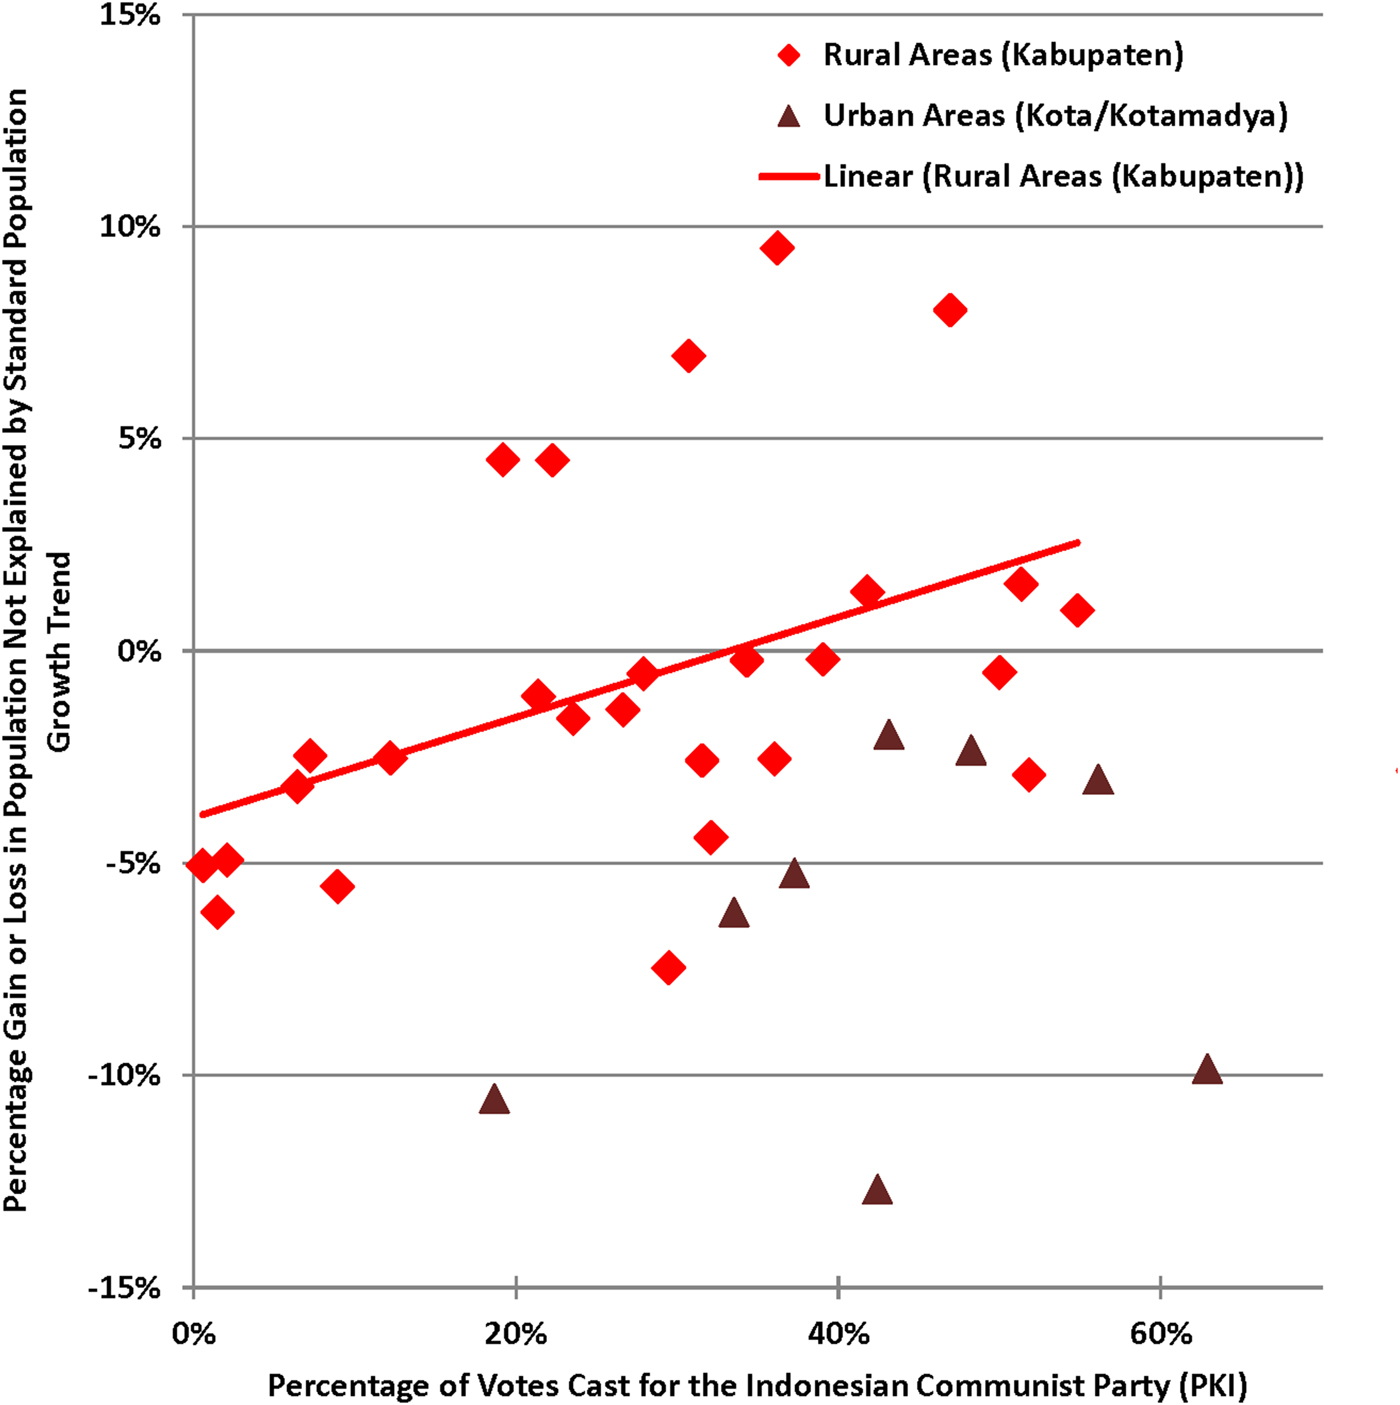
In order to formally test for such an association, first, graphs showing the relationship between the share of the vote in the 1957 election obtained by the NU and PKI parties and the severity of the violence were plotted, revealing a clear phenomenon (see figures 6 and 7). Regencies in which the vote share for the NU in 1957 was higher tended to have larger population declines (right side of figure 6) than regencies in which the vote share for the NU was lower (left side of figure 6). The converse applies for the relationship between estimated population loss and the vote share won by the PKI (figure 7).
Percentage change in population versus political support for the Nahdlatul Ulama.

Percentage change in population versus political support for Partai Komunis Indonesia.

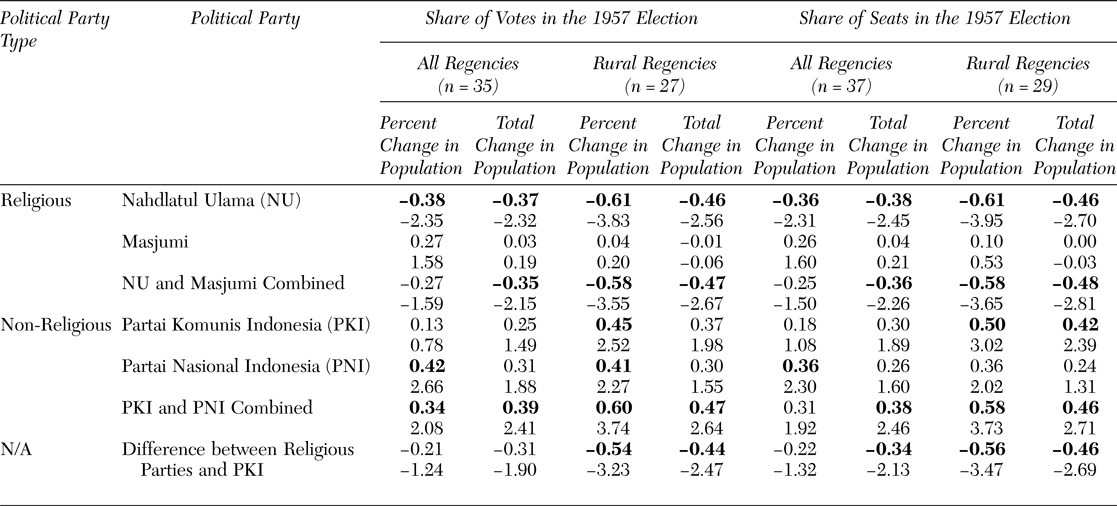
To confirm this phenomenon, statistical tests on the correlations between the vote shares of the different parties and the size of population loss across regencies were conducted. Table 2 shows the correlations along with the results of these tests. The most striking associations are between political support for the NU and the unaccounted-for decline in population and, conversely, combined support for the nonreligious parties, the PKI and the PNI, and the unaccounted-for increase in population. In other words, the phenomenon of regencies in which political support for the NU was high (and that for the PKI and the PNI was low) tending to also be regencies that saw larger declines in population, and regencies in which political support for the NU was low (and that for the PKI and the PNI was high) tending to also be regencies that saw larger increases in population, is not accidental, but rather a systematic and statistically defensible phenomenon. Taken together, these results demonstrate the association between political affiliation and the population changes associated with the violence, whether through killing or migration, in the regencies of East Java. It should be kept in mind that, even though the PNI was not a politico-religious party, elements of its membership were involved in the killings, especially in the neighboring province of Central Java where its support base was strong and in overt competition with the PKI. However, the point here is that support for the PKI and the PNI is indicative of a politico-cultural milieu that was different from that found in areas where support for the NU and Masyumi was heavy.
Statistical associations between support for political parties in the 1957 election and demographic change in 1965–66.

The unit of analysis is the regency. Data on votes and vote shares were not available for two rural regencies, Bangkalan and Jember, hence the number of observations for seat shares exceeds the number of observations for vote shares by two. Numbers in bold font indicate correlations that are statistically significant at the 5% level. For example, the value ”−0.38” in the upper left corner of the table demonstrates that regencies in which a larger share of the vote went to NU tended to see larger unexplained one-time declines (hence the minus sign) in population in 1965–66. The bold font indicates that this statistical relationship is unlikely to be one that occurs by chance.
Discussion
The findings of this study underline the geocultural phenomenon identified by Hefner (Reference Hefner1990) for Pasuruan regency and demonstrate that the phenomenon was widespread across the province of East Java. Briefly, Hefner found that the regency of Pasuruan in the 1960s could be divided into two broad geocultural regions, the low-lying northern coastal region and the southern Tengger Highlands region. During the violence of 1965–66, the northern coastal regions, which were populated by larger numbers of NU supporters, whose members harbored strong antipathy toward those of the PKI, bore the brunt of the massacres. The southern mountainous regions of Pasuruan and its neighboring regencies, which were settled by a less orthodox and more “Hinduized” and religiously syncretistic “Javanist” (or kejawen) population, and tended to lean politically away from the Islamist orthodoxy prevalent on the north coast, while still affected by the violence, were far more peaceful. Hefner (Reference Hefner1990, 193) described the development of this political cleavage in post-independence Pasuruan between the two regions as follows: “The Muslim lowlands became the strongest center in all of Java for Nahdlatul Ulama, the party of Muslim traditionalists. The Javanist highlands, by contrast, were dominated by the Indonesian Nationalist Party (PNI) and, to a lesser degree, the Indonesian Communist Party (PKI).” Later, he continued, “Orthodox Muslims were drawn to Masyumi and Nahdlatul Ulama, and Javanists rallied around the Indonesian Nationalist Party (PNI) or the Communist Party (PKI),” and raised the importance in political discourse of “… the question of whether Indonesia should become an Islamic state (negara Islam)” (199).
Based on the findings of this study, Hefner's observations about Pasuruan can be extended to the island of Madura and much of East Java. The cultural and geographic variation that he described in Pasuruan applied to much of the province, and was manifested more generally in a geocultural dichotomy between the island of Madura and the low-lying regencies of the northern and northeastern coasts of East Java on one hand and the more remote and mountainous regencies and the southern coast of East Java on the other. Of special note is that the population of Madura, to which Hefner traced the roots of some of the coastal politico-religious orthodoxy in neighboring Java, was uniformly and severely depleted during 1965–66 (see figures 2 and 3). This observation is borne out by Indonesia (1986, 139) which, in reference to the violence in Madura, had this to say: “Actions in this area have been more gruesome than those in other areas.” It is likely, therefore, that Hefner's geocultural dichotomy was associated with the relative severity of population loss in the NU-dominated Madura and northern plains regions as compared to the interior highlands, where the NU was less-well represented and the army likely played a qualitatively different role.
If we look more closely at the violence at the district (kecamatan) level, the dichotomous pattern of violence appears to be replicated, underscoring Hefner's geocultural dichotomy. Figure 8, which shows estimates of district-level population changes in 1965–66 for the combined regencies of Bojonegoro, Lamongan, and Tuban, demonstrates that districts that were closer to the coast of the Java Sea tended to see more violence than districts that were farther away from the coast. This map also shows a cluster of districts, centered on Kepoh Baru in Bojonegoro and surrounding it, to which refugees appear to have fled during the violence. It would be interesting to extend this study to the entire set of districts in East Java to identify pockets of population depletion and refuge across the province, which a regency-level analysis cannot do.
One-time percent change in population, 1965–66, Bojonegoro, Lamongan, and Tuban regencies.

A second pattern is the disproportionate drop in the population, in percentage terms, of some of the smaller cities of East Java, including Blitar, Kediri, and Pasuruan (see figure 3). In percentage terms, they lost more population than the neighboring rural regencies, suggesting a more intense pattern of violence in these smaller cities. Kediri and Blitar, which are frequently mentioned as key sites for the killings (see, e.g., Cribb Reference Cribb1990a; Young Reference Young and Cribb1990), in particular stand out, with percentage losses that are much (10 percent or more) greater than the losses in the neighboring rural regencies of the same names. While the largest city in the region, Surabaya, also experienced a loss, it was not as large as that in the smaller cities in percentage terms. Part of this may have been the result of the flight of people from the neighboring rural regencies, which were severely affected, into the city for refuge, a phenomenon that is also mentioned in the literature (Hearman Reference Hearman, Kammen and McGregor2012). It is possible that the higher density of population and better road infrastructure in the cities meant that it was easier for perpetrators to obtain information about and physical access to their victims. The contrasting findings for rural and urban areas need further study.
Another interesting phenomenon that these findings bring to light is the fact that not all regencies experienced losses in population. Some saw large one-time increases, which can only be explained by large-scale in-migration. So it is quite clear that, along with the violence and killing, a second major driver of demographic change in 1965–66 was migration, and the beneficiaries of in-migration were the interior or more remote regencies (Pacitan, Trenggalek, Jember, Lumajang, and Banyuwangi, for example) south of the northern coastal regencies (Pasuruan, Probolinggo, Panarukan, and Bondowoso, for example), where the most severe population depletions occurred (see figures 2 and 3). In line with Hefner's (Reference Hefner1990) geocultural dichotomy, these rural regencies served as safe havens for those fleeing from the violence in the northern coastal region. This broader phenomenon is also briefly described in Indonesia (1986, 145): “The places they have fled to are in the south, (Zuid [D: South] Besuki, Zuid Malang, Zuid Madiun, all the way to Central Java).” In this regard, the 105,914 population gain figure for Banyuwangi is noticeably larger than the gains in other kabupaten. According to a number of scholars, Banyuwangi saw significant violence (Center for Village Studies Reference Cribb1990; Fealy and MacGregor Reference Fealy, McGregor, Kammen and McGregor2012; Ida Bagus Reference Ida Bagus, Kammen and McGregor2012). Yet the data show an unusually large jump in population. But why might this have been the case? Reasons for this increase could have included economic (jobs in the plantation sector in Banyuwangi, for example) or political (attractiveness as a refuge, see below) “pull” factors or economic or political “push” factors from other areas. There are a number of indications that southern Banyuwangi may have been a safe haven for refugees. The first is that the region was explicitly identified by the regional army authorities as being a site where the PKI was regrouping (Semdam VIII Brawidjaja 1972, 285). The second is the Karangasem (or Cemetuk) incident, in which a group of PKI members massacred sixty-four NU supporters (Indonesia 1986, 137), suggesting that support for the PKI in the central and southern parts of the kabupaten was very strong. Indeed, Karangasem is mentioned as a “hideout for the PKI” in the aftermath of the October 1 assassinations (137).
Third, of all the kabupaten in the East Hook region of East Java, Banyuwangi was the only one where the PKI vote in 1955 and 1957 was close to that for the NU, all of the other kabupaten registering support for the NU that exceeded that for the PKI (see figures 4 and 5).
Fourth, linguistically, Banyuwangi is located in a region of strong Javanese influence, while its bordering kabupaten to the north and west were predominantly Madurese (see Salzner Reference Salzner1960, map 17), a cultural factor that Hefner (Reference Hefner1990) showed to be associated with political affiliation in his study of nearby Pasuruan.
Fifth, the southern districts of Banyuwangi are very remote, serving as the funnel-like “lands’ end” of eastern Java with the kind of rough terrain favored by PKI refugees in other parts of East Java, most notably South Blitar. Across the Bali Strait to the east lies the island of Bali, which, by many accounts (see, e.g., Cribb, Soe Hok Gie et al. Reference Cribb, Gie and Cribb1990; Robinson Reference Robinson1995), suffered a fate more violent even than that of East Java, and which also experienced the devastating eruption of Gunung Agung in 1963–64. So it is plausible that Banyuwangi received refugees from neighboring Bali to the east in addition to the neighboring regencies of Panarukan and Bondowoso (see figures 2 and 3). In such a scenario, large migrations from these areas would have overwhelmed any local decrease in population from violence, producing the pattern seen in the data. This is borne out by the district map of population change in Banyuwangi, which demonstrates that the large one-time gains in population indeed occurred in the southernmost and remote districts (see figure 9).
One-time percent change in population, 1965–66, Banyuwangi Regency.

Adding all of these factors up, it is not inconceivable that large numbers of residents of other kabupaten in the region and, perhaps, other kabupaten across Java would have viewed Banyuwangi as a safe haven and fled there. The findings of this study should be considered a starting point for the deeper investigation of phenomena such as the large jump in population in Banyuwangi with a view to linking (or delinking) them from the political events of the time.
In interpreting the results of the analysis, it should be noted that the estimate of the decline in population due to the massacres is actually the combination of the effects of mortality, fertility, and migration. The turbulence of the anti-communist violence would have resulted in not only a spike in deaths in the worst-affected areas, but also, very likely, a dip in births and significant migration, especially away from locations where the violence was particularly severe and into locations where refugees had a sense that they would be relatively safe. Indeed, there is anecdotal evidence that such internal (i.e., regency-to-regency) migration was occurring (Hearman Reference Hearman2010, Reference Hearman, Kammen and McGregor2012). Similarly, mean annual transmigration for the period of 1971–80 was higher than that for the period of 1961–71 (Swasono Reference Swasono, Swasono and Singarimbun1986). However, to the extent that the outflow due to transmigration can be considered to be steady within each of these two different periods and that deviations from such a steady trend comprised a fraction of total population, the demographic model used to generate estimates of one-time population changes associated with the 1965–66 killings is already adjusted for transmigration. Additionally, to the extent that in-migration from Bali may have affected the demographics of neighboring regencies in East Java, such as Banyuwangi, the province of East Java should not be considered a demographically closed system, raising the possibility that part of the variation in population in the province could be explained by net in- or out-migration across (rather than within) provincial boundaries.
A final form of “migration” was the movement of large numbers of political prisoners (Kammen and Zakaria Reference Kammen and Zakaria2012). By 1977, this number had fallen from a high of over 500,000 to between 55,000 and 100,000 across all of Indonesia (Amnesty International 1977, chap. 5), a small fraction of which would have been from East Java. The census counted prisoners as part of the institutionalized population (Central Bureau of Statistics, Minnesota Population Center 2017, 21). Population anomalies, visible in a few rural kecamatan that housed large prison populations (in the low thousands), suggest that the censuses counted prisoners as being resident in the kecamatan in which the prison was located. In the majority of cases, however, because prisons were located in cities, the anomalies are not visible due to the significantly larger urban populations and the relatively smaller numbers of prisoners.
The estimates, therefore, reflect a combination of one-time (i.e., 1965–66-associated) excess mortality, possibly depressed fertility, and inter-regency or inter-province migration. Overall, however, the results suggest that the deaths in East Java were likely in excess of 150,000, based on an estimated total loss of 175,169. Viewed in historical and comparative perspective, this finding is not unreasonable. Numerous anecdotal accounts of mortality, including those in Cribb (Reference Cribb, Wessel and Wimhöfer2001b), put the mortality for all of Indonesia in the hundreds of thousands and, if the consensus is taken, about 500,000. If East Java was one of the three worst-affected provinces (the other two being Central Java and Bali), then the figure of 150,000, which computes to a number about 15,000 shy of one-third of the consensus overall figure, is plausible. Keeping in mind that this figure is dependent on the choice of the population growth rate for the pre-1971 period, however, it should be not be interpreted as an exact measure of the scale of population loss. As is mentioned elsewhere in this article, the estimated changes in population across kecamatan relative to one another, which do not vary depending on the choice of this population growth rate, should be considered to be more robust than the individual population loss estimates themselves.
The geographic findings likewise yielded some insights that were expected, while others were quite unexpected. The literature on political polarization in Java based on sociocultural lines has, from the outset, emphasized fault-lines based on aliran, or cultural streams (Feith Reference Feith, Anderson and Kahin1982; Geertz Reference Geertz1960; Jay Reference Jay1963; Lyon Reference Lyon1970). The more orthodox santri, who formed the dominant aliran on the low northern coastal plains of East Java and tended to support the Nahdlatul Ulama party and, prior to its banning in 1960, the Masyumi party, were pitted against the weaker aliran, the abangan or kejawen, who dominated the interior highlands and more remote southern regencies and formed a more liberal and pro-PKI and PNI constituency.
The findings of this study demonstrate the link between the Nahdlatul Ulama (and its Ansor youth wing in particular) and the violence (Fealy and McGregor Reference Fealy, McGregor, Kammen and McGregor2012; Hefner Reference Hefner1990), providing evidence of a systematic geographic association between their political strength and the severity of population loss. Rural regions where PKI support was high (and that for the NU was relatively low) became refuges for migrants. In addition to emphasizing the importance of migration during the killings, a phenomenon that we would expect but that has nevertheless been neglected because of the singular focus on the killings themselves, this finding suggests that Geertz's (Reference Geertz1960) characterization, which has been subjected to a variety of criticisms, stands up to statistical scrutiny as a robust framework within which to understand one of the most important schisms in eastern Javanese society.
In sum, this study presents a new portrait of the 1965–66 anti-communist killings using a quantitative and analytically systematic framework. Because relying on anecdotal information, as most prior studies of this phenomenon have done, can produce observational bias through a “streetlight effect,” the present study contributes a perspective that complements the earlier rich literature on the killings. Specifically, the association between changes in population at the regency level and support for the NU is consistent with the anecdotal literature on specific locations in East Java, and generalizes them across the province.
This study has a number of limitations. For one, its methods have been motivated by the absence of reliable birth and death data, hence the use of an inferential technique using aggregate population data. But the absence of such data also makes it difficult to verify the results presented here. It is difficult to reliably separate the effects of depressed fertility or in- or out-migration from other causes, such as the starvation that may have resulted from the massacres or from excess mortality caused by the killings themselves (Cribb Reference Cribb, Wessel and Wimhöfer2001b). In addition, the absence of reliable age-specific population counts or mortality data during the 1960s and 1970s precludes robust analysis using age cohorts and life tables such as those used to study similar events in other parts of Southeast Asia (Heuveline Reference Heuveline1998; Merli Reference Merli2000). Finally, there is the issue of reliability of the population count data themselves. While these data are clearly more accurate than some of the other data collected by the Indonesian government at the time, they possess their own inaccuracies, and the results of this study should be interpreted in the appropriate light.
Given the nature of the data used in this study, it also cannot resolve the ongoing debate about the degree to which the NU and Ansor acted independently of the Indonesian army and the extent to which the army drove them to perpetrate the killings (Roosa Reference Roosa2016). As discussed above, a number of scholars have assigned a significant and, in many cases, leadership role to the Indonesian army in perpetrating the killings in some regions of Java (Hefner Reference Hefner1990) and other parts of Indonesia (Melvin Reference Melvin2014). While there is a clear statistical association between the strength of support for the NU and the killings, the methods used in this study also cannot establish causality between the two phenomena. Finally, while the findings comprise a generalization of phenomena across the province of East Java, the patterns observed in this province should not be generalized across all of Indonesia or even Java without careful consideration of the diverse local forces at play in other regions.
This study has brought fresh methods of statistical analysis to Indonesian population statistics to estimate the regional distribution of the toll that the massacres of 1965–66 took on the population of the province of East Java, Indonesia. Given the magnitude of these events and the importance of Indonesia, the world's fourth most populous country, in world demography, it is hoped that future research will delve into the details of this phenomenon, including variations across Java and their correlates, and the reasons for the differences between the experiences of the different regencies and provinces of Java and Indonesia.
This study also presents a framework for future studies. In addition to filling out the map of Indonesia to encompass the other severely affected provinces, including but not restricted to Central Java and Bali, similar research can be done at the district level (see figures 8 and 9), and can help to pinpoint possible locations where the violence occurred. Indeed, with the proper data, such analysis can be conducted all the way down to the village (desa) level.
In conclusion, the hope is that this study and subsequent ones of this nature will inform and advance the objectives of justice for and memorialization of the many innocent people who perished in this tragic episode in Indonesian history by enhancing our understanding of it. An equally important objective will be met if it can facilitate the reconciliation and healing process advocated by many both within and outside Indonesia. The words of Cribb (Reference Cribb, Wessel and Wimhöfer2001b, 94–95), however, caution us that
… a different moral issue is paramount: given that we need numbers to comprehend mass killing, numbers based on fragile assumptions should be presented tentatively, often prefixed by >perhaps<, and we should bear in mind the serious moral consequences of being wrong: if we overstate the number killed we commit blood libel on those we accuse, if we understate it we deprive victims even of the recognition that they died. Only with these implications humbly in mind should we begin the task of estimation.
Given the seriousness of the phenomena being studied, therefore, the reader should use an abundance of caution and understand these results for what they are and are not—findings based on assumptions that may be incorrect even if they seem reasonable, and qualitative and quantitative data that may have inaccuracies even though they are the best that are available. As Kammen and Zakaria (Reference Kammen and Zakaria2012, 452) aptly put it, “it would be a mistake to throw away the best available data simply because it is not ideal data.”
Acknowledgments
I wish to acknowledge support from the National Science Foundation (NSF grant 1244672) and the Frank and Adelaide Kussy Scholarship Fund in James Madison College at Michigan State University, as well as valuable comments from or conversations with Robert Cribb, Greg Fealy, Robert Hefner, Douglas Kammen, Thomas Pepinsky, six anonymous reviewers, and attendees at the Gatty Lecture Series hosted by the Southeast Asia Program at Cornell University and a panel at the Association for Asian Studies annual conference in Seattle, Washington, in 2016. The contents of this article do not reflect the views of any of the above-mentioned institutions or people.
Appendix: Major Boundary Changes in East Java Province Between 1961 and 1980
In order for the computations in this study to provide an accurate picture of the demographic impact of the 1965–66 killings, it is necessary that the boundaries of the regencies of East Java be held constant across the three censuses to ensure comparability over time. For analytic purposes, the regency boundaries current as of the 1971 census were used as the reference boundaries, and village-level population data from the 1961 and 1980 censuses were used to add to or subtract from the corresponding regency-level population figures in order to make them comparable across censuses.
The body of law governing boundary changes at the regency level is maintained by the Interior Ministry of the Government of Indonesia (Kementerian Dalam Negeri). During the 1961–80 period, five kecamatan—Wonocolo, Sukolilo, Rangkut, Tandes, and Karangpilang—were transferred from the Surabaya Kabupaten (regency) to the Surabaya Kota (city) under Undang-Undang 2 of 1965 (Ichsan Reference Ichsan1965). Therefore, the population figures of 1961 were computed to reflect the above kecamatan (sub-districts) as belonging to the Surabaya Kota and their population was deducted from the 1961 population count for the Surabaya Kabupaten. Additionally, Peraturan Pemerintah 14 of 1976 designated the city of (or Kota) Jember as an administrative entity by reconfiguring some of the kecamatan in the Jember Regency (Sudharmono Reference Sudharmono1976). However, because the reference entity as of the 1971 census was the territorial aggregate of these two regions (i.e., Kota Jember plus Kabupaten Jember) and the boundary of that aggregate was not modified, no adjustments were made to the data for the regency-level analysis.
Technical Appendix
Because there are only three relevant census observations for each of the twenty-nine regencies and eight cities in East Java, rather than use the stochastic estimation strategy of Chandra et al. (Reference Chandra, Kuljanin and Wray2012), involving panel data models, a “deterministic” method for computing population loss was employed. In the deterministic method, for each regency, the data from the 1971 and 1980 censuses are used to calculate a rate of population growth for that regency as follows:
 $$P_{t2} = P_{t1}*e^{r(t2- t1)} $$
This is the standard exponential population growth model, widely used by demographers. Here, P t2 represents population at time t2 (in this case, the date of the 1980 census), P t1 represents population at time t1 (in this case, the date of the 1971 census), r is the rate of population growth per unit time (in this case, the daily rate of population growth), and e is the base of the natural logarithm. Taking natural logarithms of both sides of the above expression yields
 $${\rm ln}P_{t2} = {\rm ln}P_{t1} + r(t2-t1)$$
In the case of the two immediate post-1965 censuses of Indonesia (1971 and 1980), for each regency or city, we know P t2 , P t1 , t2, and t1. Therefore we can compute the rate of population growth r for that regency. Using this computed growth rate, we can (1) extrapolate the population growth trajectory backward from the population as of the 1971 census to the beginning of 1966 to obtain the “observed” population based on the post-massacre growth trajectory, and (2) compute the “expected” population based on a pre-massacre population growth trajectory using the 1961 census population figure as the starting point and extending it forward to the end of 1965. The discrepancy between the “observed” and “expected” populations represents the number of people in a regency (kabupaten) or district (kecamatan) who are unaccounted for either as a deficit or a surplus. Given that we know the dates on which the three population censuses were conducted, these computations can be made by using days, months, or years as the unit of time. The computations presented in this article use days as the unit of time for maximum precision.