Implications
The evaluation and design of sustainable livestock farming systems require predicting herd responses to management. This study describes a dairy goat herd model, representing dynamic interactions between management and individual biological processes. The model provides a tool to study the effect of different management strategies on individual variability. Simulation results showed that over- and underfeeding strategies led to an apparent herd efficiency increase, but were not based on individual efficiency increase. Aggregating individual performance at the herd level can cover some differences between management strategies. Hence, achieving a sound assessment of management requires considering individual performance.
Introduction
Increasing concern for the sustainability of livestock farming systems highlights the need to find new ways of reducing costs and increasing efficiency. Efficiency at the herd level relies on individual efficiency, which is highly dependent on the animal’s ability to convert feed into products (e.g. dry matter (DM) intake/kg of milk). The main characteristic of individual efficiency is its variability, mainly due to the variability of production potential and to the variability of nutrient partitioning, under the control of production potential and regulations (Bauman, Reference Bauman1985; Friggens and Newbold, Reference Friggens and Newbold2007). In addition to biological variability, individual responses are also modulated by management. In small ruminants, management is often implemented on groups of individuals with different characteristics (e.g. production potential, weight and physiological status). Due to these differences, physiological state transitions of individuals in response to management are variable and asynchronous. Both differences in nutrient partitioning and management explain why modelling the group response on the basis of each individual’s response is different from modelling the group response on the basis of the average animal’s response (Pomar et al., Reference Pomar, Kyriazakis, Emmans and Knap2003; Villalba et al., Reference Villalba, Casasus, Sanz, Bernues, Estany and Revilla2006). By representing the variability emerging from complex interactions between biological processes and management, simulation models are promising tools for evaluating the effect of management strategies on the trade-off between production level and production cost.
Most simulation models represent a herd as a group of individuals the performance of which is based on the performance of an average animal. They use knowledge on animal physiology to predict the performance of genotypes under different environments (e.g. Sanders and Cartwright, Reference Sanders and Cartwright1979 for sheep; Blackburn and Cartwright, Reference Blackburn and Cartwright1987 for beef cattle; Bosman et al., Reference Bosman, Ayantunde, Steenstra and Udo1997 for meat goats). Nutrient partitioning is performed with priority rules based on an a priori fixed hierarchy among functions. By considering the herd as a set of groups with the same attributes, these models underrepresent individual variability.
Individual-based models have overcome this limitation as they take into account each individual whose state changes over time independently from others according to management events (Congleton, Reference Congleton1984; Sorensen et al., Reference Sorensen, Kristensen and Thysen1992; Tess and Kolstad, Reference Tess and Kolstad2000). Nutrient partitioning is, however, still based on a fixed hierarchy among functions. Furthermore, the representation of management ignores the decision-making process and includes only driving variables inducing reproductive cycles. The decisional process is formalised in several individual-based models (Cournut and Dedieu, Reference Cournut and Dedieu2004 for sheep; Ingrand et al., Reference Ingrand, Dedieu, Agabriel and Perochon2002 for indoor-housed beef cattle; Romera et al., Reference Romera, Morris, Hodgson, Stirling and Woodward2004 for grazing cattle). By explicitly integrating management entities and individuals, these models make it possible to study the link between management decisions and animal responses throughout their productive life. However, they do not incorporate the biological driving forces of individual variability. Regarding the study of individual variability, shortfalls of current herd models are thus twofold: (i) a simplified comprehension of management; and (ii) a restricted representation of biological individual variability (by considering an average animal or by neglecting nutrient partitioning). There is therefore a need for herd models that explicitly incorporate the driving forces of individual variability, derived both from the biology of individuals and their responses to feeding and reproductive management designed at the group level. With this objective, we developed the herd model Simulation of Goat Herd Management (SIGHMA) to simulate the dynamic effects of feeding, reproductive and replacement management on individual biological responses. SIGHMA is applied to intensive dairy goat herds in the Poitou-Charentes area (West of France). However, the conceptual framework of the model can be applied to other livestock farming systems. In this paper, we describe the general model structure and present a sensitivity analysis to assess the consistency of the model behaviour. We then run a virtual experiment to study how overfeeding and underfeeding strategies affect herd performance in terms of milk production and feed conversion efficiency, and finally consider what the effects of these feeding strategies on individual variability within the herd were found to be.
The dairy goat herd management model SIGHMA
General framework
SIGHMA is made up of two interacting components, an animal sub-model and a management sub-model. The animal sub-model formalises dairy goat productive life from birth to herd exit. It simulates intake, milk production and body weight (BW) changes over a number of productive cycles. These performance patterns are based on production potential parameters and on the responses to reproductive and feeding management. Hence, the final individual variability results from the input variability (related to the distributions of production potential parameters) and from the variability generated by management operations carried out during simulation. Individual variability is thus an output of simulation instead of being only an input generated by probability distributions. The management sub-model accounts for the decision-making process. It translates a farmer’s production project into technical operations on goats with a rule-based approach. In dairy production, a farmer’s production project corresponds to a targeted herd milk production pattern. The latter is driven by the organisation of kidding periods. We represent this first decision level by the concept of functional groups (FGs) that divide the herd into management entities, that is, groups of individuals, to achieve the farmer’s project. Each entity is managed by the same set of reproductive, feeding and replacement decision rules leading to technical operations. The temporal link between animals and decision rules is ensured through an elementary management pattern (EMP) that formalises the planning and the chronological execution of operations in an FG. The EMP is implemented with a set of discrete events formalising technical decision rules and operations on individuals, where each of the latter corresponds to a compartmental model. Both discrete events and individual models are implemented with Modelmaker 3.0 (Cherwell Ltd, Oxford, UK, 2000). The connection between the animal sub-model and the management sub-model is performed through elementary actions (for instance, ‘give diet’, ‘dry off’ and ‘cull’) carried out by events that modify variables of individual models (for instance, the gestating status, modified by the action ‘fertilise’, or the lactation status, modified by the action ‘dry off’). More details on how events interact with individual models can be found in Appendix A of the supplementary material online (Table S1).
Herd management entities
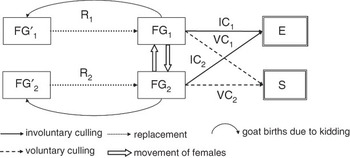
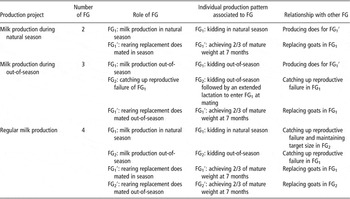
An FG is a group of females managed by the same set of technical decision rules. These rules drive the female biology to achieve a production pattern fitting a farmer’s production project. Two types of FG are considered (Figure 1): groups including immature females (from birth to first mating, denoted by FGi′) and those made up of productive females (from first mating to herd exit, denoted by FGi). The number and size of FG and FG′ reflect the farmer’s production and replacement strategies. Flows of females between FG represent female movements due to either infertility management (i.e. providing another mating opportunity) or maintenance of a targeted proportion of goats in each FG. These movements enable goats to produce milk for more than 1 year (i.e. to achieve an extended lactation). The FG generates female exits, denoted by E, corresponding to involuntary culling due to death or health problems, and sales, denoted by S, corresponding to voluntary culling. Herd size management is based on the following assumptions: (i) the herd size between years is constant and with a stable number of goats at mating; (ii) replacement is achieved with does born in the herd and (iii) replacement determines culling. As involuntary culling is simulated as a stochastic phenomenon, the flow of voluntary culling is used to buffer herd size variation and achieve the desired number of females at mating. Figure 1 illustrates this first conceptual level of herd representation in the case of a regular milk production project achieved with two kidding periods. For the three main production projects observed in Poitou-Charentes (French Livestock Institute, 2008a), Table 1 details herd organisation into FG as well as the related individual production pattern for each FG. It shows that formalising herd management with FG gives flexibility for representing different production projects.
Functional groups (FGs) of goats as basic management entities of the herd for a regular milk production project. FG1: goats managed to kid in season; FG2: goats managed to kid out of season; FG1′: does reared to replace goats in FG1; FG2′: does reared to replace goats in FG2. E: exit; S: sale; Ri: replacement; ICi: involuntary culling; VCi: voluntary culling. Constant herd size is ensured by: R 1 + R 2 = IC1 + VC1 + IC2 + VC2. As replacement determines culling and involuntary culling is a random process, constant herd size is achieved by adjusting voluntary culling in each FG: VCi = Ri − ICi.

Herd configuration into functional groups (FG) for the three main farmers’ production projects in Poitou-Charentes

Temporal management of FGs
An EMP is the minimal sequence of technical operations that organises a female production pattern in an FG. The succession of EMP over time ensures the operation of the FG. As a temporal unit of management, an EMP is formalised by a plan of dates and by scheduled technical operations relative to feeding, reproductive and replacement strategies. The EMP is an operational concept to describe the management of immature females. However, the present model only represents feeding and reproductive strategies related to productive females. The feeding strategy corresponds to the combination of a number of feeding steps chronologically organised within the feeding sequence. Each step is defined by temporal bounds and by a reference animal (Guérin and Bellon, Reference Guérin and Bellon1990). The concept of the reference animal is used to reflect the fact that a farmer decides on a given level of feed for a group by considering an average animal in that group, that is, the reference animal. The reference animal is defined in terms of production potential, that is, the milk production (kg/day) at the peak of the third lactation. The requirements to meet this production define the amount of feed distributed to the FG. Modulating the level of the reference animal in relation to the average production potential of the group makes it possible to adjust the proportion of individuals in the group that are fed to meet their requirements. The reproductive strategy corresponds to the succession of mating period, pregnancy diagnosis, pregnant and non-pregnant goat management along with drying off. The mating period is defined by its length and mating techniques. Non-pregnant goat management defines the decision rules for culling or maintaining non-pregnant goats in extended lactation. Replacement strategy combines: (i) the number of does kept for replacement from kids born into the herd; (ii) their integration into an FG of mature goats at mating and (iii) the number of goats culled according to production and lactation number criteria.
Management sub-model: a planned set of discrete events formalising decision rules and technical operations
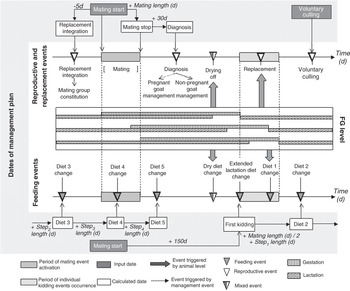
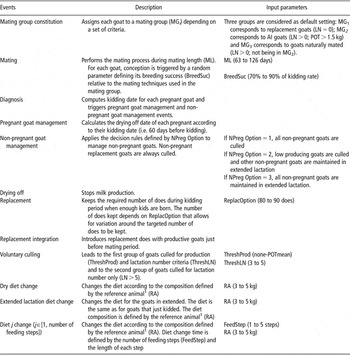
Dates in the management plan implement the chronological succession of events related to reproductive, replacement and feeding strategies and ensure their coordination. The relationships between the plan and events are illustrated in Figure 2 and a more detailed description can be found in the supplementary material online (Appendix A). Key points in the plan are the starting date of the mating period and the date for voluntary culling. These dates are user-defined and are used to compute other dates. For instance, the date for pregnancy diagnosis depends on the starting date of the mating period and its length. Similarly, the middle of the kidding period, derived from the mating period, is used to determine the starting date of the second step in the feeding sequence. The management strategies are defined by the rules and the operation specifications implemented for each event. The events comprised in an EMP are described in Table 2.
Chronological successions of events traducing the implementation of feeding, reproductive and replacement strategies within an elementary management pattern ensuring the operation of a functional group (FG). Stepj length corresponds to the time during which diet j is distributed to the FG.

Description of the events that occurred in the elementary management pattern of a functional group

LN = lactation number; POT = milk production potential, expressed in kg of milk at the peak of the third lactation; POTmean = mean herd production potential.
1The reference animal is expressed in the same unit as the production potential (kg of milk at peak of the third lactation) of the virtual goat the requirements of which are used to define the diet.
For input parameters, the range of values used in simulations is mentioned within brackets.
Animal sub-model: a set of compartmental models formalising individual variability
The representation of individuals was directed by the need to incorporate the determinants of biological variability. The biological responses of each individual are simulated by a mechanistic animal model based on a compartmental structure (Puillet et al., Reference Puillet, Martin, Tichit and Sauvant2008). Compartments represent BW, gravid uterus and milk production. They simulate flows of energy and materials associated with the physiological functions of growth, pregnancy, lactation and utilisation of body reserves. The milk production potential (expressed as the milk production in kg/day at the peak of the third lactation) and the mature BW are key input parameters of each model. At goat birth, they are randomly drawn from Gaussian distributions, thus reflecting in-herd genetic variability. The mean and standard deviation of the Gaussian distributions are user-defined parameters. These parameters are constant over the simulation, translating the fact that there is no genetic progress within the herd. This assumption was made to achieve a progressive control of the simulated variability. The model explicitly integrates a regulating system that represents the homeorhetic control of physiological functions over several reproductive cycles (Sauvant, Reference Sauvant1994). This type of regulation ensures coordination between biological functions to support a given physiological state (Bauman and Currie, Reference Bauman and Currie1980). It determines priorities among functions that drive energy allocation and thus biological responses. Two modalities of model operation are defined: (i) a pull modality where energy intake is an output of the model and (ii) a push-pull modality where intake is an input linked to the distributed diet (see Appendix B of the online supplementary material for complete model equations). The pull modality represents the reference pattern of female performance, defined by genetic scaling parameters and the dynamic of priorities among physiological functions during reproductive cycles. The push-pull modality represents the real pattern of female performance, defined by the responses to the energy provided by the diet. The energy of the diet induces deviation from the reference pattern of performance. Hence, we assume that the production potential is an optimum and not a maximum. The push-pull modality incorporates INRA’s principles of fill units and forage/concentrate substitution rate (Sauvant et al., Reference Sauvant, Giger-Reverdin and Meschy2007) and simulates actual energy intake. The diet is made up of concentrate, dehydrated alfalfa pellets and two forages, one defined as the fixed forage and one defined as the ad libitum forage. The dehydrated feedstuff and the fixed forage are presumably eaten first. Then, the quantity of the ad libitum forage consumed is calculated with the substitution rate involving concentrate feedstuff. The actual energy intake is compared with the potential energy intake defined by the production potential expression. It determines a differential of energy that is allocated between body reserves (mobilisation and reconstitution) and milk production. Body reserves act as a buffer for energy partitioning. Energy distribution among functions is achieved with a set of partitioning coefficients. These coefficients are calculated according to the relative priorities among physiological functions and the level of body reserves. Modulation by priorities enables coefficients to adjust dynamically through the succession of reproductive cycles. Modulation by body reserves introduces a memory effect relating to previous feeding strategies. Indeed, the level of body reserves at a given time reflects the cumulative effect of previous feeding strategies. The responses to energy input induce deviations from the reference pattern of performance, thus generating the real pattern of performance. The evaluation of the goat model is not presented in this paper but can be found in Puillet (Reference Puillet2010).
Concerning reproductive aspects, goats are fertilised during mating periods depending on the probability defined by management techniques. Once gestation is initiated, kidding occurs 150 days after conception. Finally, a daily random process is used to simulate the occurrence of death or health problems (see Table S4 in Appendix B of the supplementary material online). The threshold used to simulate occurrence of death depends on age and lactation number (Malher et al., Reference Malher, Seegers and Beaudeau2001). We consider that both death and health problems lead to a goat’s exit. The daily probability of death is parameterized for an annual rate of involuntary culling of 10%.
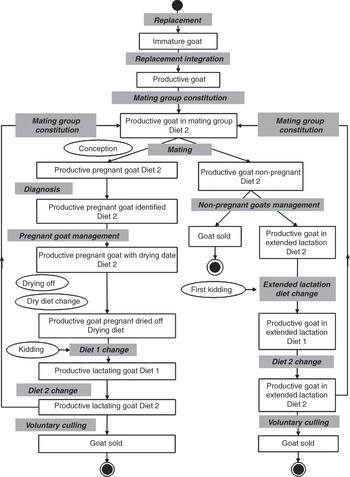
The biological operation of the goat model, based on its potential and regulation expression, and its interaction with the EMP processing generates individual variability, which is thus an output of SIGHMA. Figure 3 presents the different possible states of a goat model induced by the process of events within an EMP. This range of possible states is to be projected throughout time by the succession of EMP within the FG.
State transition diagram of a goat during the elementary management pattern operation. Management events are represented by grey boxes. Events triggered by animal sub-models are represented by ellipses. Mortality, not represented here, can happen at each time step. This example represents a simple feeding strategy with only two different diets throughout lactation. Diet 0 is the drying diet. Diet 1 is distributed during early lactation and diet 2 during mid and late lactation.

Outputs and simulations
SIGHMA yielded output at the individual, group and herd levels. Simulations were run over 20 years on a daily time-step. Model outputs were synthesised over the last 10 years of simulation. As the model incorporated independent stochastic processes to simulate conception, involuntary culling and production potential assignment at birth, it was necessary to run several replications for a given simulation. After using a re-sampling procedure on a set of 100 replications, we determined that 15 replications were sufficient to reduce variance and stabilise the means of simulated outputs. We considered the outputs that were the most directly affected by stochastic processes, that is, the number of involuntary culled goats (output related to mortality process) and the number of gestating goats (output related to reproduction process). The number of replications was considered as sufficient when the variance of these outputs was decreased by 70%. Output at the herd level, such as the total number of goats present, pregnant goats, lactating goats or dead goats, was recorded in each FG on a daily basis. Total milk production and feed consumption for each type of feedstuff (forage, dehydrated and concentrate) within each FG were also recorded daily. When some key events occurred, such as culling session or non-pregnant management, the numbers of infertile culled goats, extended lactation goats or voluntary culled goats were calculated. For each type of record, values in each FG were summed up to derive total herd output. Several indicators were computed to analyse: (i) herd demography including reproductive performance (kidding rate), replacement and culling rates; (ii) production performance in terms of milk production and feed consumption; and (iii) herd efficiency. Herd feed efficiency indicators synthesised the conversion of DM into milk at the individual and herd levels. It corresponded to the quantity of total DM required to produce 1 kg of milk. It was decomposed into forage DM, dehydrated and concentrate feedstuff DM. To balance the difference between consumed quantities (forage mainly being consumed) and prices (concentrate being more expensive), we calculated milk feed cost (in €/kg of milk) on the basis of 0.06 € for 1 kg of forage DM, 0.26 € for 1 kg of dehydrated DM and 0.30 € for 1 kg of concentrate (French Livestock Institute, 2008b).
At the individual level, the model recorded the values of key variables throughout a goat’s lifespan: dates of events such as kidding or drying off and the corresponding BW, variables relative to production (potential, days in milk, milk production) and feed consumption (forage, concentrate and dehydrated). Goats retained for analysis were born and culled during the last 10 years of simulation.
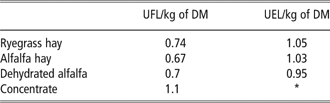
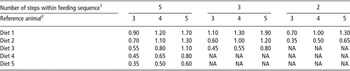
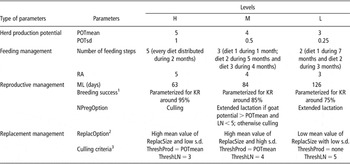
SIGHMA was run for a season’s project with an FG of 300 goats at mating and with an objective of 90 does for replacement. Mating season started on 15 August. Feeding values of feedstuff and feeding sequences are presented in Tables 3 and 4. Even if nutrition is only based on energy, each diet was checked with the INRA feeding system to ensure that protein requirements were fulfilled. Two types of simulations were combined. First, the model was evaluated through a sensitivity analysis on the main parameters (Table 5). For each parameter, three contrasted levels were determined (H: high; M: medium; L: low). Sensitivity analysis comprised 19 simulations: a reference simulation corresponding to default settings (all parameters fixed at M level) and 18 simulations corresponding to H and L levels of each parameter (all others being fixed at M level). Second, the model was used to run a virtual experiment with two levels of mean herd production potential (L: 4 kg and H: 5 kg) and two levels of reference animal (L: 4 kg and H: 5 kg). It generated the four treatments denoted: L-L (low potential combined with low feeding level), L-H (low potential combined with high feeding level), H-L (high potential combined with low feeding level) and H-H (high potential combined with high feeding level). In all treatments, parameters related to reproduction, replacement and feeding plan were fixed at the medium level as defined in the sensitivity analysis (see Table 5). Treatment L-L is used as a control to test an overfeeding strategy (L-H), whereas treatment H-H is used as a control to test underfeeding strategy (H-L). This second set of simulations was aimed at illustrating SIGHMA’s potential to disentangle the relative effects of different management options on herd performance and how these options modulate the individual variability underlying herd performance.
Feeding values of diet feedstuffs

UFL = Unité Fourragère Lait (French milk unit of net energy equivalent to 1.7 Mcal); DM = dry matter; UEL = Unité Encombrement Lait (French unit of fill effect and intake capacity equal to 1 for a reference herbage). *Concentrate feedstuff does not have any UEL value. In the INRA feeding system, this value depends on the UEL value of the forage to take into account the substitution phenomenon between forage and concentrate feedstuff (see Agabriel et al., Reference Agabriel, Pomiès, Nozières and Faverdin2007 for details).
Quantity of concentrate distributed (kg of DM/day) for each feeding strategy defined by the combination of a number of steps within the feeding sequence (related to the number of diet changes throughout the herd lactation period) and a reference animal (related to the level of energy of the diet)

DM = dry matter; NA = not applicable.
1All feeding sequences have the same diet during drying off period (in kg of DM/day): 0.5 kg of ray-grass hay, 0.2 kg of dehydrated alfalfa and alfalfa hay ad libitum.
2The reference animal is expressed in the same unit as the production potential of a goat (kg of milk/day at peak of third lactation). For a given value of the reference animal, the quantity of concentrate distributed throughout 10 months of lactation is the same, whatever is the number of steps within the feeding sequence.
Parameterisation of sensitivity analysis for SIGHMA evaluation

H = high; KR = kidding rate; L = low; LN = lactation number; M = medium; ML = mating length; NPregOption = input parameter defining decision rules associated to non-pregnant goat management; POTmean and POTsd = mean and s.d. values of Gaussian distribution defining goat production potential at birth.
By default, BW at maturity is triggered at birth in a Gaussian distribution with a mean of 65 kg and a s.d. of 5 kg; RA = reference animal, expressed in kg of milk production at peak of 3rd lactation. RA defines the diet energy level; ReplacOption = input parameter modulating the number of goats kept for replacement; ReplacSize = number of does kept for replacement; ThreshLN = lactation number criteria for voluntary culling; ThreshProd = production criteria for voluntary culling.
1See Table S1 in Appendix A of the supplementary material online for details on the reproductive process in the model.
2When ReplacOption = H, the mean value of ReplacSize = 89 (±0.6) does; when ReplacOption = M, the mean value of ReplacSize = 88 (±2) does and when ReplacOption = L, the mean value of ReplacSize = 80 (±0.7) does.
3The culling criteria do not change the number of culled goats. However, the H and M levels of culling corresponds to a culling strategy based on production and age whereas the L level of culling corresponds to a culling strategy only based on age.
Results
Sensitivity analysis
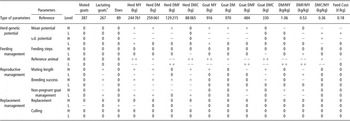
The results of sensitivity analysis are summarised in Table 6. As expected, the number of mated goats was not affected by any parameters, confirming the role of this variable as the numeric reference for constant herd size. For other goat categories, the model showed consistent behaviour: the number of does was affected only by the replacement option; the lactating and kidding goats were affected mainly by the reproductive management; the goats culled for infertility and in extended lactation responded strongly to reproductive management factors. Concerning productive outputs, the herd milk production was mainly affected by feeding management with the reference animal level having the highest impact, either positive or negative. To a lesser extent, the mean herd production potential and the reproductive management modified the herd milk production to the same magnitude. The effect of the mean herd production potential was logically reported on the milk production per goat, whereas the effect of reproductive management factors affected mainly the number of lactating goats. Concerning the herd DM consumption, the same effects were observed as for milk production. Nevertheless, the mean herd production potential affected only the forage DM intake, whereas feeding management modified the concentrate DM intake. Finally, the herd efficiency (kg DM/kg of milk) was mainly affected by the feeding management and to a lesser extent by the mean herd production potential. The same effects were observed on the herd milk feed costs with an even lower difference between genetic and feeding management.
Results of model sensitivity analysis. All values are expressed in % of the reference simulation (all parameters equal to medium level) and encoded depending on the value of the deviation from reference simulation

−− = deviation above −10%; − = deviation between −2% and −10%; 0 = deviation between −2% and 2%; + = deviation between 2% and 10%; ++ = deviation above 10%; DM = dry matter; DMC = dry matter of concentrate; DMF = dry matter of forage; MY = milk yield.
1The number of lactating goats corresponds to the mean number of lactating goats in the herd throughout one year of production.
Virtual experiment
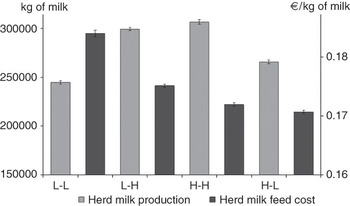
The herd milk production (HMP, mean ± s.d. in kg/year) and the herd milk feed cost (HFC, mean ± s.d. in €/kg of milk) over 10 years are presented in Figure 4. The number of lactating goats was equivalent in all treatments. HMP was higher for L-H than for L-L (L-H: 300 000 ± 2000 kg/year; L-L: 245 000 ± 2000 kg/year) and HFC was lower for L-H than for L-L (L-H: 0.1750 ± 0.0002 €/kg of milk; L-L: 0.1840 ± 0.0005 €/kg of milk). Compared with the control treatment, the overfeeding strategy led to a production increase associated with a feed cost decrease. This result indicates that the production increase was large enough to compensate for the extra consumption of concentrate. HMP was lower for H-L than for H-H (H-L: 266 000 ± 1500 kg/year; H-H: 307 000 ± 2000 kg/year) and HFC was slightly lower (H-L: 0.1700 ± 0.0003 €/kg of milk; H-H: 0.1720 ± 0.0003 €/kg of milk). Compared with the control treatment, the underfeeding strategy led to a production decrease and a slight decrease in feed cost. This result indicates that the decrease in feed consumption was large enough to compensate for the decrease in production.
Model simulations of herd milk production (mean value over the last 10 years, ±s.e. over 15 replications) and herd milk feed cost (mean value over the last 10 years, ±s.e. over 15 replications) for four treatments following a 2 × 2 factorial arrangement with the herd production potential level (H: 5 kg; L: 4 kg) and the reference animal (H: 5 kg; L: 4 kg). Treatments are denoted: L-L, L-H, H-H and H-L, where L-L and H-H are used as a control to test overfeeding and underfeeding strategy.

Exploring individual variability underlying herd performance
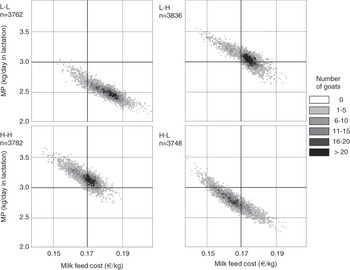
A further step in analysing the relative effects of factors within virtual experiments was to study individual variability underlying herd performance. Model simulations were analysed to quantify this variability and to establish goat profiles in terms of milk production and milk feed cost. Level plot representation (Figure 5) was used to study the distribution of goats in the space defined by their average lifetime milk production (kg of milk/day of lactation) and their average lifetime efficiency (milk feed cost in €/kg). For all the simulated treatments, goats were distributed along an axis from low potential and high feed costs to high potential and low feed costs. This global trend reflects the economy of scale due to maintenance cost dilution associated with increased productivity. SIGHMA, however, simulated the variability around this global trend. Compared with the L-L treatment, the distribution of the L-H treatment is an area of higher production and lower feed cost. Compared with the H-H treatment, the distribution of the H-L treatment is in an area of lower production and lower feed cost. These results are consistent with the effects observed at the herd level: overfeeding led to an increase in production and a decrease in feed cost, whereas underfeeding led to decreases in both production and feed cost.
Level plot of milk production (MP in kg of milk/day of lactation) and efficiency (milk feed cost in €/kg) over goat productive lives simulated by the model for four treatments following a 2 × 2 factorial plan with the herd production potential level (H: 5 kg; L: 4 kg) and the reference animal (H: 5 kg; L: 4 kg). Treatments are denoted: L-L, L-H, H-H and H-L where L-L and H-H are used as a control to test overfeeding and underfeeding strategy. The square grid was obtained with 100 classes for each variable. Each grid unit was coloured depending on the number of goats at the intersection of production efficiency classes.

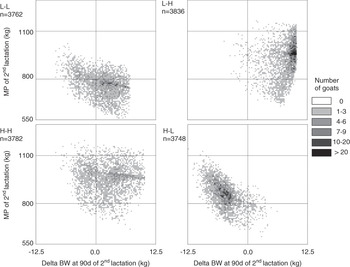
To further understand the biological processes underlying herd and goat productive life performance, model simulations were analysed regarding second lactations. A level plot was also used to represent individual distribution in terms of total milk production (in kg) throughout the second lactation and the difference (in kg) between BW and potential BW at 90 days of lactation (Figure 6). Including this last variable made it possible to assess whether a goat had gained or lost weight compared with its genetically driven body reserves change (Friggens and Newbold, Reference Friggens and Newbold2007).
Level plot of milk production (MP on 2nd lactation, in kg) and differential of BW between simulated and potential (delta BW, in kg) over productive life of goats simulated by the model for four treatments following a 2 × 2 factorial plan with production potential herd level (H: 5 kg; L: 4 kg) and the reference animal (H: 5 kg; L: 4 kg). Treatments are denoted: L-L, L-H, H-H and H-L, where L-L and H-H are used as a control to test overfeeding and underfeeding strategy. The square grid was obtained with 100 classes for each variable. Each grid unit was coloured depending on the number of goats at the intersection of production-BW differential classes.

The distribution of the two control treatments, L-L and H-H, had similar shapes with goats homogeneously distributed. This result illustrates that when the feeding level matches the mean production potential, individual variability is fully expressed. Distribution of the H-H treatment was higher along the y axis than that of L-L, translating the difference of mean production potential between the two control treatments. Compared with the L-L treatment, L-H led to a contrasted distribution with goats mainly located in the right area of the level plot. The overfeeding strategy led to goats gaining weight compared with their production potential. The density of goats close to 12 kg of gain reflects the fact that the individual goat model was parameterized for not having body reserves over 20% of its BW. This result indicates that energy was directed towards body reserves, and as far as efficiency is concerned, this effect can be considered as a loss of energy. At the herd level, we observed that overfeeding led to decreased feed cost. The production increase was large enough to hide the loss of energy at the individual level. Compared with the H-H treatment, H-L led to a contrasted distribution with goats mainly in the left area of the level plot. The underfeeding strategy led to goats losing weight compared with their production potential. This result shows that their production relied on energy obtained from their body reserves. At the herd level, underfeeding led to a slight decrease in feed cost. In spite of the fact that we observed a concurrent decrease in production, we believe that this decrease in feed costs was due to goats using energy from their body reserves.
Discussion
The herd model SIGHMA predicts herd and goat performance based on the dynamic interactions between management and individual biological responses. We used SIGHMA to study the effects of contrasted feeding management on herd performance and characterized how these different levels of performance were obtained from individuals. In this section, we will first discuss the simulation results regarding the contribution of individual variability to understanding herd functioning. Then we will discuss the modelling approach with an emphasis on the management representation (the biological one has been discussed in Puillet et al., Reference Puillet, Martin, Tichit and Sauvant2008).
Simulation results
Results of the sensitivity analysis showed that SIGHMA has consistent behaviour and can be used to test various combinations of management choices. Using SIGHMA to simulate virtual experiments makes it possible to disentangle the relative effects of management and mean production potential on production and efficiency at both the herd and individual levels. Studying the efficiency of feed conversion into milk is possible because the model incorporates energy partitioning at the individual level. This was not the case with previous models that focused on reproduction and ignored feeding (e.g. Oltenacu et al., Reference Oltenacu, Milligan, Rounsaville and Foote1980; Cournut and Dedieu, Reference Cournut and Dedieu2004) or represented animal performance with a pull approach (Congleton, Reference Congleton1984). In addition, the dynamic representation of energy partitioning (depending on the goat’s physiological state and body reserve level) makes it possible to express individual variability, which is not the case with models based on fixed rules of energy partitioning (e.g. Sorensen et al., Reference Sorensen, Kristensen and Thysen1992; Tess and Kolstad, Reference Tess and Kolstad2000). The expression of individual variability at the scale of a lifetime is a key element in understanding the mechanisms underlying efficiency. Despite integrating the major source of individual variability, we represented the goat’s milk response to the quantity of concentrate with the same rules for all individuals. We did not introduce variability at the level of energy partitioning coefficients. We did not take into account either the effects of the transition period between two diets on milk production or the delayed effect of a feeding sequence on the following one. However, to implement such refinements in the animal sub-model, further experimental trials, explicitly focused on individual variability, would be needed.
Results of the virtual experiment showed that overfeeding led to a production increase associated with a feed cost decrease at the herd level. This apparent increase in efficiency (as feed cost decreased) should be moderated by considering individual results. At the individual level, the overfeeding strategy was detrimental to efficiency as goats had directed energy towards body reserves. Conversely, underfeeding led to a production decrease and a slight decrease in feed costs. This apparent increase in efficiency was due to goats sustaining production by increasing the mobilisation of reserves, which could lead to reproductive and health problems detrimental to herd performance. These results should be interpreted with caution because of some limitations in the goat model. Three of those can be pointed out. First, the probability of conception for a goat is only determined by the parameter Breeding Success related to the mating techniques. There is no feedback effect of the level of body reserves on this probability. Consequently, the lifetime outputs of a goat that was over- or underfed are likely to be overestimated as this goat could have expressed reproductive failure leading to culling for infertility. Therefore, this goat would have had a short productive life. Second, the goat model did not include any feedback of body reserves on feed intake. This limitation is likely to modify the efficiency and production at the individual level. Third, we only considered responses to diet energy and not to protein. This choice was motivated by the fact that energy is the main limiting factor of production potential expression and also by the lack of knowledge regarding the response of the goat to protein.
The main contribution of the SIGHMA model is not to produce accurate values of efficiency and production but to show that it is necessary to go beyond herd performance to assess management effects. To achieve a sound assessment of management, it is necessary to focus on the underlying processes at the root of herd performance. The translation of individual performance at the herd level can hide some differences between management strategies. Hence, tools such as SIGHMA have the potential to comprehend how productive responses are translated from the individual to population level in response to management. Population responses have previously been studied over short time periods (Pomar et al., Reference Pomar, Kyriazakis, Emmans and Knap2003 for growing pigs; Villalba et al., Reference Villalba, Casasus, Sanz, Bernues, Estany and Revilla2006 for beef cattle) but not at the scale of dairy female productive life. This level is increasingly pointed out as being relevant for evaluating management effects in livestock production (Gibon et al., Reference Gibon, Sibbald, Flamant, Lhoste, Revilla, Rubino and Sorensen1999; Cournut and Dedieu, Reference Cournut and Dedieu2004; Peyraud et al., Reference Peyraud, Le Gall, Delaby, Faverdin, Brunschwig and Caillaud2009). The role of variability in lifetime performance relative to a farmer’s production project and herd performance was qualitatively explored by Tichit et al. (Reference Tichit, Ingrand, Moulin, Cournut, Lasseur and Dedieu2004 and Reference Tichit, Ingrand, Moulin, Cournut, Lasseur and Dedieu2008). These authors showed that there is no one-way relationship between variability in lifetime performance, the level of constraint influencing the livestock system and the type of production project. Tolerating or even seeking in-herd diversity can help buffer variations in the environment or reinforce herd adaptability to a project that is demanding from a biological viewpoint (Guimaraes et al., Reference Guimaraes, Tedeshi and Rodrigues2009). SIGHMA then should open promising perspectives in quantifying the role of lifetime performance variability under different management options.
Modelling approach
Several authors have pointed out the need to pay more attention to decision-making processes in simulation models to improve models as decision support systems (McCown, Reference McCown2002; Garcia et al., Reference Garcia, Guerrin, Martin-Clouaire and Rellier2005; Woodward et al., Reference Woodward, Romera, Beskow and Lovatt2008). Others advocate the development of models linking farmers’ decisions with the biological behaviour of females in the long term (Tichit et al., Reference Tichit, Ingrand, Moulin, Cournut, Lasseur and Dedieu2004 and Reference Tichit, Ingrand, Moulin, Cournut, Lasseur and Dedieu2008). SIGHMA brings evidence about the interest of such an approach linking a decisional sub-model with a biological sub-model that takes into account inherent regulations for different physiological functions. The central point was to articulate these two approaches to account for both the biological responses due to the effects of technical operations and, at the same time, the adaptation of such technical decisions on the basis of indicators of animal responses. The SIGHMA conceptual framework of herd management is based on an organisation into FG operating through time with EMP. These conceptual levels ensure: (i) the consistency between the farmer’s project, the strategy and technical operations on goats; (ii) the flexibility to represent different production projects; and (iii) the consistency between reproductive and feeding strategies. The translation of a farmer’s project into a herd organisation in FG is close to the conceptual framework developed for grazing systems (Coléno and Duru, Reference Coléno and Duru2005; Martin et al., Reference Martin, Duru, Martin-Clouaire, Rellier, Theau, Therond and Hossard2008). In these approaches, the first step in management representation is production system configuration. Configuring implies defining resource allocation and organising production activities to satisfy the production objectives. The output of this process is the definition of the functional production unit, which is a concept similar to our FG. These production units are targeted by technical decisions implementing planning and technical operation execution. Both of these elements are integrated in the elementary management pattern. Our approach remains mainly pre-scheduled, reflecting that farming activities are recurrent and cyclical in nature (Aubry et al., Reference Aubry, Papy and Capillon1998). SIGHMA does not integrate rules for management adjustment in case of external perturbation as is the case with other recent models (Chardon et al., Reference Chardon, Rigolot, Baratte, Le Gall, Espagnol, Martin-Clouaire, Rellier, Raison, Poupa and Faverdin2007; Vayssières et al., Reference Vayssières, Guerrin, Paillat and Lecomte2009; Martin et al., Reference Martin, Hossard, Theau, Therond, Josien, Cruz, Rellier, Martin-Clouaire and Duru2009). Such models, however, are based on a pull approach of the animal component. Therefore, they are limited regarding the representation of the biological source of adaptation of the system and the representation of individual variability. Extending SIGHMA by integrating a generic representation of decision-making processes (Martin-Clouaire and Rellier, Reference Martin-Clouaire and Rellier2009) would make it possible to study adaptive management (Darnhofer, Reference Darnhofer2009). It would open promising perspectives to more fully explore the regulating properties of livestock systems based on both the biological and management components.
To our knowledge, SIGHMA is the first individual-based herd model that incorporates both the feeding and reproductive strategies. Key parameters of these strategies are user-defined and they make it possible to simulate a wide range of management options. In particular, SIGHMA could be used to test different temporal management strategies of feeding and reproduction. Notably, it could be interesting to combine different physiological state distributions with different temporal feeding plans to find out which feeding plans are best in line with reproductive management. Moreover, SIGHMA could be used to test a scenario of extreme management simplification where the herd is managed as one group with a one-step feeding sequence throughout lactation and extended lactation for all non-pregnant goats. Farmers nowadays are paying increasing attention to this type of management as a way to solve the problem of work overload in intensive large herds.
Conclusion
The development and application of SIGHMA have shown its ability to generate individual variability in response to herd management. It enables the user to evaluate the effects of feeding and reproductive management in terms of herd production level and production efficiency. Herd efficiency was mainly affected by feeding management and to a lesser extent by the herd production potential. The strategy based on overfeeding led to a herd production increase and a feed cost decrease. However, this apparent increase in efficiency at the herd level was related to goats that had directed energy towards body reserves. Such a process is not efficient as far as feed conversion is concerned. The strategy based on underfeeding led to production decrease and to a slight feed cost decrease. This apparent increase in efficiency was related to goats that had mobilised their reserves to sustain production. These results shed light on how individual variability can contribute to improving the assessment of management strategies. The next step in this area of research would be to investigate individual variability expression under different management strategies.
Acknowledgement
This study was supported by a grant from the Poitou-Charentes region of France, the INRA PHASE and SAD departments and by financial support from ‘ANR – Agence Nationale de la Recherche – The French National Research Agency’ under the ‘Programme Agriculture et Développement Durable’, project ‘ANR-05-PADD-02-04’. The authors are grateful to N. Bossis (Institut de l’Elevage), B. Leboeuf (INRA), F. Jénot (Fresyca), H. Coutineau (LEGTA Melle), A. Panelle and J. Losdat (BTPL) for their precious contribution to the management sub-model development. They also thank the staff of INRA MoSAR and SAD-APT Research Units.