Introduction
Tobacco smoking is known to cause acute and chronic diseases [Office on Smoking and Health, 2006; World Health Organization (WHO), 2015]. The World Health Organization Framework Convention on Tobacco Control (WHO-FCTC) (WHO, 2003) is the first international health treaty that requires parties to implement tobacco control measures. Spain ratified the WHO-FCTC on 11 April 2005. In 2008, WHO developed the MPOWER package (WHO, 2008) to assist nations in meeting their commitments to the treaty. One of the six components of MPOWER is that of protecting people from environmental tobacco smoke (ETS).
The WHO-FCTC has accelerated the implementation of measures in several crucial policy domains, one of which is ETS regulation (Uang et al., Reference Uang, Hiilamo and Glantz2016). Public and private steps to reduce ETS have become both more common and more restrictive (WHO, 2015). There are various reasons for this broad implementation. One is the manifest public health need to reduce exposure to ETS, which is known to cause acute and chronic diseases in non-smokers (Office on Smoking and Health, 2006; WHO, 2015). A second reason is that of public support for restrictive measures: the great majority of both non-smokers and smokers favour smoking restrictions in public locations, including the workplace and hospitality venues (Martínez-Sánchez et al., Reference Martínez-Sánchez, Fernández, Fu, Gallus, Martínez, Sureda, La Vecchia and Clancy2010). A third reason is that employers, too, can benefit from ETS regulations, because prohibiting smoking in the workplace can reduce the maintenance and repair costs of buildings and property, cut insurance costs and raise productivity (Cornelsen et al., Reference Cornelsen, McGowan, Currie-Murphy and Normand2014).
Although the main objective of smoke-free laws is to reduce ETS exposure in the non-smoker population, these laws have important implications for reducing smoking too (Fichtenberg and Glantz, Reference Fichtenberg and Glantz2002; Callinan et al., Reference Callinan, Clarke, Doherty and Kelleher2010; Frazer et al., Reference Frazer, Callinan, McHugh, van Baarsel, Clarke, Doherty and Kelleher2016). First, the more smoke-free policies proliferate, the more perceptions of the harmful effects of tobacco will increase among minors (Albers et al., Reference Albers, Siegel, Cheng, Biener and Rigotti2007; Brown et al., Reference Brown, Moodie and Hastings2009). Second, for adult smokers who are attempting to quit, the existence of smoke-free places in personal and work environments contributes significantly to this process (Nagelhout et al., Reference Nagelhout, de Vries, Boudreau, Allwright, McNeill, van den Putte, Fong and Willemsen2012). Finally, there is a time restriction; the cigarettes not smoked during the working day or leisure time are unlikely to be smoked in the remaining time (Levy and Friend, Reference Levy and Friend2003). Together with economic measures such as punitive taxation and persuasion-based actions derived from the theories of behavioural economics, the prohibition in public and private places has proved to be a major instrument in the anti-smoking armoury of increasing number of developed countries (Schaap et al., Reference Schaap, Kunst, Leinsalu, Regidor, Ekholm, Dzurova, Helmert, Klumbiene, Santana and Mackenbach2008).
However, the incremental effectiveness of an absolute ban on smoking in public places compared with that of a partial ban (usually applied to the workplace and with exceptions) remains unknown. Spain is an interesting case for study because after five years of partial prohibition, a total ban was imposed. On 1 January 2006, Spain introduced its first national smoke-free law (Act 28/2005, 2005) to protect the health of non-smokers. This legislation banned smoking in all indoor public and workplaces, with exceptions in the hospitality sector. Hospitality venues larger than 100 m2 were defined as smoke-free, but the law allowed a separate and independently ventilated smoking area to be established. For venues smaller than 100 m2, the owner could choose whether to be smoke-free or not. This approach became known as the ‘Spanish Model’. This Spanish regulation was in line with the proposals made by the tobacco industry, which hoped it would be extended throughout the European Union, a standpoint that is indicative of the expected effectiveness of partial bans. Five years later, on 2 January 2011, Act 28/2005 was substantially amended by Act 42/2010 (2010), which mandated a total ban on smoking in all indoor public and workplaces, without exceptions. Smoking was to be allowed only in private smoking clubs, with entry restricted to members. To our knowledge, there has been no assessment of the impact of these 2006 and 2011 laws at the national level. The aim of the present study is to assess the differential effect on cigarette sales in Spain of these two bans.
Methods
Data collection
Data on tobacco product sales and prices were obtained from the Tobacco Market Commission [Comisionado para el Mercado de Tabacos (CMT), 2016]. CMT records and publishes the official sales of cigarettes in Spain, excluding the Canary Islands and the autonomous cities of Ceuta and Melilla. The CMT data set is updated monthly. It is not derived from sampling and therefore is not subject to reporting or measurement errors as is the case of self-reported survey data. Monthly data on both manufactured cigarettes and hand-rolling tobacco, from January 2000 to December 2015 (T=192), were analysed.
Measurements
Outcome variable
The outcome variable is the log-transformed monthly per capita sales of manufactured and hand-rolled (HR) cigarettes, in packs. Both types of tobacco product are considered because in recent years there has been a significant increase in the consumption of HR cigarettes, indicating a shift from manufactured cigarettes (López-Nicolás et al., Reference López-Nicolás, Cobacho and Fernández2013; Fu et al., Reference Fu, Martínez-Sánchez, Cléries, Villalbí, Daynard, Connolly and Fernández2014). While the latter account for over 90% of sales, the share of HR cigarettes has more than trebled since 2005, from 1.6 to 5.1% of tobacco sales (CMT, 2016).
In order to add the sales of manufactured cigarettes to those of HR cigarettes, three possible conversion rates were considered: 0.7, 1.0 and 1.5 g of HR tobacco per manufactured cigarette, with 1.0 g being taken for the reference results and the other conversion rates for a sensitivity analysis (Organisation for Economic Co-Operation and Development, 2017). The per capita figure was calculated with respect to the Spanish population aged ≥15 years for the period 2000–2015, using the population census figures published by the Spanish National Statistics Institute (Instituto Nacional de Estadística, 2015a).
Time variables
Two legislative initiatives were considered: in January 2006, a partial smoke-free ban was imposed under Act 28/2005, on tobacco control; then, in January 2011, a total smoke-free ban was implemented by Act 42/2010. Dummy variables were coded for each case, with values of 0 and 1, respectively, before and after each law came into force. The time trend was measured as the months elapsed during the study period. The slopes were defined as 0 before the introduction of the law and subsequently increased one-per-month, to 119 for Act 28/2005 and 59 for Act 42/2010. To control for seasonality and month-of-year effects, a dummy for each month, ‘calendar month’ was created, leaving March as the reference value.
Potential confounders
Prices and income are essential elements in the standard economic model of consumer demand. The quantities and prices of cigarettes bought and sold in competitive markets are determined simultaneously (Wilkins et al., Reference Wilkins, Yurekli and Hu2007). Failure to account for this simultaneous determination in a regression analysis of demand for tobacco products can lead to biased estimates being obtained. To consider this question, a Hausman specification test was performed considering the average minimum excise tax (MET) for manufactured and HR cigarettes and producer prices as suitable instruments for the price (Guindon et al., Reference Guindon, Paraje and Chaloupka2015). Producer prices are provided by the Spanish Tax Agency. The result confirms that price is not exogenous, at a 95% level of confidence (test statistic=−3.44, p=0.001). To offset the potential endogeneity of prices, two alternative analyses are proposed. First, the MET was used as a proxy of cigarette price. The use of taxes as a proxy of cigarette price is well established (Wilkins et al., Reference Wilkins, Yurekli and Hu2007). MET, in particular, was employed because Spain is one of the EU countries where cigarette prices are lowest, and in low-price countries, MET is more meaningful than other excise tax measures, such as ad valorem and specific taxes (Blecher et al., Reference Blecher, Ross and Stoklosa2014). Second, an instrumental variable (IV) model is estimated, using MET and producer prices as instruments for average prices.
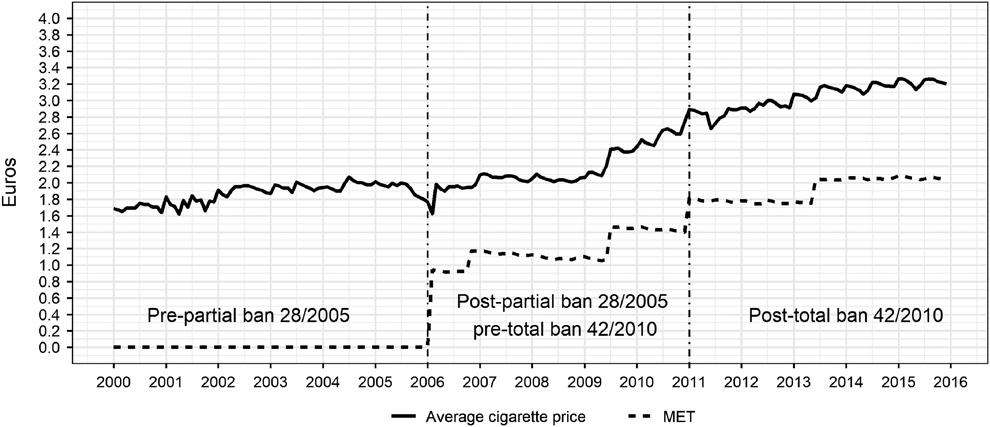
Figure 1 illustrates the strong correlation between prices and MET (r=0.91) and shows how both elements have evolved during the study period. An increase in the MET causes significant price increases and reduces price variations among brands. The MET acts as a tax floor and best represents variations in cigarette prices (López-Nicolás et al., Reference López-Nicolás, Cobacho and Fernández2013). The MET for manufactured cigarettes was introduced in Spain in February 2006. It was increased in November 2006, and subsequently four more times, reaching €128.65/1000 cigarettes and €96.5/1000 g in June 2013 and July 2013 for manufactured and HR cigarettes, respectively.
Average prices (per pack) for cigarette sales and average minimum excise tax (MET) in Spain during 2000–2015 (euros at constant 2000 prices).

Log-transformed household disposable income, from Spanish National Accounts, compiled quarterly (Instituto Nacional de Estadística, 2015b), was used as the indicator measure of average material well-being. The quarterly data were divided into monthly figures by cubic spline interpolation to achieve a regular frequency. However, this interpolation can cause autocorrelation, which must be taken into account by means of an appropriate regression analysis. Special attention was paid to the income elasticity of cigarette demand because this factor is relevant to the policies adopted. All monetary variables were adjusted for inflation using the consumer price index base 2000.
Statistical analysis
An interrupted time series analysis was used to model monthly per capita cigarette sales, in packs. The model takes the following form:
 $$Y_{t} {\equals}\beta _{0} {\plus}\beta _{1} T_{t} {\plus}\beta _{2} \,X_{{28\,/\,05}} {\plus}\beta _{3} X_{{28\,/\,05}} \cdot T_{t} {\plus}\beta _{4} X_{{42\,/\,10}} {\plus}\beta _{5} X_{{42\,/\,10}} \cdot T_{t} {\plus}\beta _{K} Z_{t} {\plus}\varrho _{t} ,$$
where Y t is the aggregated outcome variable, log-transformed per capita cigarette sales (in packs), T t the linear time trend variable since the start of the study, X 28/05 and X 42/10 represent the two intervention points, X 28/05 T t and X 42/10 T t are the interaction terms and Z t denotes the vector of the control variables: monthly dummy variables to control for seasonality, MET (or log-transformed average prices for IV regression) and log-transformed household disposable income.
Potential autocorrelation was considered by means of two regression analyses: ordinary least square (OLS) regression with Newey–West standardised errors and Prais–Winsten generalised least square (GLS) regression, in which errors are assumed to follow a first-order autoregressive (AR) process.
Two interrupted time series models were adjusted in a stepwise manner. Model 0 was unadjusted; model 1 was adjusted for seasonality, month-of-year effects and confounder variables. Durbin–Watson (DW) and Cumby–Huizinga (CH) tests were applied to ensure that the estimated model accounted for the correct autocorrelation structure. All data were analysed using STATA v.13 statistical software.
Results
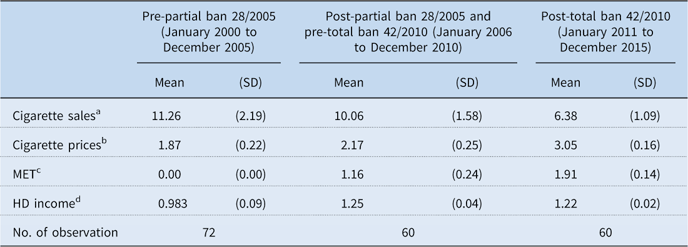
Table 1 reports the summary statistics, means and standard deviations, of the outcome and confounder variables, before and after the introduction of tobacco control legislation, under Acts 28/2005 and 42/2010. There was a significant decrease in average monthly cigarette sales during the period 2000–2015. Between the pre-partial ban and post-partial/pre-total ban periods, average sales decreased by 10.66%. However, during the post-total ban period, sales fell much more sharply, by 36.58%. The sensitivity analysis to different conversion rates from HR to manufactured cigarettes shows little variation. Considering conversion rates of 1.5 and 0.7 g/cigarette, average sales decreased by 11.44 and 37.94%, and by 9.60 and 34.99%, respectively. Average prices increased by 16.04% between the pre-partial and post-partial ban periods. During the post-total ban period, prices increased by 40.55%. The MET was implemented during the post-partial/pre-total ban period. Household disposable income increased between the pre-partial ban and post-partial/pre-total ban periods and fell slightly in the post-total ban period.
Summary statistics before and after the introduction of tobacco control laws 28/2005 and 42/2010

a Per-capita cigarette sales among adults aged 15 years or older in packs (1 g of hand-rolling tobacco was considered per manufactured cigarette).
b Average prices (euros per pack at constant 2000 prices).
c Average minimum excise tax (MET) (euros per pack at constant 2000 prices).
d Household disposable (HD) income (thousand euros at constant 2000 prices).
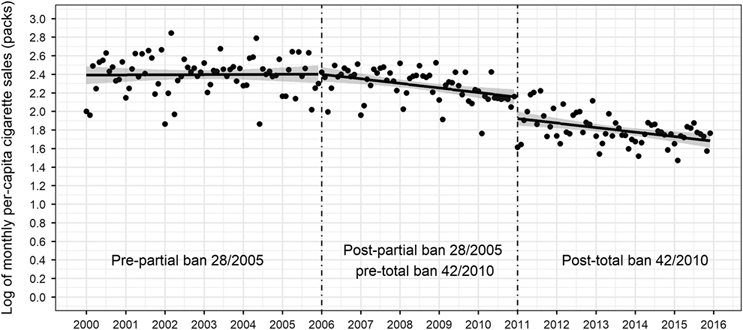
Figure 2 illustrates the unadjusted model results. The bold line represents the monotonic fitted monthly per capita cigarette sales during the study period 2000–2015. The slope prior to the first intervention (the partial ban) is close to zero, and in the period immediately following the introduction of the partial ban, in January 2006, the line shows a negative slope but no change in level. However, the fitted line shows an important change in level, while the slope remains unchanged, in the period immediately following the introduction of the total ban, in January 2011.
Observed and unadjusted model fitted trend of log per capita manufactured and hand-rolling cigarette sales. Prais–Winsten regression.

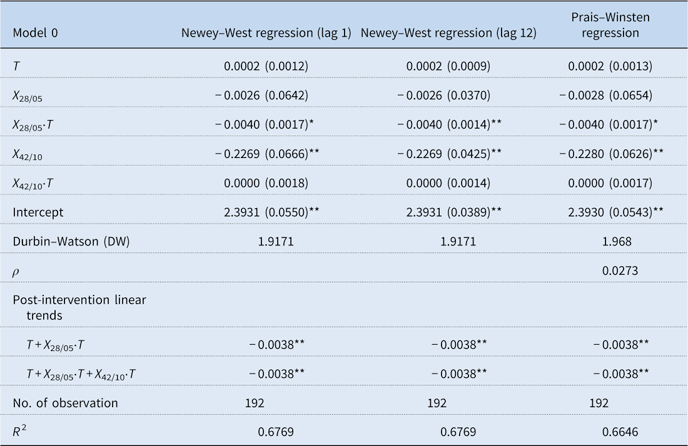
Table 2 presents the results of the model without covariates (model 0), with only two interventions, the partial and the total bans, as control variables. The first two columns show the OLS Newey–West standard error estimates using a lags of 1 and 12, while the third one contains the Prais–Winsten (AR1) regression estimates. The three regressions provide similar results.
Results of the interrupted time series analysis for log-transformed monthly per capita manufactured and hand-rolling cigarettes: unadjusted model

*Statistical significance at 5% level, ** at 1% level. Standard errors are given in parentheses. Critical values at 5% significance level for DW test (dL=1.519-dU=1.926).
The X 28/05 coefficient shows that there was no significant change in level after the introduction of the partial ban. However, the X 42/2010 coefficient reflects a significant change in level in the period immediately following the introduction of the total ban. In the first month following this intervention, there was a significant decrease in per capita cigarette sales, of 23% (p<0.01).Footnote 1 Model 0 also shows there was a significant negative trend in monthly sales after the introduction of the partial ban. This negative trend persisted after the introduction of the total ban. The values were −0.38% (p<0.01) and −0.38% (p<0.01), respectively. The results with different HR conversion rates, 0.7 and 1.5 g, provided similar outcomes, with significant decreases in per capita cigarette sales after the introduction of the total ban, of 22 and 23%, respectively.
The DW test for the Prais–Winsten regression corroborates the correct order of the autocorrelation process, with a test statistic of 1.968. From this, we conclude that there is no strong statistical evidence that the error terms are autocorrelated (critical values at the 5% significance level: d L=1.711–d U=1.817). The CH test for the errors of the OLS regression indicates that autocorrelation is present at lag 12. OLS Newey–West standard error estimates using lags of 1 and 12 were analysed.
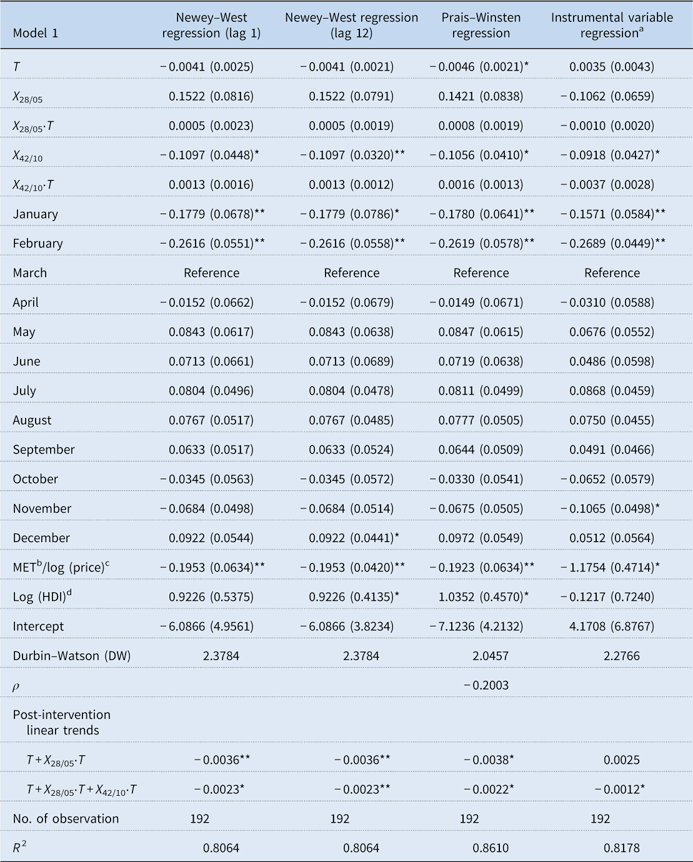
Table 3 presents the estimation results for model 1, adjusted for seasonality, month-of-year effects and confounder variables. Only the X 42/10 coefficient, the total ban, reflects a significant decrease in level in the period immediately following this intervention, with a significant average decrease in per capita cigarette sales that varies from 11% (p<0.05) to 9% (p<0.05) for the IV regression. With respect to the confounder variables, for a one-euro increase in MET per pack of cigarettes, we expect an average decrease of about 19% in per capita cigarette sales (p<0.01); moreover, a 1% increase in household disposable income would produce a significant increase in per capita cigarette sales, of 1.04% (p<0.05), although this effect is only found in two of the models considered. The IV regression estimates a long-run price elasticity of −1.1754.
Results of the interrupted time series analysis for log-transformed monthly per capita manufactured hand-rolling cigarettes: adjusted model

*Statistical significance at 5% level, ** at 1% level. Standard errors are given in parentheses. Critical values at 5% significance level for DW test (dL=1.519-dU=1.926).
a Newey–West standard errors (lag=1).
b Average minimum excise tax (MET) (euros per pack at constant 2000 prices).
c Log-transformed average prices (euros per pack at constant 2000 prices).
d Log-transformed household disposable income (HDI) (thousand euros at constant 2000 prices).
Finally, with respect to seasonality, there was a significant decrease in cigarette sales during the months of January and February, with an expected difference in per capita tobacco sales between these months and March of about 17 and 26%, respectively.
The DW statistic for the Prais–Winsten regression is 2.046, and so there is no statistical evidence that the error terms are autocorrelated. The CH test conducted after OLS regression revealed autocorrelation at lags 1 (p-value=0.0056) and 12 (p-value=0.0204). The OLS Newey–West, using lags 1 and 12, Prais–Winsten regression and IV Newey–West using lag 1 with generalised method of moments estimator were analysed. All these estimation methods produced very similar results.
The results of the Prais–Winsten regression with different HR conversion rates, 0.7 and 1.5 g, provided similar outcomes, with significant decreases in per capita cigarette sales after the introduction of the total ban, of 10 and 11.5%, respectively.
Discussion
Ireland (in May 2004) became the first European country to ban cigarette smoking in all enclosed public spaces and workplaces. This initiative was followed by similar moves in Norway (2004), Malta (2004), Italy (2005) and Sweden (2005) (European Network for Smoking Prevention, 2008). Smoking in public places in Italy, Malta and Sweden must be in separate smoking rooms with an adequate ventilation system. The Spanish law restricting smoking, Act 28/2005, was approved in late 2005 and implemented in 2006, providing an adaptation period of eight months. Spanish law diluted the above European legislation, by enabling the possibility of partial restrictions. First, the Spanish law accepted the possibility that bars, restaurants and other hospitality establishments, with a net surface area of 100 m2 or more, could create smoking areas, providing they were sufficiently separated from non-smoking areas. Second, in the case of establishments with a net surface area of less than 100 m2, the owner could decide whether or not to allow smoking on the premises.
The ‘Spanish Model’ contemplates two important distinctions in its implementation: on the one hand, between workplaces in general and those in the hospitality sector; and on the other, between large and small catering establishments (Toledo, Reference Toledo2006). Bar and restaurant owners exerted a great deal of pressure while the law was being drawn up. The hospitality industry is a strategic sector within the Spanish economy, accounting for about 7% of gross domestic product. According to the Spanish Hospitality Federation (FEHR), gross turnover in the sector in 2006 exceeded 100 billion euros, with 80% of this amount corresponding to restaurants, cafes and bars (Calderón et al., Reference Calderón, Barruso, Mingorance and Rueda2010). The FEHR claimed that with the entry into force of the new law, bars and restaurants would lose 1.6 billion euros in sales, which would provoke the loss of 20,000 jobs. The government ceded to these pressures and included exceptions in the smoke-free law for the hospitality sector.
However, later studies showed that none of these catastrophic economic effects occurred (Pinilla and Negrín, Reference Pinilla and Negrín2010), mainly because this law led to few significant changes in the availability of smoke-free premises in the hospitality sector: 90–95% of bars and cafes with a net surface area of less than 100 m2 allowed their customers to smoke (Fernández, Reference Fernández2006); in larger establishments, over 84% permitted smoking in adapted rooms, while only 16% were totally smoke free. According to the Healthcare Barometer 2006 (Centro de Investigaciones Sociológicas, 2006) around half of the population perceived that smokers were not respecting the law. In addition, there were other shortcomings such as the lack of a plan for evaluating the impact of the legislation (Galán and López, Reference Galán and López2009). This might explain why the partial ban had no significant effect in Spain, according to our own study and others (López et al., Reference López, Nebot, Schiaffino, Pérez-Ríos, Fu, Ariza, Muñoz and Fernández2012). A cohort study showed that the partial ban of 2006 did not protect the workers of the hospitality sector in Spain (Sargent et al., Reference Sargent, Shepard and Glantz2004; Fernández et al., Reference Fernández, Fu, Pascual, López, Pérez-Rios, Schiaffino, Martínez-Sánchez, Ariza, Saltó and Nebot2009). Thus, Act 28/2005 did not achieve its purpose, and five years later, in January 2011, it was substantially amended by Act 42/2010, which mandated a total ban on smoking in indoor public places and indoor workplaces.
Our results show that the implementation of a total smoke-free ban in Spain, under Act 42/2010, was associated with an immediate fall in cigarette sales. After adjusting for time trends, seasonal variations, average prices (or average MET) and household disposable income, there was seen to be an average decrease between 9% and 11% in cigarette sales immediately following the introduction of the total ban, which suggests that the total removal of exposure to tobacco smoke effectively reduced tobacco consumption. By contrast, in the period immediately following the introduction of the partial ban, no reduction in cigarette sales was detected, beyond the pre-existing trend effects. These findings are in line with other sources of information, such as the Spanish National Health Survey (SNHS) and the Household Budget Survey (HBS). A similar analysis of the effect of tobacco prices and the implementation of smoke-free legislation on smoking cessation, based on SNHS data, found that smoke-free laws, in general, without distinguishing between the partial and total bans, reduced tobacco consumption in the short term and also altered pre-existing trends, during the period 1993–2012 (Regidor et al., Reference Regidor, Pascual, Giráldez-García, Galindo, Martínez and Kunst2015).
Several studies (Levy et al., Reference Levy, Yuan, Luo and Mays2016; Gravely et al., Reference Gravely, Giovino, Craig, Commar, D’Espaignet, Schotte and Fong2017; Ngo et al., Reference Ngo, Cheng, Chaloupka and Shang2017) have evaluated the reduction in smoking prevalence and the smoking-attributable deaths averted after the implementation of WHO-FCTC measures. As a general conclusion, these papers demonstrate the huge impact of tobacco control measures: thus, cigarette consumption fell by 13.8 percentage points in countries where the MPOWER measures were implemented at the highest level, and 22 million fewer smoking-attributable deaths were projected in the 88 countries which adopted at least one highest-level MPOWER policy. In 2017, Spain has reached the highest level in four of the six MPOWER measures (monitoring, smoke-free policies, advertising bans and taxation).
Nagelhout et al. (Reference Nagelhout, de Vries, Boudreau, Allwright, McNeill, van den Putte, Fong and Willemsen2012) compared the impact of comprehensive and partial smoke-free legislation on smoking cessation and concluded that comprehensive smoke-free legislation in Ireland and England had had positive effects on attempts to quit and on successful quitting. However, the partial law enacted in the Netherlands had had no such effect.
A more extensive review of the impact of different legislative smoking bans in reducing harm from ETS, on smoking prevalence and tobacco sales can be found in Frazer et al. (Reference Frazer, Callinan, McHugh, van Baarsel, Clarke, Doherty and Kelleher2016). In particular, Cesaroni et al. (Reference Cesaroni, Forastiere, Agabiti, Valente, Zuccaro and Perucci2008) documented a drop of 5.5% in cigarette sales in 2005 compared with 2004, after the implementation of smoke-free legislation in Italy (the law allows designated smoking rooms in hospitality venues). Warren et al. (Reference Warren, Erguder, Lee, Lea, Sauer, Jones and Bilir2012) reported a decrease of 10.7% in cigarette sales following Turkey’s implementation of a strict smoke-free law. Our findings are in line with those observed in the literature.
Our results highlight the existence of a seasonal pattern in tobacco consumption, with a significant reduction in cigarette sales in January and February, possibly influenced by the climate, the timing of regulation changes and/or the adoption of New Year’s resolutions to quit smoking (Chandra and Chaloupka, Reference Chandra and Chaloupka2003).
The findings presented show that a rise in cigarette taxes is associated with reduced cigarette sales in Spain. In the present study, tax elasticity was not determined, since MET is not log-transformed. However, considering the average MET for the study period (1.02 euros) the tax elasticity is approximately −0.196. Tax elasticity is generally lower than price elasticity because the tax is a proportion of retail price. Most of the econometric studies conducted in high-income industrialised countries have concluded that the overall price elasticity of demand is about –0.5 (Yeh et al., Reference Yeh, Schafferer, Lee, Ho and Hsieh2017). IV regression estimates a long-run price elasticity of −1.1754. In the long run, price elasticity is estimated to be higher (more sensitivity) than in the short run. Our analysis shows a slightly higher elasticity to that obtained in other European countries, such as Sweden (−0.81), the Netherlands (from −0.45 to −1.03) or Italy (from −0.31 to −1.07) (WHO, 2010).
Two models find a positive relationship between real disposable income and cigarette sales, suggesting that consumption increases with income. The income elasticity was estimated, by the Prais–Winsten regression, to be 1.04 (corresponding to a luxury good) although the 95% confidence interval is very wide (confidence interval=0.14; 1.93). This income elasticity estimate is relatively high but in line with other results based on data from Spain and other European countries. Nguyen et al. (Reference Nguyen, Rosenqvist and Pekurinen2012) estimated an income elasticity between 0.822 and 0.916 in their analysis of an annual time series for the period 1960–2009, with values ranging from 0.1 in Italy to 1.2 in Sweden.
The recent appearance in the market of e-cigarettes may pose a risk to compliance with the smoke-free laws. In Spain, Act 3/2014 (2014) regulates the use of these cigarettes. They are banned in most indoor public places but are permitted in bars, restaurants, pubs and discos. Nevertheless, and in spite of the restrictions imposed on conventional cigarettes and their increased prices, the prevalence of e-cigarettes remains low in Spain (2%) (Lidón-Moyano et al., Reference Lidón-Moyano, Martínez-Sánchez, Fu, Ballbè, Martín-Sánchez and Fernández2016).
Our study presents certain limitations. A potential interfering factor is that an important proportion of cigarette sales in Spain correspond to purchases by non-residents (Lakhdar, Reference Lakhdar2008; Nagelhout et al., Reference Nagelhout, van den Putte, Allwright, Mons, McNeill, Guignard, Beck, Siahpush, Joossens, Fong, de Vries and Willemsen2014). Tourism is the country’s main economic activity and a large majority of visitors arrive from the United Kingdom, Germany and France. In both the United Kingdom and France, there is a considerable price differential for cigarettes, with respect to Spain, which has persisted over time, thus encouraging visitors to buy in Spain. Despite recent tax increases, Spain continues to have some of the lowest tobacco prices in Western Europe. On the other hand, our analysis does not reveal any significant increase in tobacco sales during the peak tourism season in Spain.
Another factor is that official sales do not include the illicit retail trade in cigarette sales, including counterfeiting and smuggling, and therefore a variable portion of cigarette sales is not taken into consideration. However, in the past few years smuggling has decreased in Europe. Spain is one of the countries with <5% illicit market share, together with Denmark, Italy, Portugal and Sweden (Prieger and Kulick, Reference Prieger and Kulick2016).
During our study period, many other tobacco control measures were applied in Spain. The two laws analysed also included the regulation of tobacco advertising, promotion and sponsorship, and this may also have affected tobacco consumption (Kasza et al., Reference Kasza, Hyland, Brown, Siahpush, Yong, Mc Neill, Li and Cummings2011). In fact, the advertising, promotion and sponsorship of tobacco were already banned under Act 28/2005, and Act 42/2010 only provided a more restrictive specification of the ban; accordingly, this is not expected to be a very significant factor in the reduction in cigarette sales from 2011.
Other regulatory changes that occurred during the study period were Royal Decree 1079/2002 (2002) and its later amendment (Royal Decree 639/2010, 2010). These Decrees regulate the maximum levels of nicotine, tar and carbon monoxide in cigarettes, and the labelling of tobacco products. Although health warning messages on tobacco products may have a measurable impact on tobacco sales (Hammond, Reference Hammond2011), their evaluation in an interrupted time series analysis is not feasible because these regulations established a transitional period for application of up to two years.
Strengths of the data used in this study include the relatively long follow-up period after the two interventions and the use of monthly data. Furthermore, interrupted time series analysis itself provides a number of strengths, including the assessment of changes in level and trend before and after an intervention, as well as the fact that the secular trend, the confounder variables, seasonality and autocorrelation are taken into account. In addition, the use of official sales data allowed us to consider the cigarette consumption of teenagers and young adults living with their parents, in contrast to the statistics reported in SNHS and the HBS.
Conclusions
The implementation of a total smoke-free law in Spain was associated with an immediate fall in cigarette sales, indicating that the total removal of exposure to tobacco smoke was effective in reducing tobacco consumption. In contrast, in the period immediately following the partial ban, no such reduction was observed, beyond the trend effect. The results obtained indicate that, in Spain, partial bans on smoking in public places failed, and that only a total tobacco ban worked.
Acknowledgements
This research has been partially supported by the Grants ECO2017-83771-C3-2-R and ECO2017-85577-P (MINECO, Spain).