Introduction
Metallorganic vapor phase epitaxy (MOVPE) is currently being used to grow GaN for the fabrication of blue light emitting diodes [Reference Nakamura, Senoh, Iwasa, Nagahama, Yamada and Mukai1], lasers [Reference Nakamura, Senoh, Nagahama, Iwasa, Matushita and Mukai2] and for high power electronic devices [Reference Mohammad, Salvador and Morkoc3]. For MOVPE growth, NH3 is typically used as the N source and high temperatures (> 1000 °C) are required to efficiently dissociate (i.e. 40-50 %) the NH3 [Reference Liu and Stevenson4], because of the large N-H bond strength [Reference Weast5]. As a result, MOVPE growth temperatures are 100-500 degrees Celsius larger than the threshold temperature for GaN decomposition in vacuum [Reference Groh, Gerey, Bartha and Pankove6,Reference Grandjean, Massies, Semond, Karpov and Talalaev7] and in H2 and N2 [Reference Koleske, Wickenden, Henry, Twigg, Culbertson and Gorman8,Reference Koleske, Wickenden, Henry, Twigg, Culbertson and Gorman9]. The high rate of N2 desorption is compensated by using large flows of NH3 [Reference Koleske, Wickenden, Henry, DeSisto and Gorman10], however the extent of GaN decomposition that occurs during growth has not been measured.
The recent studies of Grandjean et al. [Reference Grandjean, Massies, Semond, Karpov and Talalaev7] and Rebey et al. [Reference Rebey, Boufaden and Jani11] have shown dramatic decreases in the GaN decomposition rate when small NH3 flows are dosed onto GaN surface. For example, Grandjean et al. measure a GaN decomposition rate of 5 Å/s at 875 °C in vacuum, while under an NH3 flux of 1.7×1017 cm−2 s−1, the decomposition rate drops to 0.03 Å/s [Reference Grandjean, Massies, Semond, Karpov and Talalaev7]. To explain the decrease in the GaN decomposition rate in NH3, a site-blocking model has been proposed where the adsorbed NH3 blocks sites necessary for N2 formation and desorption [Reference Grandjean, Massies, Semond, Karpov and Talalaev7]. A similar site blocking mechanism has also been proposed to explain reduced GaN growth when the NH3 flux is increased [Reference Briot, Clur and Aulombard12]. In this paper we suggest that H also blocks sites on the GaN surface and H surface coverage effects must be considered in order to properly describe the GaN decomposition and growth kinetics.
Experimental Details
Details of the GaN growth [Reference Wickenden, Koleske, Henry, Gorman, Culbertson and Twigg13] and decomposition [Reference Koleske, Wickenden, Henry, Twigg, Culbertson and Gorman8,Reference Koleske, Wickenden, Henry, Twigg, Culbertson and Gorman9] are discussed elsewhere. The GaN films used in this study were grown and decomposed in a close-spaced showerhead MOVPE reactor. The growth and decomposition rates were determined from weight loss using an analytical balance [Reference Koleske, Wickenden, Henry, Twigg, Culbertson and Gorman8]. The GaN films were grown at 1030 °C using 32 µmoles of trimethylgallium (TMGa), 2 SLM NH3 and 4 SLM of H2 at pressures ranging from 40 to 300 torr. GaN decomposition was studied under similar flow conditions as the growth. The measured weights were converted to growth and decomposition rates per surface area (i.e. cm−2s−1) following Ref. 10. Expressed this way, a rate of 1.14×10¹⁵ cms−2 s−1 corresponds to a thickness of 1 µm per hour. Temperature was calibrated by observing the melting point of 0.005” diameter Au wire on sapphire and correlating it to a thermocouple in direct contact with the susceptor underside [Reference Koleske, Wickenden, Henry, Twigg, Culbertson and Gorman8]. After 2 years of use the set point temperature needed to melt the Au wire was reproducible to within 10 °C.
Results
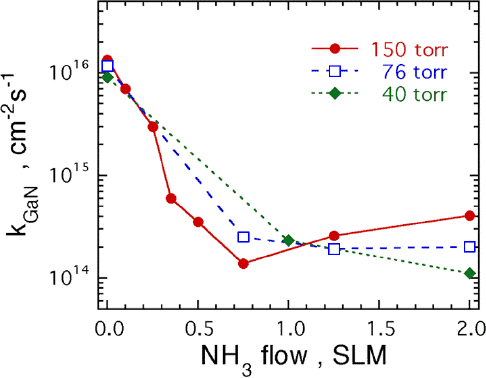
The change in the GaN decomposition rate, kGaN, at a temperature of 992 °C as NH3 is substituted for the H2 flow is shown in Fig. 1. In Fig. 1, kGaN is plotted as the NH3 flow is increased from 0 to 2 SLM for pressures of 40, 76, and 150 torr. The total flow rate was kept constant at 6 SLM with the balance being H2. Note that kGaN decreases from ≈ 1×1016 cm−2s−1 to ≈ 1×1014 cm−2s−1 as the NH3 flow increases. At 150 torr, the minimum kGaN occurs at a flow of 0.75 SLM of NH3. At 76 torr, the kGaN minimum occurs between 1.25 and 2.0 SLM of NH3. At 40 torr no minimum in kGaN is observed. At 150 torr and a flow of 2 SLM of NH3, kGaN is ≈ 4×1014 cm−2s−1.
Plot of the GaN decomposition rate as a function of the NH3 flow rate at three different pressures. For this plot the GaN was heated to a temperature of 992 °C using H2 and NH3 for a total flow of 6 SLM.

In Fig. 2, the data from Fig. 1 are replotted as a function of the NH3 gas density, which depends on pressure. In Fig. 2, it appears that the kGaN measured at different pressures have a common minimum at a NH3 density of ≈ 1×1019 cm−3. This NH3 density is the same order of magnitude as the calculated N desorption rate from GaN, which should be 9×1019 cm−2s−1 at 992 °C [Reference Koleske, Wickenden, Henry, DeSisto and Gorman10]. Two different dependencies of kGaN on the NH3 density are evident in Fig. 2. At lower NH3 density, the kGaN drops steeply as the NH3 density increases from 3×1017 cm−3 to a value of near 1×1019 cm−3. For NH3 densities greater than 1×1019 cm−3, kGaN increases. This differs from the behavior observed by Grandjean et al., where kGaN only decreased for increasing NH3 flow [Reference Grandjean, Massies, Semond, Karpov and Talalaev7].
Plot of the GaN decomposition rate measured as a function of the NH3 density at 992 °C. The filled circles (red) were measured at 150 torr, the open squares (blue) were measured at 76 torr, and the filled diamonds (green) were measured at 40 torr. The lines are fits to the data using the expression kGaN = a + b[NH3] + c[NH3] x . For the fits the values of a and b are the same, while the value of x is fixed from −1.0 to −3.0 and c is varied for the best fit.

To determine the dependence of kGaN on the NH3 density, [NH3], separate fits were calculated for [NH3] both less than and greater than 1×1019 cm−3. For [NH3] < 1×1019 cm−3, a functional form of kGaN = c[NH3] x was used and the data were fit by varying c, keeping x constant. For [NH3] > 1×1019 cm−3, a linear functional form, kGaN = a + b[NH3], fit the data well. The series of lines shown in Fig. 2 are a combination of the two fits (i.e. kGaN = a + b[NH3] + c[NH3] x ). For the combined fits, 5 curves were calculated for 5 values of x ranging from −1.0 to −3.0, keeping the linear fit constant. Clearly, the data are best fit using with x = −1.5 to −2.0.
Similar to NH3, the GaN decomposition rate in N2 is lower when compared to the rates measured in H2 [Reference Koleske, Wickenden, Henry, Twigg, Culbertson and Gorman9], however, in mixed N2 and H2 flows the rate is substantially larger than in mixed NH3and H2 flows. This is shown in Fig. 3, where kGaN is plotted vs. the N2 fraction of the total flow (i.e. [N2] + [H2]). For these measurements, the GaN films were annealed at 992 °C at pressures of 76 and 150 torr. In Fig. 3, kGaN at 150 torr is reduced from 1.6×1016 cm−2s−1 in pure H2 to 3.5×1014 cm−2s−1 in pure N2 (factor of 45). For a 1:1 mixture of N2 and H2 at 150 torr, kGaN decreases slightly to 8×1015 cm−2s−1, which is a factor of 2 compared to kGaN in pure H2. This is a significantly smaller decrease when compared to the decrease in a 1:2 mixture of NH3 and H2 (factor of 120). Note that kGaN in pure N2 and in mixed H2 and NH3 flows can be similar. For example in pure N2, kGaN is 3.5×1014 cm−2s−1, while in mixed H2 and NH3 at 150 torr, kGaN is 4×1014 cm−2s−1, as shown in Fig. 1. The solid and dashed lines in Fig. 3 are cubic fits to the kGaN vs. N2 fraction. The cubic dependence is a result of the expected dependence of surface H coverage (i.e. [H]3) for ammonia formation via the reaction 3H + N → NH3. Previously, Thurmond and Logan also demonstrated NH3 formation when GaN is heated in H2 by titration of the basic exhaust gas [Reference Thurmond and Logan14].
Plot of the GaN decomposition rate vs. the ratio of the N2 concentration to the total (i.e. N2 + H2) gas concentration. The GaN decomposition rate is shown at total pressures of 76 and 150 torr. The solid and dashed lines are cubic fits to the data.

In Fig. 4, the GaN decomposition and growth rates are plotted vs. pressure. In Fig. 4(a), kGaN is plotted for GaN films annealed at 992 °C in H2 [Reference Koleske, Wickenden, Henry, Twigg, Culbertson and Gorman8]. Also in Fig. 4(b), the GaN growth rate at 1030 °C is plotted for conditions where 2 SLM NH3, 4 SLM H2, and 32 µmoles of TMGa were used. Finally, in Fig. 4(c) the GaN decomposition rate is plotted using the same conditions as (b) except no TMGa was used and hence decomposition was observed. Note that the decrease in the GaN growth rate as the pressure increases in Fig. 4(b) coincides with an increase in the GaN decomposition rate in Fig. 4(c). Also, the kGaN shown in Figs. 4(a) and 4(c) have a similar shape as the pressure increases and these curves are nearly identical if the kGaN in Fig 4(c) are multiplied by 30. This similarity in shape implies that surface H plays a similar role in the GaN decomposition for both pure H2 and mixed NH3 and H2 gas environments.
Pressure dependence of the a) GaN decomposition rate in 6 SLM H2 measured at T = 992 °C, b) GaN growth rate using, 32 µm TMGa, 2 SLM NH3 and 4 SLM H2 at T = 1030 °C, and c) GaN

Discussion and Conclusions
From the data presented in Fig. 1, the GaN decomposition rate is greater than 1×1014 cm−2s−1 (i.e. ≈ 1/10 μm/hour) even in mixed NH3 and H2 flows. This is important for GaN growth because it suggests that some level of decomposition occurs during decomposition rate using 2 SLM NH3 and 4 SLM H2 at T = 1030 °C. The only difference between b) and c) is the use of TMGa in b).
growth as previously speculated [Reference Koleske, Wickenden, Henry, DeSisto and Gorman10]. Currently, we are growing GaN at a pressure of 130 torr and a temperature of 1030 °C [ Reference Wickenden, Koleske, Henry, Gorman, Culbertson and Twigg13]. Under these growth conditions, the rates for growth and decomposition are 1.2×1015 cm−2s−1 and 4×1014 cm−2s−1 respectively as shown in Fig. 4. If the growth rate equals the incorporation rate minus the decomposition rate [Reference Koleske, Wickenden, Henry, DeSisto and Gorman10], this means that the incorporation rate is ≈ 4 times decomposition rate under these growth conditions.
The decrease in kGaN as the NH3 density increases is due to NH3 adsorption, which blocks sites needed for GaN decomposition. As shown in Fig. 2, the decrease in kGaN depends on the −1.5 to −2.0 power of the NH3 density. Since Ga desorption from GaN has been shown to be independent of H2 pressure [Reference Koleske, Wickenden, Henry, Twigg, Culbertson and Gorman8], reactions which remove N from the lattice probably influence the GaN decomposition rate more. This is clearly observed in the cubic dependence of kGaN in Fig. 3 where NH3 formation is favored at higher pressure. For N2 formation and desorption one or both of the N atoms diffuse across the surface until they combine to form N2. If open surface sites are necessary for N diffusion, blocking of these sites by NH3 or H would decrease the hopping rate and as a consequence the N2 formation rate would be decreased. If two (one) N must migrate for N2 formation, the N2 desorption kinetics would be second (first) order in the number of open surface sites. As the NH3 density on the surface increases, the decrease in the GaN decomposition rate should be between first and second order, i.e. kGaN α [NH3]−1 or kGaN α [NH3]−2, depending on the details of N2 formation and desorption. From Fig. 2, it is clear that the decrease in kGaN vs. NH3 density is closer to second order (power of −2) than first order.
At higher NH3 densities (> 1×1019 cm−3), the GaN decomposition rate increases linearly. This may be due to a decrease in the NH3 site blocking suppression of N2 desorption or a general increase in the H surface coverage. The increased H coverage could block sites necessary for NH3 adsorption. Surface H has also been shown to aid in NH3 adsorption and dissociation on GaN [Reference Bartram and Creighton15] and on Al [Reference Kim, Bermudez and Russell16]. In addition, large H coverage can favor NH3 reformation and desorption by combining with adsorbed NHx species as suggested by Fig. 3. In contrast to NH3, site blocking with H should lead to an increase in the decomposition rate.
Several groups have observed decreases in growth rate when H2 is used in place of N2 [Reference Ambacher, Brandt, Dimitrov, Metzger, Stutzmann, Fischer, Miehr, Bergmaier and Dollinger17, Reference Hashimoto, Amano, Sawaki and Akasaki18], when the growth pressure is increased [Reference Khan, Skogman, Schulze and Gershenzon19], and when higher NH3 fluxes are used for growth [Reference Briot, Clur and Aulombard20]. In Fig. 4(b), the GaN growth rate decreases as the growth pressure increases. It is clear from Fig. 4(c) that the reason the growth rate decreases is because the increased GaN decomposition at higher pressures. However, to fully explain the reduction in the growth rate, the full effect of gas phase depletion of the TMGa also needs to be considered.
GaN grown in H2, where GaN decomposition is enhanced compared to N2, appears to have better crystalline order compared to GaN growth in N2. Kistenmacher et al have shown that the FWHM of the GaN films grown in H2 had narrower x-ray rocking curve linewidths and were better aligned compared (i.e. smaller mosaic dispersion) to GaN films grown in only N2 [Reference Kistenmacher, Wickenden, Hawley and Leavitt21]. Better alignment is also observed in laterally overgrown GaN when H2 is used instead of N2 [Reference Tadatomo, Ohuchi, Okagawa, Itoh, Miyake and Hiramatsu22]. Schön and coworkers find smoother morphologies and better electrical properties when growth is conducted in H2 compared to N2 [Reference Schön, Schineller, Heuken and Beccard23]. Better electrical properties are observed for GaN grown at higher pressures where GaN decomposition is enhanced [Reference Wickenden, Koleske, Henry, Gorman, Culbertson and Twigg13, Reference Bell, Smith, McDermott, Gertner, Pittman, Pierson and Sullivan24, Reference Ng, Han, Biefeld and Weckwerth25]. Recently, we have observed a near doubling of electron mobility in films grown at 150 torr compared to 76 torr, keeping all other growth parameters the same [Reference Wickenden, Koleske, Henry, Gorman, Culbertson and Twigg13]. In this study, growth at higher pressure led to increased GaN grain size in the films [Reference Wickenden, Koleske, Henry, Gorman, Culbertson and Twigg13], suggesting that the increased GaN decomposition at higher pressure plays a significant role in determining the grain size of the GaN film.
Acknowledgements
We thank V.A. Shamamian, V.M. Bermudez, R.J. Gorman, M.E. Twigg, J. Freitas, M. Fatemi, and J.C. Culbertson for discussions and characterization of the films. This work is supported by the Office of Naval Research.