Implications
Intramuscular fat (IMF) content is related to the eating quality of the meat and it is an important characteristic to improve meat quality. To know the pattern of muscle growth and deposition of IMF by genotype, sex and weight is important for breeding companies, producers and the meat industry to choose the best slaughter time to obtain the desired product regarding this characteristic. This work presents the IMF content and muscle weight by genotype-sex, muscle, muscle location and weight of the pig.
Introduction
Intramuscular fat is an adipose tissue deposited within the lean tissue. Some previous works showed that its content depends on the breed or genotype (Plastow et al., Reference Plastow, Carrión, Gil, Garcı́a-Regueiro, Font i Furnols, Gispert, Oliver, Velarde, Guàrdia, Hortós, Rius, Sárraga, Dı́az, Valero, Sosnicki, Klont, Dornan, Wilkinson, Evans, Sargent, Davey, Connolly, Houeix, Maltin, Hayes, Anandavijayan, Foury, Geverink, Cairns, Tilley, Mormède and Blott2005; Tyra et al., Reference Tyra, Ropka-Molik, Terman, Piórkowska, Oczkowicz and Bereta2013), sex (Gispert et al., Reference Gispert, Àngels Oliver, Velarde, Suarez, Pérez and Font i Furnols2010; Jeong et al., Reference Jeong, Kim, Ha, Park, Park, Joo and Lee2012; Škrlep et al., Reference Škrlep, Batorek, Bonneau, Prevolnik, Kubale and Čandek-Potokar2012), diet (Huang et al., Reference Huang, Zhan, Luo, Liu and Peng2008; Cordero et al., Reference Cordero, Isabel, Menoyo, Daza, Morales, Piñeiro and López-Bote2010; Lambe et al., Reference Lambe, Wood, McLean, Walling, Whitney, Jagger, Fullarton, Bayntun and Bünger2013) and age/weight (Bosch et al., Reference Bosch, Tor, Reixach and Estany2012; Tyra et al., Reference Tyra, Ropka-Molik, Terman, Piórkowska, Oczkowicz and Bereta2013). However, some of these factors have not had a clear effect in other works; for instance, Jeong et al. (Reference Jeong, Kim, Ha, Park, Park, Joo and Lee2012) did not find an effect of the diet and weight and Lambe et al. (Reference Lambe, Wood, McLean, Walling, Whitney, Jagger, Fullarton, Bayntun and Bünger2013) did not find an effect of weight. In addition, there are differences in IMF content depending on the exact muscle (Lambe et al., Reference Lambe, Wood, McLean, Walling, Whitney, Jagger, Fullarton, Bayntun and Bünger2013; Tyra et al., Reference Tyra, Ropka-Molik, Terman, Piórkowska, Oczkowicz and Bereta2013) and within the same muscle (Faucitano et al., Reference Faucitano, Rivest, Daigle, Lévesque and Gariepy2004). Furthermore, some works show a relationship between IMF and meat palatability and eating quality and on consumers’ acceptability (Brewer et al., Reference Brewer, Zhu and McKeith2001; Font-i-Furnols et al., Reference Font-i-Furnols, Tous, Esteve-Garcia and Gispert2012), although this has not been confirmed in other works (Channon et al., Reference Channon, Kerr and Walker2004; Moeller et al., Reference Moeller, Miller, Edwards, Zerby, Logan, Aldredge, Stahl, Boggess and Box-Steffensmeier2010). Because of the inconsistency in previous findings, it is important to increase knowledge about the growth of IMF tissue and its content depending on the muscle, genotype, sex and weight of the animals.
The knowledge about IMF content in live pigs is important mainly for breeding and nutritional purposes, and several technologies mainly based on ultrasound have been evaluated in live pigs and in carcasses with variable results (Newcom et al., Reference Newcom, Baas and Lampe2002; Lakshmanan et al., Reference Lakshmanan, Koch, Brand, Männicke, Wicke, Mörlein and Raum2012; Kvam and Kongsro, Reference Kvam and Kongsro2017). Computed tomography (CT) is a non-invasive technology based on X-rays used for breeding purposes. X-rays pass through the object and are attenuated in different degrees depending on the density of the tissues they cross by and, this attenuation, is measured in Hounsfield units (HU). Lean has positive HU values from 0 to +140 and fat has negative HU values from 0 to −149 approximately (Font-i-Furnols et al., Reference Font-i-Furnols, Carabús, Pomar and Gispert2015), although the limits can change between works. As far as the authors know, only two works have studied the possibility of using CT to estimate IMF content in live pigs, those from Kongsro and Gjerlaug-Enger (Reference Kongsro and Gjerlaug-Enger2013) that concluded that CT is not feasible for this purpose, and those from Lambe et al. (Reference Lambe, Wood, McLean, Walling, Whitney, Jagger, Fullarton, Bayntun and Bünger2013) that concluded that CT has a great potential to determine IMF in live pigs. Thus, further work is needed to evaluate the feasibility of CT to predict IMF in live pigs. The aim of the present work was to determine the patterns of IMF by genotype-sex, muscle and muscle location, to evaluate relationships between IMF content of different muscles and to predict IMF in live pigs with CT.
Material and methods
Animals
A total of 182 pigs were used that came from two experiments. Pigs were from seven combinations of genotype and sex: Pietrain×(Landrace×Large White) gilts (PL-F), Landrace×Large White gilts (LL-F), Duroc×(Landrace×Large White) gilts (DL-F), Pietrain×(Landrace×Duroc) gilts (PD-F), Pietrain× (Landrace×Duroc) entire males (PD-M), Pietrain×(Landrace×Duroc) surgically castrated males (PD-C) and Pietrain×(Landrace×Duroc) immunocastrated males (PD-I) (two vaccines, one at 12 weeks and the other one at 18 weeks of age) (Carabús et al., Reference Carabús, Sainz, Oltjen, Gispert and Font-i-Furnols2015). There were no parental relationships within the breeds, except for PD-F, PD-M, PD-C and PD-I. Pigs were managed a standard way, fed a commercial diet ad libitum (Supplementary Material S1) and when they reach the desired live target BW (TBW) they were CT scanned and, the same day after the scan, they were slaughtered. No withdrawal period was necessary because meat from pigs was not used for consumption. A total of 27 pigs (4 to 5 per genotype-sex, except PD-I because at 30 kg immunocastration was not performed yet and they were the same as PD-M) were slaughtered at 30 kg (TBW), 31 pigs (4 to 5 per genotype-sex) were slaughtered at 70 kg TBW, 32 pigs (4 to 5 per genotype-sex) at 100 kg TBW and 92 pigs (11 to 16 per genotype-sex) at 120 kg (TBW) (Table 1). Slaughter was performed at the experimental abattoir at IRTA Monells following standard commercial procedures and after stunning with CO2.
Number of pigs scanned, slaughtered and sampled (muscle weight and intramuscular fat (IMF)) by genotype-sex and target BW (TBW), total number of muscles evaluated by genotype-sex and mean live weight and warm carcass weight by TBW

PD-C=Pietrain×(Landrace×Duroc) surgically castrated males; PD-F=Pietrain×(Landrace×Duroc) gilts; PD-I=Pietrain×(Landrace×Duroc) immunocastrated males; PD-M=Pietrain×(Landrace×Duroc) entire males; DL-F=Duroc×(Landrace×Large White) gilts; LL-F=Landrace×Large White gilts; PL-F=Pietrain×(Landrace×Large White) gilts.
1 At 30 kg only the weight of the muscles was measured.
2 Total numbers of samples evaluated for IMF considering that for each genotype-sex and TBW, six different muscles/locations were analyzed.
3 At 30 kg, the immunocastrated pigs were entire male pigs.
4 Mean±standard deviation.
Computed tomography scanning and image analysis
Before slaughter, live pigs of 70, 100 and 120 kg TBW were scanned with the General Electric HiSpeed Zx/I CT (GE Healthcare, Madrid, Spain) equipment placed at IRTA-CENTA (Monells). Scanning conditions were 140 kV, 145 mA, axials 1 s, 10-mm thick (Font-i-Furnols et al., Reference Font-i-Furnols, Carabús, Pomar and Gispert2015). Before scanning, pigs were anaesthetized by intramuscular injection of azaperone at 0.1 mg/kg and ketamine at 0.2 mg/kg or intravenous injection of propofol at 0.2 mg/kg only at 100 and 120 kg TBW.
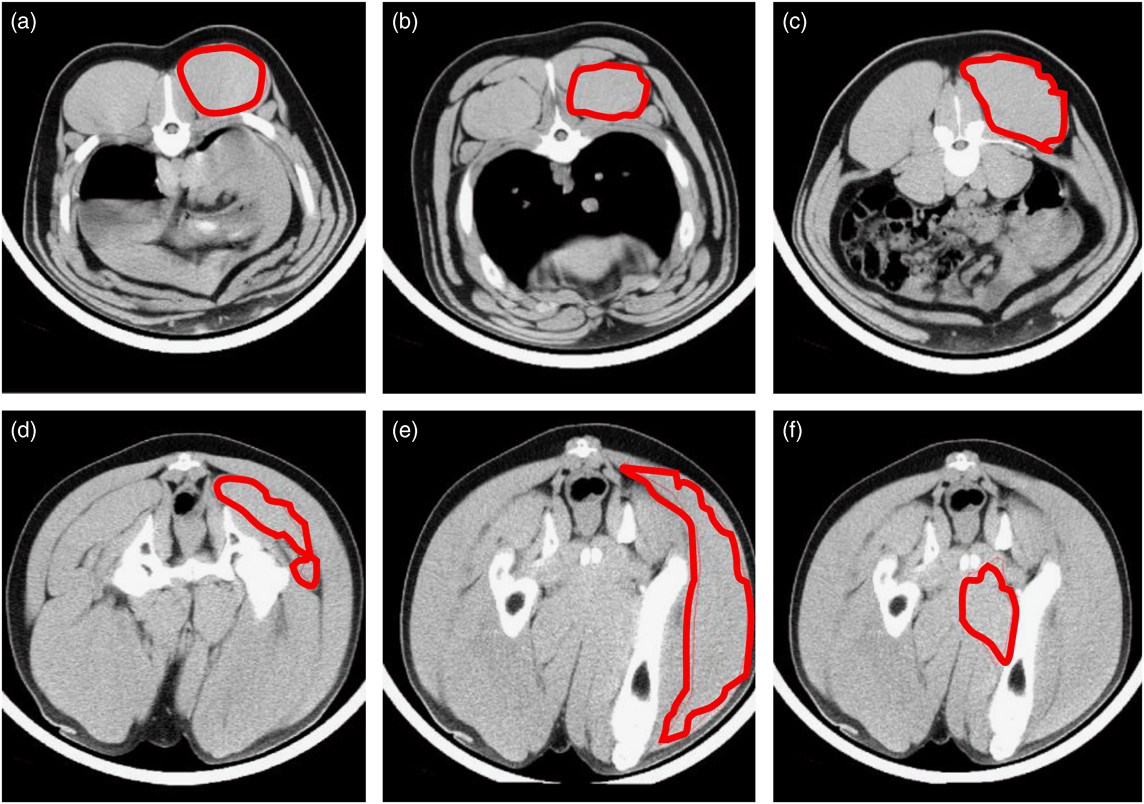
For the image analysis, an in-house program of the software Matlab (Matlab Version 7.5.0.342 (R2007b)©; The MathWorks Inc.) was used. A region of interest (ROI) was selected for each of the studied muscles and/or locations (Figure 1). Three ROIs were studied for the longissimus muscle in three images, one between the third and fourth lumbar vertebrae, one between the third and fourth last ribs and one between the eighth and ninth last ribs. Furthermore, from two images of the ham that allow to visualize the three muscles of interest, three different ROIs were performed; one image at the joint between the femur and the pubis bones for the muscle gluteus medius (GM) and one image in the middle of the femur for the muscles semimembranosus (SM) and biceps femoris (BF). For each ROI (n=923), the volume associated with each HU value was obtained by means of the thickness of the image, the matrix size and the displayed field of view (Font i Furnols et al., Reference Font i Furnols, Teran and Gispert2009) and its distribution was used for further analysis.
Region of interest of the muscles and anatomical locations evaluated from computed tomography images of live pigs: (a) LD34LR, longissimus between the third and fourth last ribs, (b) LD89LR, longissimus between the eighth and ninth last ribs, (c) LD34VL, longissimus between the third and fourth lumbar vertebra, (d) GM (gluteus medius), (e) BF (biceps femoris) and (f) SM (semimembranosus).

Carcass measures, muscle sampling and intramuscular fat analysis
After slaughter, fat thickness (plus skin) of the 70, 100 and 120 kg TBW pigs was measured perpendicularly to the skin with a ruler on the midline at three different levels of the loin (between the third and fourth lumbar vertebrae – LD34LV, between the third and fourth last ribs – LD34LR and between the eighth and ninth last ribs – LD89LR). Moreover, the minimum backfat and skin thickness over the GM muscle were also measured in the ham region.
Between 24 and 48h after slaughter, the longissimus muscle and SM, GM and BF muscles of the ham were removed by trained butchers and weighed. Three samples of 4-cm thickness were obtained at different levels of the loin (LD34LV, LD34LR and LD89LR), minced, homogenized and a subsample of ~200g was used for IMF analysis. IMF was also determined in the muscles SM, GM and BF from the ham using a subsample of ~200g obtained from mincing and homogenizing all the muscle. In the three loin samples, marbling was measured by two trained technicians according to the National Pork Producers Council (NPPC, 1999) scale (from 1=very low IMF to 10=high IMF). Intramuscular fat of all of the muscles was determined using near-IR FoodScan equipment (Foss Analytical, Hillerød, Denmark). Intramuscular fat for the 30 kg TBW pigs was not considered because the measures were not reliable.
Statistical analysis
Statistical analyses were performed with SAS software (version 9.3; SAS Institute Inc., Cary, NC, USA). The MEAN procedure was used to obtain mean and standard deviation values and the CORR procedure to determine Pearson’s correlation between different variables. The ANOVA was performed with the GLM procedure to determine the effect of the different factors on the IMF content. The model included genotype-sex, muscle and TBW as fixed effects. All of the double interactions and the triple interaction were added to the model. However, the triple interaction and the double interaction between muscle and TBW were removed because they were not significant (Supplementary Material S2). The GLM procedure was also used to determine the effect of the genotype-sex on the muscle weight. In this case, the model included the genotype-sex and the TBW as well as their interaction as fixed effects. To avoid the effect of differences in carcass weight within TBW, the difference between the average left carcass weight (within TBW) and the individual left carcass weight was included as a covariate (Supplementary Material S2). In all of the cases, significant differences between least square means were obtained after applying a Tukey test (P<0.05).
A prediction equation was obtained by partial least square (PLS) regression to predict the IMF content from the CT images of live pigs. Prediction was performed considering all of the muscles together and the muscles of the loin and the muscles of the ham separately. For this purpose, the PLS procedure was used and the volumes associated with the HU values of the ROIs were used as predictors. The smallest number of factors was selected to provide an error not significantly different (P>0.1) from the minimum error as suggested by SAS. The root mean square error of prediction was calculated by cross-validation leave-one-out (RMSEPCV) following a modified version of the macro developed by Causeur et al. (Reference Causeur, Daumas, Dhorne, Engel, Font i Furnols and Højsgaard2003) (see Supplementary Material S2). In addition, to evaluate the predictive ability of the model, the residual predictive deviation (RPD) statistics was calculated as the standard deviation divided by the RMSEPCV.
Results
Intramuscular fat content by genotype-sex, live weight and muscle
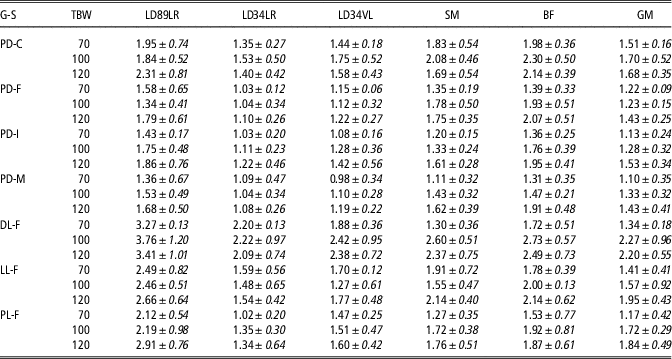
The averaged IMF content by muscle/location, genotype-sex and TBW is presented in Table 2. In the loin, it is possible to see that the mean IMF content at the LD34LR location varied between 1.02% (PL-F at 70 kg) and 2.22% (DL-F at 100 kg), at the LD34VL location the mean IMF content varied between 0.98% (PD-M at 70 kg) and 2.42% (DL-F at 100 kg) and at the LD89LR location the mean IMF content was higher in general and ranged between 1.34% (PD-F at 100 kg) and 3.76% (DL-F at 100 kg). Regarding the ham muscles, SM presented mean IMF values between 1.11% (PD-M at 70 kg) and 2.60% (DL-F at 100 kg), BF between 1.31% (PD-M at 70 kg), and 2.73% (DL-F at 100 kg), and GM presented, in general, the lowest mean values of IMF, which varied between 1.10% (PD-M at 70 kg) and 2.27% (DL-F at 100 kg).
Mean and standard deviation (in italics) of the intramuscular fat content (%) by pig genotype-sex (G-S), muscle/location and target BW (TBW)

LD34LR= longissimus between the third and fourth last ribs; LD34VL=longissimus between the third and fourth lumbar vertebrae; LD89LR=longissimus between the eighth and ninth last ribs; BF=biceps femoris; GM=gluteus medius; SM=semimembranosus. PD-C=Pietrain×(Landrace×Duroc) surgically castrated males; PD-F=Pietrain×(Landrace×Duroc) gilts; PD-I=Pietrain×(Landrace×Duroc) immunocastrated males; PD-M=Pietrain×(Landrace×Duroc) entire males; DL-F=Duroc×(Landrace×Large White) gilts; LL-F=Landrace×Large White gilts; PL-F=Pietrain×(Landrace×Large White) gilts.
When the ANOVA was performed for IMF content, a significant interaction was found between genotype-sex and muscle (P<0.0001) and between genotype-sex and live TBW (P=0.0144). The least squared means of these interactions are shown in Table 3. It is possible to see that the highest IMF content was found in the LD89LR in DL-F, LL-F and PL-F, while in the other genotype-sexes this was not significantly different from those of BF and SM (and also GM in PD-M). Loin at location LD34LR presented the lowest IMF content in all of the genotype-sexes, although in some of them it was not significantly different from other locations; PD-C did not present significant differences in IMF content by TBW. However, for PD-F, PD-I, PD-M and PL-F, IMF content was increasing with the live weight of the animal. For DL-F pigs, IMF content was significantly higher in 100 and 120 kg than in 70 kg live weight and in LL-F, IMF was higher in 120 kg than in 100 kg live weight, being in between at 70 kg live weight. In fact, according to Table 2, were the raw mean and SD are presented, in LL-F, this occurred numerically with all of the muscles except BF and GM.
Least square means of intramuscular content (%) for the interaction between muscle or target BW (TBW) with pig genotype-sex (RMSE=0.52%)

PD-C=Pietrain×(Landrace×Duroc) surgically castrated males; PD-F=Pietrain×(Landrace×Duroc) gilts; PD-I=Pietrain×(Landrace×Duroc) immunocastrated males; PD-M=Pietrain×(Landrace×Duroc) entire males; DL-F=Duroc×(Landrace×Large White) gilts; LL-F=Landrace×Large White gilts; PL-F=Pietrain×(Landrace×Large White) gilts; LD89LR=longissimus between the eighth and ninth last ribs; LD34LR= longissimus between the third and fourth last ribs; LD34VL=longissimus between the third and fourth lumbar vertebrae; BF=biceps femoris; GM=gluteus medius; SM=semimembranosus.
a,b,cDifferent superscripts within genotype-sex indicate significant differences (P<0.05) between muscle or between TBW.
Relationship between intramuscular fat content and marbling by muscle
Correlations of IMF content by muscle/location are presented in Table 4, with all of the correlations being significant (P<0.0001). The highest correlations were between IMF content at different locations of the loin (0.74 to 0.83). Correlations of IMF content between loin locations and ham muscles (0.53 to 0.70) were similar to those between ham muscles (0.63 to 0.67), being the lowest between LD34LR and SM (0.56) and between LD34LR and BF (0.53) and the highest between LD89LR and GM (0.70). The correlations by TBW are presented in Supplementary Tables S1 and S2. These tables show that the correlations were lower in 70 kg live weight pigs than in 100 and 120 kg live weight pigs, maybe because the amount of IMF is lower at this weight for most of the genotype-sexes studied.
Pearson’s correlation coefficients between intramuscular fat content of different muscles or anatomical positions for pigs from 70 to 120 kg live weight (n=153 to 155)

LD34LR=longissimus between the third and fourth last ribs; LD34VL=longissimus between the third and fourth lumbar vertebrae; SM=semimembranosus; BF=biceps femoris; GM=gluteus medius; LD89LR=longissimus between the eighth and ninth last ribs.
All the correlations have a P-value <0.0001.
When correlations between marbling and IMF content are considered (Table 5), it is possible to see that the highest correlations were between marbling scores in the loin and IMF of the loin. The correlations between marbling and IMF in the same loin locations were between 0.51 and 0.66. As expected, the correlations were lower between marbling in the loin and IMF in the ham muscles. Correlations between subcutaneous fat thickness at the three loin locations and at the ham with IMF content are also presented in Table 5. Although significant (P<0.0001), the correlations are moderate, since except for those of IMF in GM muscle, all are lower than 0.50. Correlations of IMF in GM and the different subcutaneous fat thicknesses were between 0.52 and 0.54, being the highest between GM and subcutaneous fat thickness of the ham, which makes sense since it was measured over the GM muscle. These correlations for each TBW are presented in Supplementary Tables S3 to S5. It is possible to see that in general, the highest correlations were found for 100 kg live weight pigs.
Pearson’s correlation coefficients between marbling and subcutaneous fat thickness with intramuscular fat (IMF) in several muscles of pigs (n=148 to 153)Footnote 1

LD89LR=longissimus between the eigth and ninth last ribs; LD34LR= longissimus between the third and fourth last ribs; LD34VL=longissimus between the third and fourth lumbar vertebrae; BF=biceps femoris; GM=gluteus medius; SM=semimembranosus.
1 All the correlations have a P value <0.0001.
2 National Pork Producers Council (NPPC, 1999) scale from 1: very low to 10: very high.
3 Fat thickness over the GM muscle.
Prediction of intramuscular fat content with computed tomography
Prediction of IMF from CT images of live pigs had an RMSEP of 0.56 to 0.66, which according to a mean of 1.79% to 1.78% implies a CV of 31% to 37%. The prediction when all of the muscles are considered together (RPD=1.09, R 2=0.17) is worse than those when only loin muscles are considered (RPD=1.28, R 2=0.42). The worst prediction is when only ham muscles are considered in the calculations (RPD=1.03, R 2=0.07). Nevertheless, in all the cases RPD was much lower than 3, which is the recommended value for a suitable prediction model (Williams, Reference Williams2001) (Table 6). In fact, the coefficient of determination was also very low, except for when only loin muscles were considered. The accuracy of the prediction was almost the same when only the Hounsfield values with variance importance for projection higher than 0.8 were considered as predictors (results not shown) and, because of that, only the results of prediction using Hounsfield values between −50 and −120 are presented.
Statistical parameters of the prediction of intramuscular fat content (%) in pig’s muscles from computed tomography images by means of partial least square (PLS) regression

Factors=number of PLS factors; RMSEPCV=root mean square error of prediction obtained with cross-validation leave-one-out; RPD=residual predictive deviation (SD/RMSEPCV); HU=Hounsfield values.
Muscles’ weight by genotype-sex and target BW
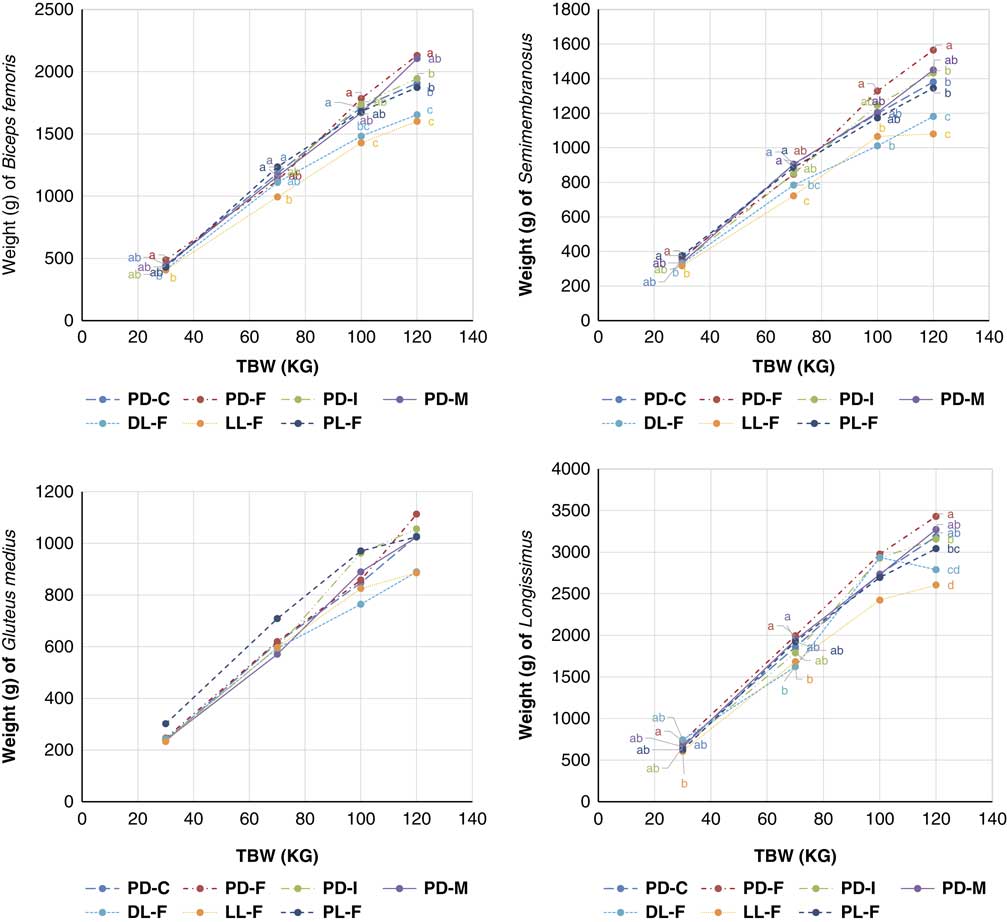
Muscle growth with the live weight of the pig by genotype-sex is presented in Figure 2. In general, LL-F and DL-F genotypes-sex presented a lower weight of all the studied muscles than the other genotype-sex studied, especially at higher BWs. This difference can be seen also at early weights and it is maintained throughout growth. This is only a tendency in the muscle GM because no significant differences among genotypes-sexes can be seen in this muscle. The highest weights of the muscles were usually by the PD-F genotype-sex, although in most of the muscles/locations, not significantly different than those from the other genotype lines with Pietrain. The average allometric coefficient of the total muscle weight with respect to the live weight of the pig was 0.97 for the loin, 0.89 for SM, 0.95 for BF and 0.92 for GM, although there were some differences between genotypes-sex, with DL-F, LL-F and PL-F having the lowest allometric coefficients (results not shown).
Trends of the weight of the muscles with the growth of the pig by genotype-sex. TBW=live target BW; PD-C=Pietrain×(Landrace×Duroc) surgically castrated males; PD-F=Pietrain×(Landrace×Duroc) gilts; PD-I=Pietrain×(Landrace×Duroc) immunocastrated males; PD-M=Pietrain× (Landrace×Duroc) entire males; DL-F=Duroc× (Landrace×Large White) gilts; LL-F=Landrace×Large White gilts; PL-F=Pietrain×(Landrace×Large White) gilts. Different letters within a TBW indicate significant differences between genotype-sexes (P<0.05).

Discussion
Intramuscular fat content varied between muscles (Table 3). Furthermore, within some muscles, such as longissimus dorsi, IMF also varied depending on its anatomical position. In this work, we confirmed what was presented by Faucitano et al. (Reference Faucitano, Rivest, Daigle, Lévesque and Gariepy2004) for longissimus muscle. The IMF content was higher between the eighth and ninth last ribs, then it decreased at the level of the third to fourth last ribs and then it increased again, between the third and fourth lumbar vertebrae. Thus, IMF content was much higher at the most cranial part of the loin (eighth to ninth last ribs). Regarding IMF in three ham muscles, there were also some differences and, in general, BF presented the highest IMF values. Lambe et al. (Reference Lambe, Wood, McLean, Walling, Whitney, Jagger, Fullarton, Bayntun and Bünger2013) found higher levels of IMF in SM muscle compared with LT muscle at the last rib level (1.79% v. 1.18%, respectively), which is in agreement with the present results, but Tyra et al. (Reference Tyra, Ropka-Molik, Terman, Piórkowska, Oczkowicz and Bereta2013) found the opposite, high IMF levels in LT (at the last rib level) compared with SM (1.95% v. 1.76%).
Intramuscular fat content for all of the muscles was higher in PD-C compared with PD-F, PD-I and PD-M, indicating a higher IMF content for castrated pigs, in accordance with Faucitano et al. (Reference Faucitano, Rivest, Daigle, Lévesque and Gariepy2004), Gispert et al. (Reference Gispert, Àngels Oliver, Velarde, Suarez, Pérez and Font i Furnols2010) and Jeong et al. (Reference Jeong, Kim, Ha, Park, Park, Joo and Lee2012), among others. Furthermore, IMF content depended on the genotype, with crosses with Duroc higher (DL-F) than those from Landrace-Large White crosses (LL-F) and crosses with Pietrain (PL-F). This is in accordance with the results found by Plastow et al. (Reference Plastow, Carrión, Gil, Garcı́a-Regueiro, Font i Furnols, Gispert, Oliver, Velarde, Guàrdia, Hortós, Rius, Sárraga, Dı́az, Valero, Sosnicki, Klont, Dornan, Wilkinson, Evans, Sargent, Davey, Connolly, Houeix, Maltin, Hayes, Anandavijayan, Foury, Geverink, Cairns, Tilley, Mormède and Blott2005) and Gil et al. (Reference Gil, Delday, Gispert, Font i Furnols, Maltin, Plastow, Klont, Sosnicki and Carrión2008) studying pure breeds. Pietrain are animals with high muscularity (Plastow et al., Reference Plastow, Carrión, Gil, Garcı́a-Regueiro, Font i Furnols, Gispert, Oliver, Velarde, Guàrdia, Hortós, Rius, Sárraga, Dı́az, Valero, Sosnicki, Klont, Dornan, Wilkinson, Evans, Sargent, Davey, Connolly, Houeix, Maltin, Hayes, Anandavijayan, Foury, Geverink, Cairns, Tilley, Mormède and Blott2005; Gispert et al., Reference Gispert, Àngels Oliver, Velarde, Suarez, Pérez and Font i Furnols2010) and from very lean breed. This high muscularity is related with a low IMF content (Hocquette et al., Reference Hocquette, Gondret, Baéza, Médale, Jurie and Pethick2010).
For most of the genotype-sex groups (PD-F, PD-I, PD-M and PL-F), the IMF increased with the growth of the pig, indicating that the highest IMF content is reached at 120 kg, with a content significantly higher than that found at 70 kg (Table 3). These results are in agreement with those found by Bosch et al. (Reference Bosch, Tor, Reixach and Estany2012) when pigs of 95, 113 and 105 kg were studied. A tendency can also be seen for PD-C but not significant differences between weights and, for DL-F, at 100 kg the IMF stops increasing. Bosch et al. (Reference Bosch, Tor, Reixach and Estany2012) did not find significant differences in the IMF content of (Yorkshire×Landrace)×Duroc gilts and barrows at 110, 125 and 138 kg. Thus, for these genotype-sexes, the early development of IMF would avoid the necessity of increasing the weight of the pig to increase its IMF content in all of the muscles. However, there was an opposite finding for LL-F, and the difference in IMF is very important (P<0.05) between 100 and 120 kg. Lambe et al. (Reference Lambe, Wood, McLean, Walling, Whitney, Jagger, Fullarton, Bayntun and Bünger2013) for Pietrain×(Landrace×Large White) intact male pigs fed different diets found no important differences in IMF content in pigs after 60 kg of weight, since the average IMF content was 1.14%, 1.12% and 1.18% for pigs of 60, 85 and 115 kg, respectively. Thus, in general, in the present study, the higher the weight (up to 120 kg) the higher the IMF content with some exceptions. In this sense, it is important to know the genotype-sex of the pigs to optimize the IMF content of the final product and to decide the optimal slaughter moment to obtain the desired product.
Since the IMF content is related to the tenderness and juiciness of the meat (Enfält et al., Reference Enfält, Lundström, Hansson, Lundeheim and Nyström1997; Heyer and Lebret, Reference Heyer and Lebret2007; Font-i-Furnols et al., Reference Font-i-Furnols, Tous, Esteve-Garcia and Gispert2012), it is important to know the differences in this content between genotypes-sex and within muscles, because this can help in understanding the eating characteristics of the meat used for consumption. Even though there are variations between and within muscles in the IMF content, correlations of IMF content within the same muscle (longissimus) are high (0.74 to 0.83) (Table 4). Correlations between muscles of the same animal were always significant and varied between 0.53 and 0.70 (Table 4). These correlations were higher when only 100 kg live weight pigs were considered and lower when only 70 kg live weight pigs were taken into account (Supplementary Table S1). This result may indicate that the knowledge of the IMF content of one muscle can be related to the other muscles, since when it increases, it increases for all of the muscles; nevertheless, the relationship is not perfect and it would be difficult to estimate the IMF content of one muscle from those of other muscles.
The correlation between marbling evaluated according to the NPPC scale and IMF content is higher for the longissimus than for the muscles of the ham. This is probably because the NPPC scale was measured in the longissimus muscle and, consequently, the similarities are higher. These correlations were always positive and significant, indicating the higher the IMF, the higher the marbling. Nevertheless, the correlation is not perfect, varying from 0.51 to 0.66 in the loin and between 0.33 and 0.50 in the ham muscles. These correlations are lower than those reported by Font-i-Furnols et al. (Reference Font-i-Furnols, Tous, Esteve-Garcia and Gispert2012), which was 0.89, even in 100 kg live weight animals that presented the highest correlations (Supplementary Tables S3 to S5).
The weight of the longissimus muscle was the highest followed by BF, SM and GM (Figure 2), but logically all of the muscles increase in weight when an animal grows. Except for the GM muscle, differences in weight for the same muscle between genotype-sex can be seen at 30 kg TBW and this became more important at 120 kg, where differences are greater. Crosses that do not include Pietrain (LL-F and LL-F) presented in general a lower weight of the muscles, especially at higher TBW. This is in agreement with the work of Fisher et al. (Reference Fisher, Green, Whittemore, Wood and Schofield2003) and Carabús et al. (Reference Carabús, Gispert, Brun, Rodríguez and Font-i-Furnols2014) where the ham muscles of several genetic types were studied. This makes sense since Pietrain is a highly conformed breed, whose carcasses have higher ham weight, ham lean content and loin lean content, although not loin weight (Gispert et al., Reference Gispert, Font i Furnols, Gil, Velarde, Diestre, Carrión, Sosnicki and Plastow2007). Thus, the most adequate genotype-sex depends on the desired final product. Fisher et al. (Reference Fisher, Green, Whittemore, Wood and Schofield2003) predicted ham muscle weights for carcasses of approximately 25 and 75 kg. For 25 kg carcasses, which would represent 31 kg live weight, the average weight of the muscles SM (367g) and GM (239g) is similar to those found in the present project (367 and 239g, respectively). In 75 kg carcasses, which would represent ~93 kg live weight, the average weight of the muscles SM (833g) and GM (617g) is similar to those of 70 kg of the present work (844g and 616g, respectively). Thus, it seems that the growth of these muscles, at higher weights, is higher in the present work, probably due to differences in the genotypes used. Moreover, the allometric coefficients for ham (0.89 to 0.95) and loin (0.97) muscle weight with respect to the live weight of the pig were close to one in agreement with the previous works that reported allometric coefficients between 0.87 and 1.13 for ham muscle and 1.01 and 1.03 for loin muscle (Carabús et al., Reference Carabús, Gispert, Brun, Rodríguez and Font-i-Furnols2014; Carabús et al., Reference Carabús, Sainz, Oltjen, Gispert and Font-i-Furnols2017).
The estimation of IMF content in live pigs is very important to optimize the slaughter moment of the pig to yield the final desired product. However, this prediction in live pigs by means of CT, in the conditions of this experiment, was not accurate enough and had an unacceptable error (Table 6). This result is in accordance with those reported by Kongsro and Gjerlaug-Enger (Reference Kongsro and Gjerlaug-Enger2013) who concluded that CT is not a feasible method for the prediction of IMF from live pigs. This is probably due to the respiratory movement of the pig and to the size of the voxel that is probably too big because the displayed field of view has to cover all of the body of the pig and, since the IMF is small, it might have many partial volume effect that makes it difficult to identify the IMF. These two reasons can explain why, although still not good, the prediction of IMF in loins is somewhat better (Font-i-Furnols et al., Reference Font-i-Furnols, Brun, Tous and Gispert2013), since there is no breath movement and the displayed field of view can be adjusted to the loin area. Furthermore, the prediction of IMF is better when only loin muscles images are considered in the analysis compared with those of ham muscles. This is probably because for loin muscles, the sample analyzed for IMF is almost the same as those analyzed in CT images. However, for ham muscles, the whole muscle was minced and the IMF determined, while only one image of the muscle was analyzed to predict IMF content. However, Lambe et al. (Reference Lambe, Wood, McLean, Walling, Whitney, Jagger, Fullarton, Bayntun and Bünger2013) predicted IMF from CT images using the average muscle density as a predictor. The error of prediction was not provided, but the correlation between this density and the chemical IMF was found to be around −0.44 for 60 kg pigs, −0.63 for 85 kg pigs and −0.70 for 115 kg pigs. Thus, these correlations indicate that CT can predict IMF, but the error is probably quite high, especially in pigs of lower weight. In the present project, the correlation between averaged Hounsfield value of the ROI of each muscle and IMF content was 0.12 (0.16 at 70 kg, 0.24 at 100 kg and 0.15 at 120 kg) and, because of that, this approach for IMF prediction has not been considered.
In the conditions of the present experiment, it can be concluded that the IMF content differs between and within muscle, during growth and by genotype-sex. To optimize the final product for IMF content and amount of muscle, it is important to know the growth of these tissues with the growth of the pig. Nevertheless, this is difficult to obtain from live pigs by means of CT since the prediction of this parameter is not accurate enough.
Acknowledgements
The present study was supported by the Instituto Nacional Investigaciones Agrarias-INIA (Evaluación in vivo del crecimiento alométrico de los tejidos muscular y adiposo de los cerdos según la genética y el sexo mediante tomografía computerizada RTA2010-00014-00-00). CERCA Programme (Generalitat de Catalunya) is acknowledged. The authors wish to thank Anna Carabús, Carles Francàs, Albert Rossell and Agustí Quintana for their invaluable technical assistance.
Declaration of interest
The authors have no conflicts of interest.
Ethics statement
The IRTA’s ethical committee approved the protocol.
Software and data repository resources
The data are not deposited in an official repository.
Supplementary material
To view supplementary material for this article, please visit https://doi.org/10.1017/S1751731118002021