


1. Introduction
The existence of mountain glaciers hinges on a sensitive balance between mass accumulation via snowfall and mass wastage (i.e. ablation) via melting, evaporation, sublimation and calving. All of these processes are ultimately controlled by climate. While climate changes will obviously tend to drive glacier variations, not all glacier variations should be interpreted as being caused by climate changes. Climate is the statistics of weather, averaged over some time period of interest. The World Meteorological Organization takes this time period as 30 years, but it can be any interval relevant for the question at hand. By definition, then, a constant climate means that the statistical distributions of atmospheric variables do not change with time. Therefore variability, as characterized by the standard deviation and higher-order statistical moments, is in fact intrinsic to a constant (i.e. stationary) climate. Glaciers reflect this variability. The characteristic response time (i.e. inertia, or ‘memory’) of a glacier ranges from years to centuries (e.g. Reference Jóhannesson, Raymond and WaddingtonJóhannesson and others, 1989; Reference Harrison, Elsberg, Echelmeyer and KrimmelHarrison and others, 2001; Reference OerlemansOerlemans, 2001; Reference Pelto and HedlundPelto and Hedlund, 2001), and any given glacier will reflect an integrated climate history on those timescales. Thus we arrive at a key question in interpreting records of changes in glacier geometry: is the reconstruction of past glacier variations significantly different (in a statistical sense) from what would be expected as a natural response to intrinsic variability in a stationary climate? Only when this significance has been demonstrated can a recorded glacier advance or retreat be confidently interpreted as reflecting an actual change in climate.
Using glacier histories to infer past climate changes centers on a classic case of understanding the signal-to-noise ratio. Glaciers respond to the ‘noise’ of interannual variability as well as the ‘signal’ of actual climate changes. Without understanding the response of a glacier to inter-annual variability, there is a potential to conclude that changes in climate forcing must have occurred, and of searching for a climate mechanism (e.g. volcanoes or solar variability) where none may in fact be needed. The importance of the issue can be understood by a direct analogy to the detection and attribution of anthropogenic influence on global mean temperature. The Intergovernmental Panel on Climate Change (IPCC; Reference SolomonSolomon and others, 2007) concluded that it was not until the late 20th century that the signal of anthropogenic warming emerged from the background of the natural, interannual variability. Up to that point there was not enough information and the signal was too small, so the effect remained undemonstrated. Crucially, this exercise required the use of climate models, calibrated primarily to instrumental climate records, to determine the magnitude of the natural variability in global mean temperature, in the absence of any climate change. In using glaciers as ‘past climate-change detectors’ the same issues exist, and the challenge therefore is to characterize the timescales and magnitudes of the glacier variability that are driven by the natural, interannual climate variability, in the absence of any real climate change.
In this paper, we adapt a linear glacier model to include an explicit and separate treatment of precipitation and melt-season temperature. We use reconstructed geometries, historical climate data and numerical model output from localities on and near Mount Baker in the Cascade Range of western Washington, USA (Fig. 1), in order to determine the glacier response to intrinsic climate variability in this region.
Major Mount Baker glaciers (elevation contour interval 250 m). Glaciers are shown at their LIA maxima, 1930 and present positions.

Although the examples used in this study are based on the geometries of typical valley glaciers in this setting, the goal in this paper is not to create a simulation of the evolution of any observed glacier. Rather, our approach is to employ the simplest modeling framework in which the basic behavior can be demonstrated. We use a combination of observations and reconstructions of climate and glaciers to calibrate and evaluate a simple model for the glaciers on Mount Baker. We emphasize here that the model adequately reproduces the observed characteristic variations of glacier length and is also consistent with the observed trends over the last century. The analyses lead to some important results against which to interpret glaciers in natural settings.
Our approach mirrors that of Reference Reichert, Bengtsson and OerlemansReichert and others (2002), who used a downscaled global climate model (GCM) output and a dynamical glacier model for two European glaciers (Nigardsbreen, Norway, and Rhonegletscher, Switzerland). They concluded that the present retreat exceeded natural variability, but that Little Ice Age (LIA) advances did not. Thus a climate change (at least within their GCM/glacier model system) was not required to explain LIA-like advances. Here, our use of a linear model is a trade-off: the level of sophistication of the glacier model is less, but its simplicity allows us to derive some simple expressions that make clear the dependencies of the system response.
2. The Glacier Model
Glaciers are dynamic physical systems wherein ice deforms and flows in response to hydrostatic pressure gradients caused by sloping ice surfaces. There are other important factors to glacier motion, among which are: ice flow is temperature-dependent; glaciers can slide over their base if subglacial water pressures are sufficient; glaciers interact with their constraining side-walls; and glacier mass balance can be sensitive to complicated mountain environments (e.g. Reference NyeNye, 1952; Reference Pelto and RiedelPelto and Riedel, 2001; Reference AndersonAnderson and others, 2004). Despite these somewhat daunting complications, a series of papers have shown that simple linear models based on basic mass-balance considerations can be extremely effective in characterizing glacier response to climate change (e.g. Reference Huybrechts, de Nooze, Decleir and OerlemansHuybrechts and others, 1989; Reference Jóhannesson, Raymond and WaddingtonJóhannesson and others, 1989; Reference Raper, Brown and BraithwaiteRaper and others, 2000; Reference Harrison, Elsberg, Echelmeyer and KrimmelHarrison and others, 2001; Reference OerlemansOerlemans, 2001, Reference Oerlemans2005; Reference KlokKlok, 2003).
The model that we use includes an explicit and separate representation of melt-season temperature and annual mean precipitation in the mass balance. A schematic of the model is depicted in Figure 2, and a derivation of the model equations is presented in the Appendix. The model operates on three key assumptions that are typical of such models. The first assumption is that a fixed characteristic glacier depth and a fixed width of the glacier tongue can represent the glacier geometry. The second assumption is that glacier dynamics can be essentially neglected. All accumulation and ablation anomalies act immediately to change the length of the glacier. The third assumption is that length variations are departures from some equilibrium value, and are small enough that the system can be made linear. These three assumptions, together with a constraint of mass conservation, allow for prescribed climate variations in the form of accumulation and temperature anomalies to be translated directly into length changes of the glacier. In section 5.2 the validity of these assumptions is evaluated by comparing the results from the linear model with those from a non-linear dynamical flowline model.
Idealized geometry of the linear glacier model, based on Reference Jóhannesson, Raymond and WaddingtonJóhannesson and others (1989). Precipitation falls over the entire surface of the glacier, A tot, while melt occurs only on the melt-zone area, AT> 0. The ablation zone, A abl, is the region below the ELA. Melt is linearly proportional to the temperature, which in turn decreases linearly as the tongue of the glacier recedes up the linear slope, tan φ, and increases as the glacier advances downslope. The height, H, of the glacier, and the width of the ablation area, w, remain constant. Figure courtesy of K. Huybers.

The geometry of the glacier model is depicted in Figure 2: the total glacier area is A tot, there is a melt zone where the melt-season temperature is above zero, with an area AT> 0, and there is an ablation zone where the annual melt exceeds the annual accumulation, with an area A abl. In other words, the ablation zone is the region of the glacier below the equilibrium-line altitude (ELA). This definition of ablation zone is in accord with, for example, Reference PatersonPaterson (1994), but it is important to note that the net mass loss above the ablation zone also plays a role in the glacier dynamics, as can be seen in the derivation of the model equation in the Appendix. The glacier has a protruding tongue with a characteristic width, w, has uniform thickness, H, and rests on a bed with a constant slope angle, φ. The center-line length is assumed to represent the total glacier length, L. Further refinements of the simple model are possible. It would be possible to incorporate a feedback between thickness and glacier length (e.g. Reference OerlemansOerlemans, 2001) or a time-lag between climate anomaly and terminus response (e.g. Reference Harrison, Raymond, Echelmeyer and KrimmelHarrison and others, 2003) with some incremental increase in model complexity. However, the agreement between the linear model and a dynamic flowline model, demonstrated in section 5.2, is sufficient to justify the use of the current model for the question posed.
Climate is prescribed in terms of a spatially uniform accumulation rate, P, and a temperature-dependent ablation rate, μT, where T is the mean melt-season temperature and μ is an empirical coefficient, or melt factor. In effect, this ablation parameterization is a simplified form of the more frequently used positive-degree-day model (e.g. Reference Braithwaite, Olesen and OerlemansBraithwaite and Olesen, 1989). Percolation of meltwater and freezing of rainfall are neglected. A simplified treatment of ablation is adequate for the purpose of this paper, which is to characterize the general magnitude of the glacier response rather than to accurately capture the details.
In the Appendix it is shown that when the model is linearized, the evolution of the terminus position is governed by

where the prime denotes perturbations from the equilibrium state and all other variables are their climatological (i.e. time mean) values. Γ is the atmospheric lapse rate (the decrease of temperature with elevation) and P′ and T′ are annual anomalies of, respectively, the average annual accumulation on the glacier and the average melt-season temperature on the glacier’s melt zone.
In sections 4 and 5, Equation (1) is applied to the glaciers of Mount Baker. We use climate forcing that is consistent with the observed mass balance and show that Equation (1) adequately reproduces the observed variability and trends of glacier length. First, though, we discuss the physics represented by Equation (1), as there are important behaviors to highlight.
3. Discussion of Model Physics
As noted above, the model is similar in spirit to that of Reference Jóhannesson, Raymond and WaddingtonJóhannesson and others (1989) and Reference Harrison, Elsberg, Echelmeyer and KrimmelHarrison and others (2001), and the essence of the dynamics is identical. However the model does differ in some important respects. Firstly, in the model presented here, the climate forcing reflects the separate contributions of accumulation and melt-season temperature. Secondly, ablation in this model is calculated from the melt occurring over the whole ablation zone, rather than being calculated from the net mass balance at the terminus. These differences in model formulation reveal that the glacier response has some importance dependencies on the glacier geometry and climatic setting, so a discussion of the model physics is warranted.
In the absence of a climate perturbation (P′ = T′ = 0), Equation (1) can be written as

where

Equation (2) represents a system that, if perturbed, relaxes asymptotically back to equilibrium (L′ = 0) with a characteristic timescale, τ, which is a function of the glacier geometry and the sensitivity of ablation to temperature.
In the presence of climate variability, another interpretation of τ is that it is the timescale over which the glacier integrates the mass-balance anomalies. In other words, τ can be thought of as the length of the glacier’s ‘memory’ of previous climate states.
Without loss of generality, the numerator and denominator in Equation (3) can both be multiplied by L′, and written as

Recall that the model linearizes the glacier into an equilibrium component and an anomalous departure from that equilibrium (see Appendix). wHL′ is the anomalous volume of ice associated with anomalous length L′ (Fig. 2). L′ tan φ ΓμA abl is the temperature anomaly resulting from a displacement of the glacier terminus. Therefore L′ tan φ ΓμA abl is the anomalous melt rate summed over the ablation zone (m3 a−1).Thus τ is equivalent to a volume divided by a volume rate, and can be interpreted as the time taken to melt (or build) an anomalous volume of ice due to the anomalously warm (or cold) temperature conditions experienced in the ablation zone due to an advance (or retreat) of the terminus.
The ways that the various parameters affect τ have clear physical explanations: increasing the value of μ, Γ or tan φ affects the local melt rate (i.e. m a−1); increasing A
abl increases the ability of the glacier terminus to accommodate an increase in the mass balance; conversely, increasing H results in a greater amount of mass that must be removed for a given climate change. In the model of Jóhannesson and others (Reference Jóhannesson, Raymond and Waddington1989), the equivalent timescale is given by  , where
 is the net mass balance at the terminus. The denominator in Equation (2) plays the equivalent role of
 in this model.
3.1. Equilibrium response to changes in forcing
We first consider the steady-state response of the glacier system to a step-function change in climate. The second and third terms on the right-hand side of Equation (1) represent the climatic forcing separated into precipitation and temperature respectively. Equation (1) can be rearranged and used to calculate the steady-state response of the glacier terminus, ΔL, to a change in annual accumulation, ΔP, or melt-season temperature, ΔT, using the fact that dL′/dt = 0 in steady state. In response to a change in melt-season temperature, ΔT, the response of the terminus is given by

In response to a negative anomaly in temperature, the glacier will advance downslope until ablation comes back into balance with the new climate. A steeper basal slope or lapse rate (i.e. a larger value of tan φ or Γ) means the glacier will not have to advance as far to find temperature warm enough to establish mass balance. The ratio of areas appears in Equation (4) because as the glacier terminus advances, it also expands the area over which accumulation occurs, and this partially offsets the increased melting that occurs at lower elevations.
In response to a step change in annual accumulation, ΔP, Equation (1) can be rearranged to give

Equation (5) is analogous to Equation (4): both the imposed geometry of the glacier and the melt rate at the terminus are required to account for the accumulation and the area added to the glacier tongue. Looking at the terms in Equation (5), A abl is the area of the ablation zone, ΔLP Γ tan φ is the temperature change of the terminus due to the change in length, and ΔP is the change in the total accumulation. Equation (5) is therefore a perturbation mass-balance equation: it gives the change in the length of the glacier such that the change in the total ablation rate balances the prescribed change in the total accumulation rate.
Another useful property of the linear model is that it is straightforward to evaluate the relative sensitivity of the glacier length to accumulation and melt-season temperature. Let R equal the ratio of length changes due to temperature, ΔLT , to the length change due to precipitation, ΔLP. From Equations (4) and (5),

Thus R is equal to the ratio of the ablation and melt-zone areas multiplied by the ratio of the ablation-rate (i.e. μΔT) and accumulation-rate changes.
3.2. Response to climate variability
For particular accumulation and melt-season temperature records, and for parameter choices appropriate to specific glaciers, Equation (1) can be numerically integrated forward in time to calculate the glacier response to a given climate forcing. However, to begin with, we first derive general expressions for the glacier length variations expected in a constant climate. As discussed in section 1, a constant climate means the climate has a constant mean and a constant standard deviation.
If we assume that the accumulation and temperature anomalies are described by normally distributed random noise, then Equation (1) is formally equivalent to a first-order autoregressive process, or AR(1) (e.g. Reference Von Storch and Zwiersvon Storch and Zwiers, 1999). It represents a physical system with memory, subject to stochastic forcing. A robust and fundamental property of such systems is that, even when driven by forcing with no persistence (i.e. white noise), they respond with persistent fluctuations (i.e. red noise) that can have surprisingly long timescales, as shown below (e.g. Reference Jenkins and WattsJenkins and Watts, 1968; Reference Von Storch and Zwiersvon Storch and Zwiers, 1999; Reference RoeRoe, 2009).
Assuming a normal distribution of accumulation cannot be, of course, strictly correct because negative precipitation is not physical, but provided the standard deviation is small compared to the mean, this approximation is still instructive to make. We further assume that neither accumulation nor melt-season temperature is correlated in time, and also that they are not correlated with each other. Huybers and Roe (in press) showed that these assumptions are appropriate for glaciers in the Pacific Northwest. Although there is some interannual memory in precipitation, it is not very strong (e.g. Huybers and Roe, in press) and much shorter than characteristic glacier response timescales, τ. Moreover, 80% of annual precipitation in the region falls in the winter half-year, so correlations between annual precipitation and melt-season temperature are not significant. A more detailed treatment of the mass balance might include the temperature dependence of the wintertime snowpack. Further possible model refinements are discussed in section 7.
Let σT be the standard deviation of melt-season temperature, let σP be the standard deviation of annual accumulation, and let vt and λ t be independent normally distributed random processes. Then using finite differences to discretize the equation into time increments of Δt = 1 year, Equation (1) can be written as

where subscript t denotes the year. We first calculate expressions for the standard deviation of glacier length due to temperature and precipitation variations separately. Let 〈x〉 represent the statistical expectation value of x. The following relationships hold: 〈vt λ t 〉 = 〈vtLt ) = 〈λ tLt 〉 = 0; 〈LtLt 〉 = 〈L t +Δt L t +Δt 〉; and the expectation value of both sides of Equation (7) must be the same. Firstly let σP = 0, in which case it follows from Equation (7) that

and similarly, for σLP ,

As might be expected, the relative sensitivity of the glacier to precipitation and temperature variations is similar to that for a step-change:

Note that this ratio describes the relative importance of accumulation and melt-season temperature for glacier length. It is different, of course, from the relative importance of accumulation and temperature for local mass balance, which is simply given by μσT = σP .
Since the model is linear and the climate variations are uncorrelated, the standard deviation of glacier length when both temperature and precipitation are varying can be written:

Thus, for specified glacier geometry and parameters, we can directly calculate the expected response of the glacier to random year-to-year fluctuations in the meteorological variables. In section 4, we apply and evaluate this model for typical conditions of Mount Baker glaciers, and the climate of the Pacific Northwest of the United States. We emphasize that Equations (7–11) follow directly from the governing Equation (1), and involve no additional assumptions.
4. Calibration of Model for Mount Baker Glaciers and Cascade Climate
4.1. Climate parameters
Most of the model parameters are readily determined or available from published literature. The value of μ, the melt rate at the terminus per °C of melt-season temperature, is assumed to range from 0.5 to 0.84 m °C−1 a−1(e.g. Reference PatersonPaterson, 1994). We take Ito be 6.5°C km−1 (e.g. Wallace and Hobbs, 2004). In practice, IF varies somewhat as a function of location and season (J.R. Minder and others, unpublished information). Our choices here produce vertical mass-balance gradients that are consistent with profiles obtained for glaciers in the region (e.g. Reference Meier, Tangborn, Mayo and PostMeier and others, 1971).
4.2. Glacier geometry
For our rectangular, slab-shaped model glacier, the mean ablation area, A abl, is calculated using the accumulation–area ratio (AAR) method, which assumes that the accumulation area of the glacier is a fixed portion of the total glacier area (e.g. Reference Meier and PostMeier and Post, 1962; Reference PorterPorter, 1977). Although the method does not account for the distribution of glacier area over its altitudinal range, or hypsometry, it is appropriate for the model since we are trying to generalize to large, tabular valley glaciers with similar shapes. Porter (Reference Porter1977) indicates that for mid-latitude glaciers like the large valley glaciers of the Cascade Range, a steady-state AAR is generally in the range 0.6–0.8.
A range of areas for the ablation zone, A abl, for our model is readily determined from the area of glaciers and their characteristic tongue widths using 7.5′ US Geological Survey topographic maps and past glacier-geometry data from Burke (Reference Burke1972), Fuller (Reference Fuller1980), Harper (Reference Harper1992), Thomas (Reference Thomas1997) and O’Neal (Reference O’Neal2005). For the major glaciers on Mount Baker, this information is compiled in Table 1. The large valley glaciers around Mount Baker are all similar geometrically, so we also choose a representative set of parameters, which we use for analyses in section 5 (Table 1). Substituting this characteristic set of parameters into Equation (2) and accounting for the range of uncertainties in μ and the AAR, τ varies between 7 and 24 years, with a midrange value of 12 years. This range of timescales is consistent with those identified by Harper (Reference Harper1992) for these glaciers.
Parameters for the major Mount Baker glaciers, obtained from a variety of sources. See Figure 2 for a schematic illustration of the model parameters and the text for details. A abl is shown for several different choices of the AAR. Also given is a choice of a set of typical parameters used in the glacier model

4.3. Climate data
We take the melt season to be June–September (denoted JJAS). We also use annual mean precipitation as a proxy for annual mean accumulation of snow. In this region of the Pacific Northwest, about 80% of the precipitation occurs during the October–March winter half-year, so we assume that it falls as snow at high elevation. This also means that annual precipitation and melt-season temperature in the region are not significantly correlated, and therefore can be assumed independent of each other. Since we are seeking a first-order characterization of the glacier response to climate variability, these are appropriate approximations. For want of a satisfactory treatment of these processes, we also neglect mass input to the glacier from avalanching and blowing snow.
The nearest long-term meteorological record is from Diablo Dam (48°30′ N, 12°09′ W; 271 m a.s.l.), about 60 km from Mount Baker (48°46′ N, 121°49′ W; 3285 m a.s.l.), and extends back about 75 years. The observations of annual precipitation and melt-season temperature are shown in Figure 3a and b.
(a) Annual mean precipitation recorded at Diablo Dam near Mount Baker over the past 75 years, equal to 1.89 ± 0.36 (1σ) m a−1; (b) melt-season (JJAS) temperature at the same site, equal to 16.8 ± 0.78 (1σ)°C. These atmospheric variables at this site are statistically uncorrelated and both are indistinguishable from normally distributed white noise with the same mean and variance. The application of a 5 year running mean imparts the artificial appearance of multi-year regimes. (c–f) Random realizations of white noise shown for annual mean accumulation (c, e) and for melt-season temperature (d, f). Note the general visual similarity of the random realizations and the observations.

It is quite common in the glaciological literature to find decadal climate variability invoked as the cause of glacier variability on these timescales (e.g. Reference Hodge, Trabant, Krimmel, Heinrichs, March and JosbergerHodge and others, 1998; Reference Moore and DemuthMoore and Demuth, 2001; Reference KovanenKovanen, 2003; Reference Nesje and DahlNesje and Dahl, 2003; Reference Pederson, Fagre, Gray and GraumlichPederson and others, 2004; Reference Lillquist and WalkerLillquist and Walker, 2006). In particular, for the Pacific Northwest, much is made of the Pacific Decadal Oscillation (PDO). The PDO is the leading empirical orthogonal function of sea-surface temperatures in the North Pacific, and exerts an important influence on climate patterns in the Pacific Northwest (e.g. Reference Mantua, Hare, Zhang, Wallace and FrancisMantua and others, 1997). In fact, gridded datasets for the atmospheric variables that control glacier variability show very little persistence; there is no significant interannual memory in melt-season temperature (Huybers and Roe, in press) and only weak interannual memory in the annual precipitation (the 1 year lag autocorrelation is ∼0.2–0.3, and so explains <10% of the variance; Huybers and Roe, in press). The interannual memory that does exist in North Pacific sea-surface temperatures comes from re-entrainment of ocean heat anomalies into the following winter’s mixed layer (Reference Deser, Alexander and TimlinDeser and others, 2003; Reference Newman, Compo and AlexanderNewman and others, 2003) and is consistent with longer-term proxy records for accumulation (e.g. Reference Rupper, Steig and RoeRupper and others, 2004). The appearance of decadal variability in time series of the PDO is often artificially exaggerated by the application of a several-year running mean through the data (e.g. Reference RoeRoe, 2009).
At Diablo Dam, and for this length of record, a standard statistical test for autoregression (a stepwise least-squares estimator for the significance of autocorrelations, using Schwarz’s Bayesian criterion, as implemented in ARfit; Reference Von Storch and ZwiersVon Storch and Zwiers, 1999; Reference Schneider and NeumaierSchneider and Neumaier, 2001) does not allow the conclusion that there is any statistically significant interannual persistence in either the annual precipitation or the melt-season temperature (after linearly detrending the time series). ARfit uses the modified Li-McLeod portmanteau statistic (e.g. Reference Schneider and NeumaierSchneider and Neumaier, 2001) to test for the presence of significant autocorrelations. For Diablo Dam, the test has a p value of 51%. A value of <5% would be necessary to demonstrate statistically significant persistence in the time series. In other words, one year bears no relation to the next. The oft-used technique of putting a 5 year running mean through the data gives a deceptive appearance of regimes lasting many years, or even decades, that are wetter/drier or warmer/colder, but this is artificial. A graphic demonstration of this is given in Figure 3c and e, which show random realizations of white noise with the same mean and standard deviation as the annual precipitation. Figure 3e and f show the same thing, but for melt-season temperature. There is a large amount of year-to-year variability, and just by chance there are intervals of a few years of above- or below-normal conditions. This is highly exaggerated by the application of the running mean. The similarity of the general characteristics of these random time series to the data (visible in Fig. 3) reflects the fact that the linearly detrended annual-mean accumulation and melt-season temperature are statistically indistinguishable from normally distributed white noise. Thus for the atmospheric fields that are relevant for forcing glaciers, there is little or no evidence of any interannual persistence of climate regimes in this setting.
It is very important to stress this result. A large fraction of the glaciological literature has interpreted the recent (but pre-anthropogenic) glacier history of this region and elsewhere in terms of the decadal-scale persistence of climate regimes. For the Pacific Northwest, this is simply not supported by the available weather data. Five other longterm weather-station records near Mount Baker were also analyzed: Upper Baker Dam (48°39′ N, 121°42′ W; 210.3 m a.s.l.; 44 years); Bellingham airport (48°48′ N, 122°32′ W; 45.4 m a.s.l.; 46 years); Clearbrook (48°58′ N, 122°20′ W; 19.5 m a.s.l.; 76 years); Concrete (48°32′ N, 121°45′ W; 59.4 m a.s.l.; 76 years); and Sedro Wooley (48°30′ N, 122°14′ W; 18.3 m a.s.l.; 76 years). None of these stations shows any statistically significant autocorrelations of annual precipitation or melt-season temperature either. The lack of strong evidence for dominant decadal-scale regimes (i.e. significant autocorrelations on decadal timescales) of atmospheric circulation patterns is widely appreciated in the climate literature (e.g. Reference Frankignoul and HasselmannFrankignoul and Hasselmann, 1977; Reference Frankignoul, Müller and ZoritaFrankignoul and others, 1997; Reference Barsugli and BattistiBarsugli and Battisti, 1998; Reference WunschWunsch, 1999; Reference Bretherton and BattistiBretherton and Battisti, 2000; Reference Stouffer, Hegerl and TettStouffer and others, 2000; Reference Deser, Alexander and TimlinDeser and others, 2003; Reference Newman, Compo and AlexanderNewman and others, 2003). At best, the interannual persistence that does exist for some atmospheric variables only accounts for a small fraction of their total variance (for simple cases, the variance explained by the interannual persistence is equal to the square of the 1 year lag autocorrelation).
While we have analyzed only local records here, Stouffer and others (Reference Stouffer, Hegerl and Tett2000) addressed this issue on a global scale. Although they did not study the atmospheric fields most directly relevant for glacier mass balance, they analyzed the persistence of anomalies in annual-mean surface temperature, using the longest available datasets from observations extending back as far as 1854. Quoting from their conclusions: ‘the annual mean SAT [ = surface air temperature] variance is very close to 5 times the variance obtained from the 5 [year] time series in most continental areas; it appears the SAT time series is nearly white noise on these timescales. This suggests, according to Reference HasselmannHasselmann’s [1976] theory, that most of the surface temperature variance is dominated by atmospheric white noise [emphasis added].’ Stouffer and others (Reference Stouffer, Hegerl and Tett2000) do find weak interannual persistence (perhaps 1–2 year decorrelation times) for some maritime climates, as well as those in the vicinity of the sea-ice edge or centers of deep-ocean convection (i.e. well-mixed deep water columns). As emphasized below, and in the context of glacier variability, it is the memory intrinsic to the glacier itself, and not persistence in the climate system, that drives the long-timescale variations.
For the specific climate fields used for the model, we use output from a high-resolution (4 km) numerical weather-prediction model, the Pennsylvania State University–US National Center for Atmospheric Research Mesoscale Model version 5 (MM5; Reference Grell, Dudhia and StaufferGrell and others, 1995). MM5 has been in operational use over the region for the past 8 years at the University of Washington. It provides a unique opportunity to obtain information about small-scale patterns of atmospheric variables in mountainous terrain that begins to extend towards climatological timescales: a series of studies in the region has shown persistent patterns in orographic precipitation at scales of a few kilometers (Reference Colle, Mass and WestrickColle and others, 2000; Reference Anders, Roe, Durran and MinderAnders and others, 2007; Reference Garvert, Smull and MassGarvert and others, 2007; Reference Minder, Durran, Roe and AndersMinder and others, 2008).
Although 8 years is a short interval for obtaining robust statistics, the output from MM5 at the gridpoint nearest Diablo Dam agrees quite well with the observations there. From 75 years of observations at Diablo Dam, the mean annual accumulation is 1.89 ± 0.36 m a−1 (± 1σ hereafter, unless stated otherwise), whereas the output from MM5 at the nearest gridpoint to Diablo Dam is 2.3 ± 0.41 m a−1. For melt-season temperatures, the values in observations and MM5 are 16.8 ± 0.78°C and 12.7 ± 0.93°C respectively. The nearest meteorological observation to Mount Baker comes from the Elbow Lake SNOTEL site (US Natural Resources Conservation Service, http://www.wcc.nrcs.usda.gov/gis/index.html; 48°41′ N, 121°54′ W; 985 m a.s.l.), about 15 km away. For 11 years of data, the observed annual accumulation is 3.7 ± 0.77 m a−1,compared with 4.7 ± 0.80 m a−1 in the MM5 output. For melt-season temperatures the values are 13.3 ± 1.2°C and 11.7 ± 0.8°C respectively. It is the standard deviations that matter for driving glacier variations, so we consider this agreement sufficient to proceed with using the MM5 output. For Mount Baker, MM5 output gives an annual accumulation of 5.5 ± 1.0 m a− 1 and a melt-season temperature of 9.3 ± 0.8°C.
Spatial correlations in the interannual variability of mean annual precipitation and melt-season temperature in the vicinity of Mount Baker are high (>0.8) (Reference O’NealO’Neal, 2005; Reference PeltoPelto, 2006; Huybers and Roe, in press). Therefore, when the glacier model is evaluated against the glacier history of the past 75 years, we use the time series of observations at Diablo Dam scaled to match the standard deviation of the MM5 output at Mount Baker.
4.4. Parameter and data uncertainties
The combined uncertainty in AAR and μ is nearly a factor of four. These dominate over other sources of uncertainty, so we focus on their effects in the analyses that follow. Both of these factors have their biggest proportional effects on the ablation side of the mass balance (for the melt factor, exclusively so). Thus, as we find for Mount Baker glaciers, while it may be that a glacier is most responsive to accumulation variations, the uncertainty in that responsiveness is dominated by uncertainty in the factors controlling ablation. In this paper, we seek a general picture of glacier response to climate, so we explore this full range of uncertainty. However, for a specific glacier of interest, it is possible to better constrain both the AAR and the melt factor by careful measurements, at which point, it may be that other sources of uncertainty need to be more carefully accounted for.
4.5. Comparison with available mass-balance data
How well does the climate forcing applied to the glacier model agree with observations? Although a detailed mass-balance comparison is hampered by lack of data, some very useful guidance exists. As part of the North Cascade Glacier Climate Project (http://www.nichols.edu/departments/glacier/), Reference Pelto, Hardy and PomeroyPelto (2000) reports above-snowline accumulation of 5.0 ± 2.23 m w.e. a−1(1σ) between 1990 and 1999, for Easton Glacier. This is an average over two elevations (2300 and 2450 m) and measured in late summer. For Rainbow Glacier the value is 4.2 ± 1.56 m a−1 averaged over 1984–99 and measured at 1900 m, again in late summer. Obviously, having only accumulation rates at high elevations is not ideal, and they cannot be directly applied over the whole glacier. Recall that it is the standard deviation of interannual fluctuations that is important for characterizing the natural glacier variability; using the MM5 value of 1 m a−1 thus appears reasonable and is perhaps conservative. Ablation measurements are even sparser. Pelto (http://www.nichols.edu.departments/Glacier/bib.htm) reports ablation rates averaging 4.4 m a−1 for Easton Glacier in the 2002 and 2003 seasons (averaged over the whole glacier). This compares quite favorably with the 3.7 m a−1 for the linear model, calculated from the mid-range set of parameters in Table 1. The low and high end of parameter choices give 1.9 and 5.9 m a−1, suggesting that our mid-range values are appropriate in this setting.
5. Results
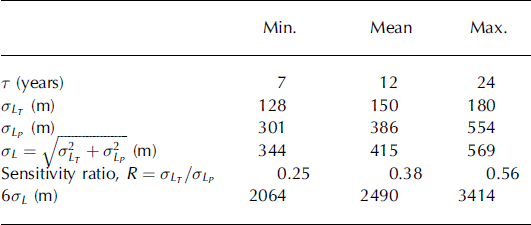
We first use the parameters of the typical Mount Baker glacier (Table 2) and use Equations (8) and (9) to calculate σLT and σLP , the variations in the model glacier’s terminus due to characteristic melt-season temperature (σT ) and precipitation (σP ) variability respectively. The range in σLT is 128–180 m, with a mid-range value of 150 m. The magnitude of σLP is significantly larger, 301–554 m, with a mid-range value of 386 m. Assuming the melt-season temperature and annual precipitation are uncorrelated, the combination of the two climate forcings gives a terminus range of 344–569 m, with a mid-range estimate of 415 m, dominated by precipitation variability. Note that this range of glacier length response is not found by simply combining the ranges of the separate responses to precipitation and melt-season temperature, since consistent combinations of parameters have to be chosen.
Minimum, mean and maximum estimates of standard deviations in glacier lengths for various glacier properties for the typical Mount Baker glacier defined in Table 1 and driven by climate variability determined from the MM5 model output. The range of values here is generated from the range of uncertainties in the melt factor and the AAR. Note that each row has to be calculated separately from other rows because of mutually incompatible parameter combinations
The relative importance of precipitation and melt-season temperature for the local mass balance is equal to μσT = σP . For Mount Baker, then, the model suggests that precipitation is more important than melt-season temperature by a factor of 1.5–2, depending on the chosen value of μ. This range is consistent with, for example, the conclusions of Bitz and Battisti (Reference Bitz and Battisti1999) as to the cause of mass-balance variations for several glaciers in this region.
Because of the differing accumulation and ablation areas, the relative importance of precipitation and temperature on the glacier length is different than for local mass balance. Using Equation (10), the ratio, R, varies from 0.25 to 0.56, with a mid-range value of 0.38. In other words, the model suggests that taking the characteristic local climate variability into account, the length of the average Mount Baker glacier is two to four times more sensitive to precipitation than to temperature variations. This is due to the very large interannual variability in precipitation. Thus we conclude that variability in Mount Baker glaciers is predominantly driven by precipitation variability.
A key point to appreciate about Equation (10) is that the relative importance of precipitation and melt-season temperature for a glacier length depends on the characteristic magnitude of the climate variability and so depends on location, as well as glacier geometry. Huybers and Roe (in press) use regional datasets of climate variability to explore how R varies around the Pacific Northwest. Maritime climates tend to have high precipitation rates and high precipitation variability, but muted temperature variability. The reverse is the case farther inland where, in more continental climates, temperature variability becomes more important for driving glacier variations.
5.1. Historical fluctuations of Mount Baker glaciers
Historical maps, photos and reports of Mount Baker glaciers indicate that they retreated rapidly from 1931 to 1940, paused, then began readvancing between 1947 and 1952 (e.g. Reference LongLong, 1955; Reference FullerFuller, 1980; Reference HarperHarper, 1992). This advance continued until ∼1980, when they again began to retreat. Although Rainbow and Deming Glaciers began to advance about 1947, earlier than the other Mount Baker glaciers, the terminal movement between 1947 and 1980 was 600–700 m for each Mount Baker glacier, underscoring the similar length responses of these glaciers over this period.
We use the 75 year long record of precipitation and melt-season temperature from the Diablo Dam weather-station data, scaled to have variance equal to the MM5 output at Mount Baker, and integrate Equation (1) for the typical Mount Baker glaciers from 1931 to 2006 and for the range of model uncertainties given in Table 2 (Fig. 4). The initial condition for the glacier model terminus is a free parameter. Choosing L′ = 600 m produces the best agreement with the observed record. Maximum changes in glacier length are on the order of 1000 m, similar to the observed data for this period and approximately 50% of the observed magnitude of the glacier-length changes over the last 200 years. There are some discrepancies between the model and the historical record: the model appears to respond a little quicker than the actual glaciers, probably due to the neglect of glacier dynamics in the model. However, we emphasize that the point is not to have the model be a simulation of the historical record, correct in all details. Rather, the point is to establish that the characteristic magnitude and the approximate timescale of glacier variations are adequately captured by the model.
Model glacier length variations from 1931 to 2006 using the time series of annual precipitation and melt-season temperature from Diablo Dam, scaled by the MM5 output for Mount Baker. The grey shading shows the zone of the range of model uncertainties given in Table 2. Also shown are the historical glacier fluctuation records from Harper (Reference Harper1992), O’Neal (Reference O’Neal2005) and Pelto (Reference Pelto2006). Negative numbers indicate retreat. The initial perturbation length at 1931 for the glacier model is a free parameter and was chosen to be 600 m to produce the best fit with the historical record.

Are the century-scale trends in glacier length, which are captured by the linear model in Figure 4, consistent with observed climate trends? For timescales much longer than τ, Equations (4) and (5) can be used to calculate the glacier length response to climate trends, so this provides another way to evaluate whether the sensitivity of the linear model is reasonable. For mid-range parameters, Equation (4) predicts that a 1°C temperature change in melt-season temperature causes a 920 m retreat of the glacier. Mote (Reference Mote2003) finds a 0.83°C increase in annual mean temperature in the central Cascades (statistically significant at >95%) and a 0.6°C increase in summertime temperature over the course of the 20th century. Thus the observed retreat of around 500 m on Mount Baker is indeed consistent with the glacier model sensitivity and observed temperature trends.
Establishing trends in glacier accumulation is harder than for temperature for several reasons: the absence of long records, the high degree of interannual variability in regional precipitation and snowpack, the opposing tendencies of increasing precipitation (e.g. Reference MoteMote, 2003) and decreasing mountain snowpack (e.g. Reference Mote, Hamlet, Clark and LettenmaierMote and others, 2005) in a warming climate, and the complicated elevation dependence of changes in snowpack. Equation (5) predicts that a 0.5 m a−1 decrease in accumulation causes a ∼1 km retreat of the glacier terminus.
5.2. Glacier variations over longer timescales
The success at simulating glacier length variations using historical climate data for the last 75 years suggests the model provides a credible means for estimating characteristic length-scale variations on longer timescales. Table 2 gives the range of estimates of the standard deviation of glacier fluctuations in response to the observed interannual climate variability. If forced with normally distributed interannual fluctuations, Equation (1) will produce normally distributed glacier length fluctuations. Thus, by definition of the standard deviation, the glacier will spend ∼30% of its time outside ±1σ, ∼5% of its time outside ±2σ and ∼0.3% of its time outside ±3σ. Therefore the statistical expectation is that, for three years out of every thousand, the maximum and minimum lengths of the glacier during that time will be separated by at least 6σ. Table 2 shows that this range of parameter uncertainty, 6σ, varies between 2064 and 3414 m, with a mid-range estimate of 2316 m. We emphasize this millennial-scale variability must be expected of a glacier even in a constant climate, as a direct result of the simple integrative physics of a glacier’s response time, or memory.
To convey a sense of what this means in practice, Figure 5a shows a 5000 year integration of the linear model, with geometry parameters equal to our typical Mount Baker glacier. The glacier model was driven by normally distributed random temperature and precipitation variations, with standard deviations given by the MM5 output for Mount Baker. By eye, it can be seen that there is substantial centennial-scale variability, with amplitude, 2–3 km. Also shown in Figure 4a are maximum terminus advances that are not subsequently overridden. Therefore these suggest occasions when moraines might be left preserved on the landscape (though the precise mechanisms of moraine deposition and conditions for preservation remain uncertain). Just by the statistics of chance, the further back in time one goes, the likelier it is that moderate advances and retreats have been overridden, so moraines become more widely separated in time (e.g. Reference Gibbons, Megeath and PierceGibbons and others, 1984). Again we emphasize that none of the centennial and millennial variability in our modeled glacier terminus arises because of climate change. To infer a true climate change from a single glacier reconstruction, the glacier change must exceed, at some statistical level of confidence, the variability expected in a constant climate.
(a) 5000 year integration of the linear glacier model using parameters similar to the typical Mount Baker glacier (Table 1) and driven by random realizations of interannual melt-season temperature and precipitation variations consistent with statistics for Mount Baker from the MM5 model output. The black curve shows the time series for the mid-range estimate of parameters. The green curve is a 100 year running average. The dots denote maximum terminus advances that are not subsequently overridden and so are possible times for moraine formation. (b) The black curve is the power spectral density (PSD) estimate of the time series generated using the mid-range parameters. The gray curve is the theoretical red-noise spectrum (solid), together with its 95% confidence band (dashed) (AR(1): first-order autoregressive process). Spectra were calculated using a periodogram with a 1000 year Hanning window. The arrow shows the frequency corresponding to 1/τ, so the spectrum emphasizes that much of the variability in the glacier time series occurs at periods much longer than the physical response time of the glacier.

Figure 5b shows the power-spectral estimate of the terminus variations in Figure 4a, together with the theoretical spectrum for a statistical process given by Equation (8) (e.g. Reference Jenkins and WattsJenkins and Watts, 1968; Reference Von Storch and Zwiersvon Storch and Zwiers, 1999). It can be shown that half the variance in the power spectrum occurs at periods at least 2π times longer than the physical timescale of the system, in this case, τ = 12 years (e.g. Reference RoeRoe, 2009). Thus there is centennial and even millennial variability in the spectrum, all fundamentally driven by the simple integrative physics of a process with a, perhaps surprisingly, short timescale and forced by simple stochastic year-to-year variations in climate.
5.3. Comparison with a dynamic glacier model
We next briefly evaluate the behavior of the linear glacier model compared to that of a dynamic flowline model (e.g. Reference PatersonPaterson, 1994). The model incorporates the dynamical response of a single glacier flowline, based on the shallow-ice approximation (e.g. Reference PatersonPaterson, 1994). Assuming a no-slip lower boundary condition, the flowline obeys a non-linear diffusion equation governed by Glen’s flow law (e.g. Reference PatersonPaterson, 1994):

where x is the horizontal coordinate, h(x) is the thickness of the glacier, z
s is the surface slope,  is the net mass balance at a point on the glacier, ρ is ice density and g is gravitational acceleration. The exponent relating applied stress to strain rates, n, is set equal to 3, and A is a softness factor taken to be 5.0 × 10⁻²⁴ Pa−3 s−1.The flowline model is a reasonable representation of ice flow, and also includes the non-linearities of the mass-balance perturbation. Thus a comparison between models is a useful evaluation of the validity of the assumptions made in deriving the linear model.
Equation (12) can be solved using standard numerical methods. Figure 6a shows the length history from an integration of the dynamical flowline model for climatic and geometrical conditions identical to the linear model calculations shown in Figure 5, and for mid-range values of parameters shown in Table 1. Figure 6b–d show a smaller segment of the integration, together with the melt-season temperature and accumulation variations that force the glacier. We emphasize again that the climate just reflects the random, interannual fluctuations inherent to a constant climate. The figure demonstrates that large and persistent climate fluctuations are not necessary to drive large and persistent glacier fluctuations.
(a) Glacier length variations from a 5000 year integration of a dynamical flowline glacier model in a constant climate using the same parameters as the linear model and as described in the text. Note the slightly reduced length variations compared to the linear model. (b) A 500 year long segment of glacier-length variations from (a). (c, d) Melt-season temperature (c) and accumulation (d) variations that drive the length variations. A 30 year running mean is also shown. As in Figure 5, the climate forcing is white noise, scaled by the characteristic amplitude of variability near Mount Baker, reflecting the random interannual fluctuations inherent in a constant climate. The figure demonstrates that large, persistent climate fluctuations are not necessary to produce large, persistent fluctuations in glacier length.

The dynamical model produces a glacier length record with a standard deviation of 370 m, compared with 420 m for the linear model. Thus the magnitudes of variations produced by the two models are similar, though there is a suggestion that the linear model may overestimate the glacier response by about 15%. Obviously a much fuller exploration of the glacier dynamics is possible; no glacier sliding has been included, nor has there been any account of the confining lateral stresses of the side-walls. Computational constraints limit the model resolution to 75 m, and the pattern of the climatic perturbations has been assumed uniform. Such an exploration is important to undertake and is the subject of ongoing work. However, the purpose in the present study is to establish that the linear model produces a reasonable magnitude of glacier variability compared with a model incorporating ice-flow dynamics and without linearization of the mass balance.
6. Summary
A simple linear model has been presented for estimating the response of typical mid-latitude glaciers to climate forcing, with a particular focus on the interannual variability in accumulation and melt-season temperature that is inherent even in a constant climate. With one free matching parameter allowed, and otherwise using standard physical, geometrical and climatic parameters pertaining to the region, the model produces a reasonable simulation of the observed variations of glaciers on Mount Baker in the Cascade Range of Washington State over the past 75 years. The magnitude of variability in the simple model also approximates that seen in a more complicated model incorporating ice-flow dynamics.
Mount Baker glacier lengths are more sensitive to accumulation than to melt-season temperature, by a factor of 2–4. The maritime climate and mountainous terrain of the region produces large interannual accumulation variability (∼1 m a−1) and muted melt-season temperature variability. By contrast, calculations using the same model for glaciers in contintental climates show the reverse sensitivity (Huybers and Roe, in press). The expression given in Equation (10) is a simple and robust indicator of the relative importance of melt-season temperature and accumulation variability for a glacier. The uncertainty factor of 2 is principally due to uncertainty in the melt factor and the AAR. Both of these can be much more tightly constrained for specific glaciers by careful observations, and several lines of evidence support the mid-range parameter values as being appropriate for this setting.
Within the bounds of the observed natural variability in climate expressed by instrumental observations between 1931 and 1990 and the range of model parameters that we consider to be reasonable, the 1.3–2.5 km length fluctuations on Mount Baker attributed to the LIA can be accounted for by the model without recourse to changes in climate. A variety of external climate forcings are commonly invoked to explain glacier length fluctuations on centennial to millennial scales (e.g. changes in the strength of the atmospheric circulation (e.g. Reference O’Brien, Mayewski, Meeker, Meese, Twickler and WhitlowO’Brien and others, 1995), atmospheric dust from volcanic eruptions (e.g. Reference Robock, Free, Jones, Bradley and JouzelRobock and Free, 1996) and variations in sunspot activity (e.g. Reference Soon and BaliunasSoon and Baliunas, 2003)). However, the model results indicate that, at least in this setting, kilometer-scale fluctuations of the glacier terminus do not require a substantial change in temperature or precipitation, and should be expected simply from natural year-to-year variability in weather.
It is worth being clear about the logic of the argument being made. Nothing we have done is a definitive demonstration that no climate change occurred in the Pacific Northwest. However, in order to demonstrate that glacier histories are indeed a response to climate change, we must first falsify the null hypothesis of no climate change. In particular, to attribute the nested sequences of late-Holocene moraines on Mount Baker to a distinct climate change, we require that changes in glacier length were larger, or of longer duration, than that expected to be driven by the observed instrumental record of interannual variability. Our results suggest that, by itself, the most recent two centuries of glacier history at Mount Baker do not falsify the null hypothesis.
7. Discussion
7.1. Model framework
The linear glacier model required several important assumptions about ice dynamics and also neglected non-linearities in the glacier mass balance. We discuss here what the consequences of doing this might be. Comparing with a non-linear dynamical flowline glacier model, we find that the linear model produces variability about 15% larger than the dynamical model. This is adequate agreement; we emphasize that for the purpose of this paper the magnitude of glacier variability only needs to be reasonably represented and therefore that the linear model is an adequate tool for the question posed. Indeed, in view of other uncertainties in the problem such as the details of the glacier mass balance, it is unclear what value would be added by employing a more complex glacier model. Nonetheless, further exploration of the reasons for the differences between the two glacier models would be interesting and enlightening.
Note also that we focused on a single characteristic Mount Baker glacier, but one should expect some sizeable differences in the magnitude of glacier variability, even among glaciers as close together as those around Mount Baker, because of differences in geometry. For example, A tot has a considerable influence on glacier variability, as we see for example from Equations (8) or (9), and A tot varies by a factor of 2 among Mount Baker glaciers (Table 1).
Our approach to the relationship between climate and glacier mass balance was crude. A distinction between snow and rain might be more carefully made. Based on the fraction of annual precipitation in winter, we estimate this might perhaps have a 20% effect on our answers. In addition, we assumed a simple proportionality between ablation and temperature of a melt season of fixed length. A treatment based on positive degree days could easily be substituted (e.g. Reference Braithwaite, Olesen and OerlemansBraithwaite and Olesen, 1989). However, it is not temperature per se, but rather heat, that causes ablation. A full surface energy-balance model is necessary to account for the separate influence of radiative and turbulent fluxes, albedo variations, cloudiness, and aspect ratio of the glacier surface on steep and shaded mountain sides (e.g. Reference Rupper and RoeRupper and Roe, 2008; Rupper and others, in press). It is hard to single out any of these effects as more important than the others. To pursue all of them in a self-consistent framework would require a detailed surface energy-balance and snowpack model, including the infiltration, percolation and refreeze of meltwater. The resulting system would be complicated, and it is not clear that, with all its attendant uncertainties, it would produce a higher-quality or more meaningful answer than our first-order approach.
Several other factors that we have not incorporated probably act to enhance glacier variability over and above what we have calculated. The interannual variability we assumed was less than that implied by limited wintertime mass-balance observations, perhaps due to our having neglected mass sources due to avalanching and wind-blown snow, both of which increase the effective area over which a glacier captures precipitation. We have assumed the glacier surface slope is linear. The characteristically convex-up profile of a real glacier acts to enhance the glacier sensitivity, since the ablation area as well as the ablation rate increases with increasing melt-season temperature (e.g. Reference Roe and LindzenRoe and Lindzen, 2001). Including a feedback between glacier thickness and length increases the timescale and magnitude of the glacier fluctuations (e.g. Reference Harrison, Elsberg, Echelmeyer and KrimmelHarrison and others, 2001; Reference OerlemansOerlemans, 2001). Finally, while no statistically significant interannual memory in annual precipitation could be demonstrated from the available weather-station records near Mount Baker, other gridded atmospheric reanalysis datasets do suggest some weak interannual persistence. Although annual mean precipitation varies spatially within the region, Huybers and Roe (in press) find some 1 year lag correlations in anomalies of around 0.2–0.3, and Stouffer and others (Reference Stouffer, Hegerl and Tett2000) find similar values for mean annual temperature in some maritime settings. A small autocorrelation like this makes it slightly more likely that the next year’s precipitation anomaly will have the same sign as this year’s and so act to re-enforce it. Huybers and Roe (in press) show that a 1 year climate autocorrelation of r is enough to amplify the glacier variability in Equations (8) and (9) by a factor of  , or about 35% for r = 0.25, similar to that found by Reichert and others (Reference Reichert, Bengtsson and Oerlemans2002). For addressing the persistence of climate anomalies elsewhere in the world, it is important to extend the analyses of Stouffer and others (Reference Stouffer, Hegerl and Tett2000) to melt-season temperatures and annual precipitation, which are fields of more direct relevance to glacier mass balance. This work is in progress. On the basis of all the arguments given above, we have every reason to think that our estimate of glacier response to natural climate variability in this setting errs on the conservative side.
7.2. Implications
One lesson from our analyses is that small-scale patterns in climate forcing, inevitable in mountainous terrain, are tremendously important for adequately capturing the glacier response. Had we used the nearest long-term record, from the weather station at Diablo Dam, we would have underestimated the glacier variability by 65%. The lapse rate that the glacier surface experiences during the melt season has an important effect on the glacier response, as can be seen from Equations (2), (8) and (9). The relevant lapse rate is likely not simply a typical free-air value, as assumed here, but rather some complicated dependence on local setting and mountain meteorology (P.W. Mote and others, unpublished information). The archive of high-resolution MM5 output provides an invaluable resource for the investigation of such effects and will be the focus of future investigations.
It is also possible to take advantage of spatial patterns of glacier variability in interpreting climate. Huybers and Roe (in press) show that spatial patterns of melt-season temperature and annual precipitation are coherent across large tracts of western North America, though not always of the same sign (e.g. there is an anticorrelation of precipitation between Alaska and the Pacific Northwest). On spatial scales for which patterns of natural climate variability are coherent, coherent glacier variability must also be expected; tightly clustered glaciers provide only one independent piece of information about climate. Huybers and Roe (in press) use Equation (1) to evaluate how patterns of melt-season temperature and annual accumulation are convolved by glacier dynamics into regional-scale patterns of glacier response.
Patterns of climate variability that are spatially coherent and also account for a large fraction of the local variance are regional in scale, so the current worldwide retreat constitutes a powerful suggestion of global climate change (e.g. Reference OerlemansOerlemans, 2005). However, a formal attribution of statistical significance requires (1) propagation of the probability distribution of uncertainties in model parameters through the glacier model; (2) accounting for the relative importance of melt-season temperature and precipitation in different climate settings; (3) evaluation of how much independent information is represented by clustered glacier records; and (4) determination of whether the trend rises above the expected background variability. We anticipate that the global glacier record will probably pass such a significance test, but performing it will add greatly to the credibility of the claim. The model presented here provides a tool for such a test.
The long-term, kilometer-scale fluctuations predicted by the model provide the opportunity to suggest alternative interpretations or scenarios for moraine ages, which are often attributed to poorly dated glacier advances between the 12th and 20th centuries. Many moraines at Mount Baker, and in other Cascade glacier forelands with similar physiographic settings and glacier geometries, have been dated by dendrochronology using tree species that are at the limit of their lifespan. The range of glacier fluctuations produced by the model, combined with these poor constraints in the actual landform ages, suggests that these moraines may be products of even earlier advances, not necessarily synchronous with each other and certainly not necessarily part of a global pattern of climate fluctuations. Random climatic fluctuations over the past 1000 years may have been ample enough to produce large changes in glacier length, and until quantitative dating techniques can be used to reliably correlate widely separated advances from this interval, these advances cannot be used as the main evidence for a synchronous signal of regional or global climate change.
The primary purpose of this paper was to explore the idea that substantial long-timescale glacier variability occurs even in a constant climate. We have focused our analyses on the Pacific Northwest, and found that the null hypothesis, that no climate change is required to explain the 19th-century advances on Mount Baker, cannot be ruled out. Reichert and others (Reference Reichert, Bengtsson and Oerlemans2002) came to the same conclusion for Nigardsbreen and Rhoneglestcher. Given the importance of the question, it is crucial to extend these calculations to other glacier settings, both considering variations in glacier geometry and evaluating the interannual persistence of climate variables most relevant to glaciers. Such work is currently under way.
The results raise the possibility that variations recorded in many glacier histories may have been misattributed to climate change. The effect on glacier length of the inter-annual variations inherent in a constant climate should not be ruled out as a factor in explaining glacier histories without a careful analysis being made. Although glacier records form the primary descriptor of climate history in many parts of the world, those records are in general fragmentary, and provide only a filtered glimpse of the magnitude of individual glacier advances and retreats, and of the regional or global extent of the coherent patterns of glacier variations.
The formal evaluation of whether the magnitude or regional coherence of glacier variability does or does not exceed that expected in a constant climate is a detailed and complicated exercise. At a minimum, it involves knowing (1) small-scale patterns of climate forcing and their variability, (2) the relationship between those variables and the glacier mass balance and (3) that the glacier dynamics are being adequately captured. Regional- or global-scale patterns of past glacier variability are also useful, but suffer from difficulties in accurately cross-dating the histories. Our results demonstrate, however, that such an evaluation must be performed before glacier changes can confidently be ascribed to climate changes. Given the very few examples where this has been done at the necessary level of detail, a substantial re-evaluation of the late-Holocene glacier record may be called for.
Acknowledgements
We thank K. Huybers, S. Rupper, E. Steig, B. Hansen, C. Wunsch, E. Waddington and C. Raymond for insightful conversations and comments. We are enormously grateful to J. Minder and N. Johnson for heroic efforts to compile the MM5 output from archives. We also appreciate detailed comments from T. Jóhannesson and two anonymous reviewers that were instrumental in focusing the manuscript. G.H.R. acknowledges support from US National Science Foundation (NSF) Continental Dynamics grant No. 0409884.
Appendix Derivation of Linear Glacier Model Equations
Here we derive the equations used in the linear glacier model, using the geometry shown in Figure 2. Following Jóhannesson and others (Reference Jóhannesson, Raymond and Waddington1989), the model considers only conservation of mass. The rate of change of glacier volume, V, can be written as

We assume the ablation rate is μT, where T is the melt-season temperature and μ is the melt factor. A constant might be added to the ablation rate as in Pollard (Reference Pollard1980) or Ohmura and others (Reference Ohmura, Wild and Bengtsson1996). However, since the model equations will be linearized about the equilibrium state, the constant would not enter into the first-order terms. We also assume that all melting ends up as run-off.
Let the temperature at any point on the glacier be given by

where x is the distance from the head of the glacier, Tp is the melt-season temperature at the head of the glacier, Γ is the atmospheric lapse rate, and φ is the slope of the glacier surface (assumed parallel to the bed). The temperature at the toe of the glacier of length L is then equal to

There is some melting wherever the melt-season temperature exceeds 0°C, and the area of the melting zone is given by AT> 0 = w(L − xT = 0). Since temperature decreases linearly with elevation and the local melt rate is proportional to temperature, the total melting that occurs is equal to 0.5 times the total melt area, multiplied by the melt rate at the toe of the glacier (this is simply the area under the triangle of the melt-rate–distance graph), or in other words,

Note that melting above the ELA is included in this calculation. The total accumulation is just the product of the precipitation rate, P (assumed uniform over the glacier), and the total glacier area, A tot.
We now linearize the glacier system, about some equilibrium climate state denoted by an overbar:  ,
 , and
 , where the climate anomalies are uniform over the glacier. Similar to previous studies, H and w are assumed constant (e.g. Reference Jóhannesson, Raymond and WaddingtonJóhannesson and others, 1989; though this assumption can be relaxed (e.g. Reference OerlemansOerlemans, 2001)), which means V′ = wHL′. We also note that the melt-season freezing line, xT
= 0, can be found from Equation (A3):

So in the perturbed state and using Equations (A2) and (A3), Equation (A4) becomes:

Substituting xT = 0 from Equation (A5) and rearranging a little gives

which, using Equation (A5), can be written as

Note that  is the area over which melting occurs. For accumulation we can write

Taking only first-order terms, and combining Equations (A1), (A8) and (A9), we obtain

One last simplification is possible. At the climatological ELA,

and so

where Equations (A2) and (A5) have been used. Defining the ablation zone in the sense of, for example, Reference PatersonPaterson (1994), as the region below the ELA, we can write  . Finally then, Equation becomes

where the overbars have been dropped for convenience. Equation (A12) is the governing equation of the glacier model used in this study.
Lastly, using Equation (A11) the relationship between the melt-zone area and the ablation-zone area is given by

For the standard model parameters given in Table 1, A T > 0 adds another 1.67 km2 to A abl.



