Implications
Animal welfare assessment requires tools that are sufficiently sensitive to detect subtle changes in an animal’s state. QBA is a methodology that, given its integrative nature, may pick up on subtle changes in an animal’s expressive demeanour and thus make a valuable contribution to animal welfare studies. However, the use of qualitative methodologies in animal science is relatively novel, and requires appropriate development and validation. Sensitivity to context is a key characteristic of qualitative methods that needs careful evaluation and management. The outcomes of this paper indicate that rankings of animals on multivariate dimensions of expression are relatively robust, but that mean numerical values of animal scores on these dimensions may shift, and that careful attention therefore needs to be paid to the training and alignment of observers in the use of visual analogue scales.
Introduction
Behaviour is arguably the most important measure of animal welfare, since it is an expression of an animal’s physiological and affective state, and if behavioural assessments are focused more broadly, then arguably motivation and mental state can also be assessed (Dawkins, Reference Dawkins2004). Furthermore, behaviour is relatively obvious and therefore easy to record or quantify in a non-invasive manner. However, there is often a lack of certainty regarding what behaviour indicates about an animal’s experience. For example, it can be difficult to interpret the relevance of behavioural actions (e.g. tail flicking, ear position, walking, lying) in terms of the animal’s welfare. Qualitative behavioural data may provide useful information in this regard (Wemelsfelder, Reference Wemelsfelder1997; Fraser, Reference Fraser2009) since they address the expressive manner in which the animal is carrying out each action. For example, an animal could be flicking its tail in a relaxed manner (i.e. to dislodge flies) or in an aggressive manner; understanding the difference between the two reveals how an animal is responding to its environment, and is a natural part of good stockmanship skills.
In human psychology, qualitative observations and ratings have long formed a standard component of research and clinical assessments (reviewed by Meagher, Reference Meagher2009), but for animals too, qualitative methods have the potential to provide a powerful tool in helping to interpret measures of animal health, physiology or behaviour. Recent reviews (Meagher, Reference Meagher2009; Whitham and Wielebnowski, Reference Whitham and Wielebnowski2009) suggest that, when applied properly, observer-based methods can be robust and perform a useful task in scientific investigations. To investigate and develop this role, validation of these tools is necessary, in terms of observer reliability, cross-validation against other methods and understanding sensitivity to experimental treatment (Meagher, Reference Meagher2009).
Qualitative Behavioural Assessment (QBA) is a methodology that has been developed to capture and quantify the expressive quality of animal demeanour (Wemelsfelder et al., Reference Wemelsfelder, Hunter, Mendl and Lawrence2000 and Reference Wemelsfelder, Hunter, Mendl and Lawrence2001). It relies on observers to integrate the dynamic aspects of how animals interact with their environment, rather than what they are physically doing. Focussing on the whole animal, observers summarise all perceived details of an animal’s posture and movement into descriptions of expressive demeanour (e.g. relaxed, anxious, playful, content; Stevenson-Hinde, Reference Stevenson-Hinde1983; Feaver et al., Reference Feaver, Mendl and Bateson1986; Wemelsfelder, Reference Wemelsfelder1997 and Reference Wemelsfelder2007). Consequently, difficult-to-assess affective states may become evident; for example, tiredness (lack of ‘engagement’) has been quantified in endurance horses at different stages of a 160-km ride (Fleming et al., Reference Fleming, Paisley, Barnes and Wemelsfelder2013). Importantly, because demeanour is dynamic, QBA allows capture of subtle changes in an animal’s body language, which may be important for welfare assessment and may otherwise be overlooked when individual physical behaviours are isolated and quantified (Wemelsfelder, Reference Wemelsfelder1997 and Reference Wemelsfelder2007; Meagher, Reference Meagher2009; Whitham and Wielebnowski, Reference Whitham and Wielebnowski2009).
QBA was originally developed using a free-choice profiling (FCP) methodology, where multiple observers generate and use their own descriptive terms to score animals, either watching the animals at the same time, or being shown the same footage (Wemelsfelder et al., Reference Wemelsfelder, Hunter, Mendl and Lawrence2001). However, for practical on-farm welfare assessments, it is more feasible to use fixed lists of QBA terms specifically developed for different species (as applied under the European Union Welfare Quality audits, e.g. Temple et al., Reference Temple, Dalmau, Ruiz de la Torre, Manteca and Velarde2011a; Andreasen et al., Reference Andreasen, Wemelsfelder, Sandøe and Forkman2013).
Recent FCP-based studies indicate that QBA can be reliably applied to animal studies, showing good inter-observer agreement and meaningful correlation with physical and physiological measures of behaviour across a range of species (reviewed by Wemelsfelder, Reference Wemelsfelder2007). In addition, in blind observer trials, observers have successfully distinguished between different treatment groups (Minero et al., Reference Minero, Tosi, Canali and Wemelsfelder2009; Stockman et al., Reference Stockman, Collins, Barnes, Miller, Wickham, Beatty, Blache, Wemelsfelder and Fleming2011 and 2013; Rutherford et al., Reference Rutherford, Donald, Lawrence and Wemelsfelder2012; Wickham et al., Reference Wickham, Collins, Barnes, Miller, Beatty, Stockman, Blache, Wemelsfelder and Fleming2012 and in press), between different stages of an endurance ride (Fleming et al., Reference Fleming, Paisley, Barnes and Wemelsfelder2013), and different housing systems (Temple et al., Reference Temple, Manteca, Velarde and Dalmau2011b). Thus, there is growing evidence that QBA can be applied across different species as a valid and useful method of informing animal welfare assessment.
One reason qualitative assessments can be so informative is that they are sensitive to environmental context. Taking environmental clues into account and evaluating the animal’s situation allows observers to make a more discerning, and potentially quantitatively more powerful, judgment of an animal’s behavioural style. However, this sensitivity also makes qualitative assessments vulnerable to undesirable bias due to the observers’ judgment of that context (Wemelsfelder et al., Reference Wemelsfelder, Nevison and Lawrence2009). This is particularly a risk when different contexts might have different moral connotations. However, Wemelsfelder et al. (Reference Wemelsfelder, Nevison and Lawrence2009) found that observers viewing exactly the same footage of 15 growing pigs interacting with a novel object, but digitally projected onto either an indoor or outdoor background, were not unduly affected by this background. There was a small quantitative shift in mean pig scores due to background; however, this shift did not distort the overall characterisation of pigs’ expressive demeanour as either confident or timid. On the other hand, a recent study by Tuyttens et al. (Reference Tuyttens, de Graaf, Heerkens, Jacobs, Nalon, Ott, Stadig, Van Laer and Ampe2014) found that observers’ assessments of laying hens in a conventional commercial aviary, shown to observers in one video clip, was significantly affected by background information; observers who were told the aviary was on an organic farm attributed a more positive affective state to the hens than those told it was a conventional farm, and the size of this effect correlated to their pre-recorded opinions on hen welfare in organic v. conventional systems.
Thus further investigation of the contextual sensitivity of QBA is important, both to be able to make best use of QBA’s context sensitivity, and to be able to manage any undesirable bias it may impose on scientific assessments. The present paper is based on opportunities that arose in previous QBA studies with sheep, to study more closely how the structuring of video footage shown to observers, and provision of background information to observers, affected these observers’ assessments. Two separate case-studies are reported: Study 1 investigated how mixing target video footage of transport-habituated sheep with two different sets of other footage (viewed in separate sessions) affected observer assessments, whereas Study 2 investigated how different amounts of verbal background information affected the assessments of two sets of observers viewing the same footage of sheep in a behavioural demand facility.
Material and methods
Study protocols
Study 1: the structuring of video footage
Details of the larger experimental project from which the procedures for the present study were derived are available elsewhere (Wickham et al., Reference Wickham, Collins, Barnes, Miller, Beatty, Stockman, Blache, Wemelsfelder and Fleming2012 and in press). Briefly, 14 Merino weathers (14 months of age; 46.4±0.4 kg) were randomly selected from a transport-naïve flock. Sheep were transported multiple times over the same route within a single deck trailer (2.0×3.6×1.6 m; W×L×H) at a stocking rate of 0.45 m2/head. The route taken during each transport event was ~65 km (taking ~90 min) and included a mixture of main roads (speed limit 50 to 70 km/h) and highways (speed limit 70 to 100 km/h).
Video footage of the sheep was recorded throughout transport using digital camcorders fixed to the front and back of the transport trailer above sheep head height (~1.6 m from the trailer floor). Ten of the 14 sheep were clearly visible in the footage from all transport events. This continuous footage was edited to provide one clip (20 to 60 s long) of each individual from each experimental journey within the first 15 min after departure. Clips were chosen based on the sheep’s head being visible for the majority of the clip and the truck being in motion. These clips were edited to highlight focal sheep by increasing the opacity of the surrounding animals in the same frame (Adobe Premiere Pro CS3 and After Effects CS3; San Jose, CA, USA).
For the purpose of the present study, observers were twice shown the same footage of these sheep, which was collected when they had become habituated to transport (‘habituated’; their seventh transport event undertaken over 8 days). In separate observer viewing sessions, this ‘habituated’ footage (10 clips; one of each individual) was interspersed either with footage of the same individuals collected during their first exposure to transport (10 clips; one of each individual when they were ‘naïve’), or with footage collected when the flooring of the trailer was altered, removing the metal grate that provided a grip-flooring (10 clips; one of each individual when they were exposed to ‘non-grip flooring’).
Study 2: the provision of background information to observers
Details of the larger experimental project from which the procedures for the present study were derived are available elsewhere (Verbeek et al., Reference Verbeek, Waas, McLeay and Matthews2011; Stockman et al., Reference Stockman, Collins, Barnes, Miller, Wickham, Verbeek, Matthews, Ferguson, Wemelsfelder and Fleming2014). Briefly, footage of 22 pregnant Coopworth ewes (91 to 105 days gestation) of three body condition scores (BCS; with increasing BCS reflecting a sheep’s increasing condition, i.e. mass relative to size; BCS 2 n=8; BCS 3 n=8; BCS 4 n=6), was collected during a food motivation test. The setup allowed ewes to approach a feeder where they were given 20 s to consume a fixed-size food reward present before an auditory signal was provided (for 2 s) and then a gate (transversing the race) slowly moved the animal away from the reward end to a specified distance (cost distance) before returning. The animal could choose to return to the feeding station for another food reward and could repeat this process without restriction during the 23-h test period.
Continuous video footage was edited to provide a clip (average 2 min in length) for each sheep (total of 22 clips) showing one feed motivation sequence (gate moving from home end to reward end, feeding period, gate moving from reward end back towards the home end). We used the first available footage of the animal within the first 30 min of the test where the sheep was clearly in view. The experimental ‘cost distances’ (see above) were based on the available footage and were either 6.9 or 13.2 m (BCS 2 n=6, 2; BCS 3 n=6, 2; BCS 4 n=5, 1) but had no effect on the QBA results (Stockman et al., Reference Stockman, Collins, Barnes, Miller, Wickham, Verbeek, Matthews, Ferguson, Wemelsfelder and Fleming2014).
Clips were also viewed by the researchers and the presence of key behaviours were recorded: movement towards the feeder (or stopping), following directly behind the gate (or at a self-determined pace), putting head directly into the feeder (or standing looking around first), pawing the feeder, being pushed back to the home position by the gate.
QBA viewing sessions
All observers for this study were recruited from university staff and students and members of the public by advertising via email and accepting all those that responded. At the start of the study, observers were asked to complete a survey identifying their level of experience with sheep (e.g. they were asked to identify how much time they had spent working with sheep in their lifetime). Upon completion of the sessions, observers participating in the behavioural demand experiment were also asked to complete a survey asking them to indicate whether they thought they could tell if sheep were hungry or not, and identify behaviours that they thought indicated these states.
At the start of the first session for both Study 1 and 2, observers were instructed in QBA and in the FCP procedures facilitating QBA. FCP consists of a term-generation session followed by quantification session(s) (Wemelsfelder et al., Reference Wemelsfelder, Hunter, Mendl and Lawrence2001; Rousing and Wemelsfelder, Reference Rousing and Wemelsfelder2006).
For term generation, observers were shown video clips of sheep demonstrating a wide range of behavioural expressions and experimental and housing conditions. After watching each clip, observers had 2 min to write down any terms that they thought described the animal’s expression; that is, they were asked to describe how the animal was behaving, its style of movement, not what it was doing (Wemelsfelder, Reference Wemelsfelder2007). There was no limit imposed to the number of descriptive terms an observer could generate. Subsequent editing of the observer terms was carried out to transform all terms to the positive for ease of scoring (e.g. unhappy became happy).
During the subsequent quantification session(s), observers used their own descriptive terms as quantitative rating scales. Descriptive terms were printed in alphabetic order in a list (i.e. effectively a random order where terms with similar meaning were not listed together), with each term attached to a Visual Analogue Scale of 100 mm length, ranging from minimum (attributed a score of 0) to maximum (attributed a score of 100). Each observer used each of their terms to quantify the behavioural expression of every sheep.
Study 1: the structuring of video footage
A total of 63 observers attended three sessions (term generation and two quantification sessions). Observers were not told about the experimental treatments or that the sheep were on a truck. In the first quantification session, observers watched 20 clips from the ‘naïve’ and ‘habituated’ transport events (10 clips of each transport treatment, presented in randomised order), and in the second quantification session they watched 20 clips from the ‘non-grip flooring’ and ‘habituated’ transport events (10 clips of each transport treatment, presented in randomised order).
Study 2: the provision of background information to observers
This study was run independently with two observer groups, who each attended two sessions (term generation and one quantification session). We had no control over the numbers of respondents for each group. The first group of 21 observers were given detailed instructions on completing the QBA sessions but were not told anything about the experimental treatments or the experimental environment. The second group of 11 observers were given details about the QBA method as well as information that would allow them to understand the context of the behavioural demand facility at the commencement of the quantification session: the observers were told that the animals were well habituated to the environment, that they were able to obtain food from the feeders (sensors provide a designated amount of feed when the animal accesses the feeder), and that they had a set amount of time to eat this reward before the gate would push them back a set distance. They were not told that there was an auditory signal indicating that the gate was about to move or that the sheep were of different BCS. The two observer groups were shown the same 22 clips of individual sheep (presented in randomised order).
Calculation of QBA scores
Observer scores were analysed via Generalised Procrustes Analysis (GPA) using a specialised GenStat software edition written for Françoise Wemelsfelder. Details of this procedure are given elsewhere (Wemelsfelder et al., Reference Wemelsfelder, Hunter, Mendl and Lawrence2000 and Reference Wemelsfelder, Hunter, Mendl and Lawrence2001; Fleming et al., Reference Fleming, Paisley, Barnes and Wemelsfelder2013). Briefly summarised, GPA calculates a consensus or ‘best fit’ profile between observer assessments through complex pattern matching. This consensus profile has a number of main dimensions (usually reduced down to 2 or 3) explaining the variation between animals. The majority of variation is explained by the first dimension, with decreasing explanatory power for subsequent dimensions. Each animal receives a quantitative score on each of these dimensions. Interpretation of the consensus dimensions is made possible by identifying descriptive terms for each observer that correlate strongly with the consensus dimensions. It should be stressed that all these processes are the result of mathematical calculation procedures that in no way depend on interpretation by the researchers.
Statistical analyses
For Study 1, because the 10 habituated clips were scored twice by the same observer group (each observer using their set of descriptive terms for both sessions) a single GPA could be carried out. Consequently, scores for the two quantification sessions could be compared directly. The rankings of QBA scores on each dimension were compared between the two quantification sessions by Spearman Rank Order Correlations (r s ) since the GPA dimension 2 values were bimodal and could not be transformed to meet requirements of parametric analyses. QBA scores for the two quantification sessions (the 10 habituated clips only) were analysed using Wilcoxon Matched Pairs test (Z n ). To evaluate the size of the observed treatment effects, we calculated the sum of squares (i.e. variability) for each treatment expressed as a percentage of the total sum of squares, which encompasses all variation in the QBA scores.
For Study 2, the two observer groups each had a different set of verbal instructions, and since the essence of this study was to determine whether this different verbal background influenced how they used their descriptive terms, a GPA was carried out for each observer group separately. The sheep’s scores on the main consensus dimensions for each observer group were compared by Spearman Rank Order Correlations, since GPA dimension 1 was not normally distributed and could not be transformed adequately for parametric analyses. These dimension scores were compared with the presence/absence of key behaviours using non-parametric one-way ANOVA (Mann–Whitney U-test). The effect of BCS treatment on the sheep’s QBA scores was tested by Kruskal–Wallis ANOVA by Ranks (H 2,n ).
Statistical analyses were carried out using GenStat 10.2 (Genstat 2008, VSN International, Hemel Hempstead, Hertfordshire, UK), Statistica 9 (StatSoft-Inc., Tulsa, OK, USA) and Excel for Windows 2003 (Microsoft Inc., Redmond, WA, USA). Data are presented as means±1 standard deviation and a statistical level of α⩽0.05 is used throughout.
Results
Study 1: the structuring of video footage
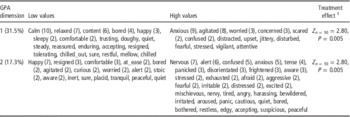
The 63 observers generated a total of 281 unique descriptive terms (average 21±7 terms per observer; range 9 to 43). The GPA consensus profile explained 53.03% of the variation among the 63 observers, and this differed significantly from the mean randomised profile (t 99=87.5, P<0.001). Two GPA dimensions explained 49% of the variation in scores attributed to individual animals (Table 1 for a list of terms associated with each GPA dimension).
Study 1: structuring of video footage. Summary of Qualitative Behavioural Assessment results

GPA=Generalised Procrustes Analysis.
Terms used by observers to describe behavioural expression of transport-habituated sheep where the same footage was viewed twice in separate quantification sessions.
The terms shown are those that had the highest correlation with each end of each GPA dimension axis (% of variation in behavioural expression accounted for by each dimension).
Term order is determined first by the number of observers to use each term (in brackets if greater than one), and second by weighting of each term (i.e. correlation with the GPA consensus dimension).
1 Treatment effect refers to differences in GPA scores for the same set of clips when viewed in two session juxtaposed with different footage (Wilcoxon Matched Pairs test).
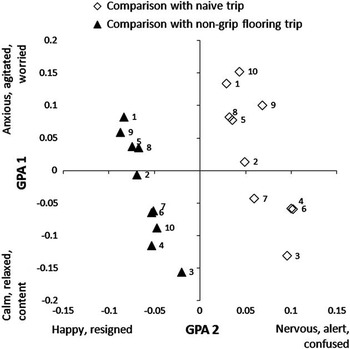
The rankings of QBA scores for the habituated clips were significantly correlated between the two quantification sessions on both GPA dimension 1 (r s =0.95, P<0.001) and GPA dimension 2 (r s =0.66, P=0.037). Observers attributed higher scores for terms such as anxious, agitated and worried (GPA dimension 1 Z n=10=2.80, P=0.005) and nervous, alert and confused (GPA dimension 2 Z n=10=2.80, P=0.005) when these clips were shown in juxtaposition with footage of the same sheep when they were naïve to transport, compared with when the same footage was shown in juxtaposition with the non-grip flooring footage (Figure 1).
Study 1: structuring of video footage. Observers shown the same footage of sheep habituated to transport rated these animals differently depending on the other footage that the clips were interspersed with. The numbers indicate the ID for each individual animal.

The percentage of the total sum of squares (i.e. variability) attributable to the treatment group for GPA dimension 1 was 9.5% and for GPA dimension 2 was 87.3%. This reflects that the treatment groups were only marginally different for GPA dimension 1 but showed non-overlapping and markedly different scores for GPA dimension 2 (Figure 1). The mean difference between treatment scores (GPA1: 0.0546; GPA2: 0.1226) was 17.7% of the distance between the lowest and the highest individual scores for GPA1 and 64.5% for GPA2.
Study 2: the provision of background information to observers
‘No explanation’
The 21 observers generated 147 unique descriptive terms (average of 19±6 terms per observer, range 9 to 31). The GPA consensus profile explained 53.5% of the variation among the observers, and this differed significantly from the mean randomised profile (t 99=38.15, P<0.001). Two main GPA dimensions were identified, explaining 49.5% and 8.4% (GPA dimension 1 and 2, respectively) of the variation between animals.
‘Explanation’
The 11 observers generated 58 unique descriptive terms (average of 11±4 terms per observer, range 7 to 15). The GPA consensus profile explained 54.0% of the variation among the 11 observers, and this differed significantly from the mean randomised profile (t 99=23.30, P<0.001). Two main GPA dimensions were identified, explaining 60.1% and 10.8% (GPA dimension 1 and 2, respectively) of the variation between animals.
Comparison between observer groups
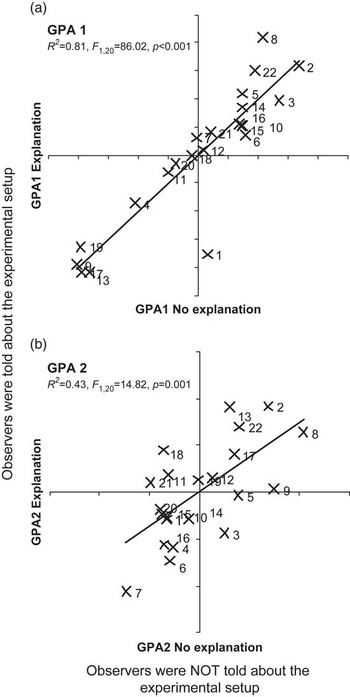
There was a significant correlation between the scores attributed to individual sheep by the two separate observer groups on their respective GPA dimensions 1 (r s =0.92, P<0.001) and GPA dimensions 2 (r s =0.52, P=0.013). GPA dimensions 1 and 2 were therefore relatively consistent between trials, whether or not observers were specifically informed about the experimental setup.
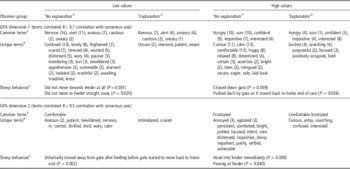
There were a large number of common terms generated by the two observer groups (Table 2). Ten terms were strongly correlated (r>ǀ0.7ǀ) with GPA dimension 1 axes for both observer groups: nervous, alert, anxious, cautious and uneasy on the low end of the axis and hungry, sure, confident, inquisitive and interested on the high end of the axis. All terms were used in the same way, for example sheep that were described as more nervous by the ‘no explanation’ observer group were scored similarly by the ‘explanation’ observer group. This common use of terms would have contributed to the significant correlation between the observer groups’ scores on GPA dimension 1 (Figure 2). These behavioural descriptions were also consistent with the presence of key physical behaviours: sheep that we rated as closely following the gate towards the feeder, or having to be ‘pushed’ back to their starting point by the moving gate, also received higher scores on GPA dimension 1 (i.e. described as more hungry, etc.). Animals that did not move immediately to the feeder (or did not move at all) scored lower on this dimension (see Table 2 for statistics).
Study 2: provision of background information to observers. Correlations between Generalised Procrustes Analysis (GPA) dimension scores calculated for two observer groups who were either given no explanation regarding the behavioural demand experimental setup or were told about the facility. The numbers indicate the ID for each individual animal.

Study 2: provision of background information to observers. Summary of Qualitative Behavioural Assessment results

GPA=Generalised Procrustes Analysis.
Lists of terms associated with low and high values of each of the GPA dimension for analyses where 21 observers were not told about the experimental setup (no explanation) or 11 observers were told (explanation).
1 21 observers were not told about the experimental setup (no explanation).
2 11 observers were told (explanation).
3 Terms common to both observer groups.
4 Terms unique to each observer group (terms are ordered firstly by the number of observers to use each term – numbers in bracket – and then second by decreasing correlation with the consensus dimension).
5 Each clip was scored for the presence of key sheep behaviour; significant results (Mann–Whitney U-test) comparing the GPA dimension scores with the presence/absence of each behaviour are indicated (Sheep behaviour).
There were also descriptive terms correlated with GPA dimension 1 that were unique to each observer group (Table 2). Observers who had the experimental setup explained to them described sheep given a high score for this dimension as more excited, searching and focused, or as unsure, reserved and patient on the low side of the axis. By contrast, the ‘no explanation’ observer group attributed terms such as curious, calm and comfortable to these same sheep, or confused, lonely and frightened for the low side of the axis.
Only two descriptive terms that were strongly correlated with GPA dimension 2 were used by both observer groups. Frustrated and comfortable were each used by one observer in each group. Frustrated was used consistently, but comfortable was not (see Table 2). Sheep that were more likely to put their head into the feeder immediately or pawed at the feeder had significantly higher values for GPA dimension 2 (i.e. were described as more frustrated by both observer groups), whereas those that voluntarily moved away from the feeder before the gate started to move scored lower on this dimension (see Table 2 for statistics).
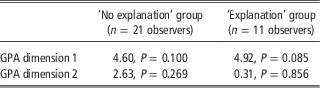
For neither observer group was there a significant effect of BCS treatment on the mean scores attributed to individual sheep on the main GPA dimensions, although there was a tendency in both groups towards a significant effect on dimension 1, indicating that sheep with a high BCS (BCS 4) were perceived as more nervous, alert, anxious, cautious and uneasy than skinnier sheep with lower BCS (hungry, sure, confident, inquisitive; Table 3).
Study 1: structuring of video footage. Summary of Kruskal–Wallis ANOVA by Ranks (H2, n=22) results testing whether there were body condition score (treatment) effects on the average GPA scores attributed to each sheep
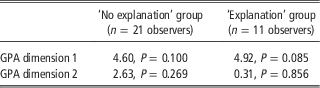
GPA=Generalised Procrustes Analysis.
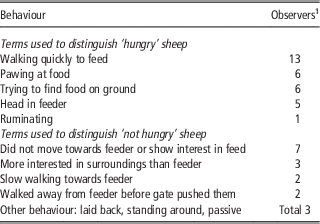
Both groups included observers with a range of experience with sheep. Three observers in each group responded that they had worked with sheep for a year or more (14% of the ‘no explanation’ group and 27% of the ‘explanation’ group), whereas 67% and 27% (in each group, respectively) had worked with sheep for a few days or less. Surveys of the observers after the quantification session revealed that all observers thought that they could tell when sheep were hungry. The behaviour that respondents identified with ‘hungry’ sheep included walking quickly to the feeder (see Table 4 for more terms). A similar proportion of the ‘no explanation’ (61%) and ‘explanation’ (64%) observer groups also thought that they could tell when sheep were ‘not hungry’. The behaviour used to describe ‘not hungry’ sheep included animals being more interested in their surroundings than the feeder, slow pace to approach the feeder or the sheep voluntarily moving away from the feeder before being pushed by the gate (Table 4).
Study 2: provision of background information to observers. Summary of post-analysis survey of observers asked whether they could tell when sheep were hungry
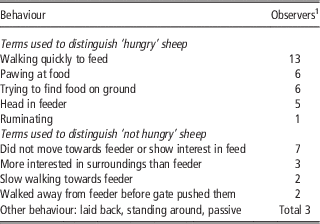
All respondents (n=18 ‘no explanation’ and n=11 ‘explanation’ observer groups) indicated that they could tell when a sheep was hungry. Around two-thirds of observers (n=11 ‘no explanation’ and n=7 ‘explanation’ observer groups) believed they could distinguish when sheep were ‘not hungry’.
1 Number of observers using each term.
Discussion
The results of the two QBA studies reported in this paper indicate that variations in the structuring of video footage shown to observers, and in the background information given to them, did not affect the relative rankings of animals on main expressive dimensions (i.e. the pattern of interpretation), but did sensitise observers to certain aspects of the observed sheep’s expressions. They adjusted the descriptive terms they generated, and/or how they quantified these terms. Such sensitivity to experimental design and verbal instruction can play a constructive role in scientific studies, focusing observers’ attention on key aspects of animal expression, sharpening their ability to discriminate expressive cues and improving the relevance of their scores in light of a study’s aims (Aviezer et al., Reference Aviezer, Hassin, Ryan, Grady, Susskind, Anderson, Moscovitch and Bentin2008; Barrett et al., Reference Barrett, Mesquita and Gendron2011). However, this sensitivity can also potentially be a source of undesirable variability and bias (Saks et al., Reference Saks, Risinger, Rosenthal and Thompson2003) and therefore understanding this aspect of qualitative measures will help with their appropriate application. These findings will be discussed in more detail below.
In Study 1, when the 10 focal sheep clips were mixed with footage of the same animals when these were still naïve to transport, observers rated the sheep as more anxious, agitated and worried (dimension 1), and more nervous, alert and confused (dimension 2), than when these clips were mixed with footage of the sheep when, more transport-experienced, they were exposed to non-grip flooring. Thus, seeing anxious sheep in the same viewing session made observers more sensitive to the nervous aspects of sheep demeanour, and increased their scores on these terms, shifting the position of sheep towards the negative end of expressive dimensions. However, the relative position of sheep to each other on these dimensions (i.e. the overall scoring pattern), was not significantly affected, and so the overall characterisation of animals was stable.
In Study 2, two separate observer groups were given different verbal background information with respect to the experimental setup in which 22 individual sheep were viewed. As a consequence, the two observer groups, although using many terms in common to describe the sheep, also generated some unique terms, suggesting some differences in their perception of the footage viewed. For observers who were told sheep were approaching a feeder to be rewarded with food, unique terms for dimension 1 were, for example, excited/searching/focused v. unsure/reserved/patient, whereas observers who were not told this used terms such as curious/calm/comfortable v. confused/frightened/scared, indicating that the ‘informed’ observer group perceived the sheep’s expressions as more directed and focused in relation to the feeder. In the human literature, such an effect has been described as an anchoring effect, where decisions that people make are influenced by an initial piece of information (Tversky and Kahneman, Reference Tversky and Kahneman1974). The differences between the two observer group are not incompatible, but indicate slight differences in perceptive focus, causing the ‘informed’ group to use terms that were more closely aligned with hunger in sheep and closer to discerning a significant (but blind) BCS treatment effect than the ‘non-informed’ group (Table 3). As was the case in Study 1, the rankings on the two consensus dimensions attributed to sheep by the two observer groups were significantly correlated, indicating that variation in background did not substantially affect observers’ characterisations of animals relative to each other; that is, the overall pattern of interpretation.
The finding that different structurings of video footage in Study 1 led observers to attribute different levels of anxiety and confusion to the same sheep may cause concern for the reliability of QBA quantifications of emotional states. Similar effects have been found in human research (e.g. ratings of facial expressions, Hsu and Yang, Reference Hsu and Yang2013; Marian and Shimamura, Reference Marian and Shimamura2013), and are generally referred to as ‘contrast effects’ (Plous, Reference Plous1993; Saks et al., Reference Saks, Risinger, Rosenthal and Thompson2003; Page et al., Reference Page, Taylor and Blenkin2012). Recent reviews of this literature argue that such effects are not an obstacle to the judgement of discrete emotional states so much as an intrinsic feature of the fluid, dynamic nature of emotion perception (Aviezer et al., Reference Aviezer, Hassin, Ryan, Grady, Susskind, Anderson, Moscovitch and Bentin2008; Barrett et al., Reference Barrett, Mesquita and Gendron2011). A key factor to consider in this light is that the VAS scales used for QBA assessment (and for other health and welfare indicators, e.g. gait score) are not anchored by absolute, additive, numerical values. Scores generated by observers on these scales are integrative and comparative in nature, and their analysis through multivariate techniques such as GPA or PCA is a mechanism for detecting patterns of variation within a given sample, the numerical distribution of which depends entirely on the scope of the material presented to observers or included in the statistical analyses. For example, QBA may be used to assess animal expressions over a range of intensive housing conditions, but adding footage from a different system (e.g. extensive housing) will introduce different contrasts, and is likely to alter the computation of QBA dimensions and the relative position of participating farms on these dimensions (see also Andreasen et al., Reference Andreasen, Wemelsfelder, Sandøe and Forkman2013). Thus, the numerical values attributed to samples in a particular analysis have no independent, absolute meaning, unless the sample is extremely large and/or representative of the entire population. The implication is that the different scoring levels found in Study 1 for the same sheep should not necessarily be understood as an irrelevant measurement inconsistency, but rather as providing pertinent information on the dynamic interplay between emotion perception and context (Aviezer et al., Reference Aviezer, Hassin, Ryan, Grady, Susskind, Anderson, Moscovitch and Bentin2008). If the goal is to compare groups of animals or farms as part of one common frame, then they should be included in the same statistical analysis. Only if samples in different studies are identical or highly similar (as in Study 2), can the scores calculated in separate analyses be directly compared (Wemelsfelder et al., Reference Wemelsfelder, Hunter, Paul and Lawrence2012).
The question is how the natural context sensitivity in emotion perception can be managed to limit potentially distortive effects on the integrity of scientific assessments. It should be clear that the occurrence of distortive bias is by no means limited to qualitative types of assessment. Research across the animal and human sciences increasingly demonstrates these effects to be widespread, affecting even (apparently) straightforward quantitative physical measurements (e.g. counting the number of head-turns in planarian worms, the number of positive and negative social interactions in pigs, or the number of blood cells in biomedical samples; Saks et al., Reference Saks, Risinger, Rosenthal and Thompson2003; Tuyttens et al., Reference Tuyttens, de Graaf, Heerkens, Jacobs, Nalon, Ott, Stadig, Van Laer and Ampe2014). These biasing effects can probably be eliminated only by permanently removing observers from practical reality (Barrett and Kensinger, Reference Barrett and Kensinger2010); however, they can be managed and limited, through appropriate instruction, training and experimental design.
The key to appropriate use of QBA is to make sure that comparisons of animals and the contexts in which these take place are representative, realistic and informative with regard to the questions asked. Tuyttens et al. (Reference Tuyttens, de Graaf, Heerkens, Jacobs, Nalon, Ott, Stadig, Van Laer and Ampe2014) made their comparison of observer groups with and without biasing information on the basis of one video clip only, which (as they themselves note) cannot be regarded as a properly designed QBA study. QBA studies must involve multiple clips, so that observers can identify differences relevant to the study, and calibrate their scores accordingly (Wemelsfelder et al., Reference Wemelsfelder, Hunter, Mendl and Lawrence2000 and Reference Wemelsfelder, Hunter, Mendl and Lawrence2001). In controlled experimental studies, observers should be blind to any treatments, and visual evidence of these treatments should be minimised. Care should also be taken that observers are not distracted by unusual factors irrelevant to the study; for example in a study of cattle filmed pre-slaughter in a forcing chute, it was explained to observers why the animals were wet (Stockman et al., Reference Stockman, McGilchrist, Collins, Barnes, Miller, Wickham, Greenwood, Cafe, Blache, Wemelsfelder and Fleming2012). Where such control is not possible, in field or on-farm conditions, continuous training, inter- and intra-observer reliability testing and cross-validation with other measures are crucial, as they are for all animal-based health and welfare indicators (Tuyttens et al., Reference Tuyttens, de Graaf, Heerkens, Jacobs, Nalon, Ott, Stadig, Van Laer and Ampe2014). The results of the current study indicate that comparative rankings of animal scores within a given QBA study remain stable under variations in context, but that the numerical values attributed to animals may vary, suggesting the need for careful instruction and training in the use of visual analogue scales.
Acknowledgements
The authors thank Guy Curtis for his comments and contribution. This research was supported by Meat & Livestock Australia and Meat and Wool New Zealand. All experimental procedures were reviewed and approved by the animal ethics committee at Murdoch University (Perth, Australia), Curtin University (Perth, Australia) and AgResearch (Hamilton, New Zealand).