Introduction
Assessing female fecundity is an important task in population and life history studies. Depending on the reproductive strategy of the species, addressing this issue may be more or less challenging. Reproductive strategies in insects range from capital breeding, where all resources for reproduction are accumulated by the larvae and no adult feeding occurs, to income breeding, where feeding by adults contributes significantly to egg production. In income breeding Lepidoptera, female fecundity depends mostly on female longevity (Tammaru & Haukioja, Reference Tammaru and Haukioja1996; Bauerfeind & Fischer, Reference Bauerfeind and Fischer2005a) and only to a lesser extent on female body size. In capital breeding Lepidoptera, however, female fecundity typically increases with increasing body size (Tammaru & Haukioja, Reference Tammaru and Haukioja1996; Tammaru et al., Reference Tammaru, Kaitaniemi and Ruohomäki1996a), which itself is in many species highly correlated with pupal mass (Tammaru et al., Reference Tammaru, Ruohomäki and Saikkonen1996b; Calvo & Molina, Reference Calvo and Molina2005). Thus, female pupal mass – being assessed more easily than fecundity itself – is often used as a proxy for fecundity in those species (Lill & Marquis, Reference Lill and Marquis2001; Klemola et al., Reference Klemola, Ruohomäki, Andersson and Neuvonen2004).
As a consequence, only factors that influence pupal mass, e.g. host plant quality (Awmack & Leather, Reference Awmack and Leather2002), temperature (Calvo & Molina, Reference Calvo and Molina2005), larval density (Ruohomäki et al., Reference Ruohomäki, Klemola, Kaitaniemi and Käär2003) or food shortage (Bauerfeind & Fischer, Reference Bauerfeind and Fischer2005b) are usually considered as sources of variation in female fecundity. Potential fecundity seems, then, to be easily calculated from the pupal mass using published formulae (e.g. Tammaru et al., Reference Tammaru, Kaitaniemi and Ruohomäki1996a). However, such formulae are typically derived from short-term studies in the laboratory and, thus, do not take into account any environmental factors that could modify the body weight-fecundity relationship under natural conditions. Such environmental factors may directly affect larvae during their development, but they could also have already been experienced by the parents of the larvae in question. These so-called maternal effects (Ginzburg & Taneyhill, Reference Ginzburg and Taneyhill1994), which despite their name also include non-genetic features transmitted via the father, may act as a mechanism for adaptive phenotypic response to environmental heterogeneity.
Although some studies report varying female pupal masses and fecundities in long-term field studies of insect populations (Klomp, Reference Klomp1966; Broekhuizen et al., Reference Broekhuizen, Hassell and Evans1994), none of them has analyzed individual body weight-fecundity correlations over longer time periods. Thus, the present study is the first one addressing this issue in a long-term field study. Using a seven-year data set on a capital breeder, the autumnal moth (Epirrita autumnata (Borkhausen), Lepidoptera: Geometridae), the aim of the present study was to analyze whether the body weight-fecundity relationship in this cyclic forest lepidopteran is constant across years. Ambient temperature conditions and density of conspecifics during larval development, the length of the pupal period, as well as moth densities in the parent generation were examined as factors capable of modifying the body weight-fecundity relationship. Multiple regression analyses were performed to analyze whether any of those variables could be used to explain a significant part of the variance in egg numbers per female after having controlled for the effect of body weight (measured as pupal mass). Furthermore, we analyzed whether any of the studied environmental variables also had an influence on pupal mass itself to retest results of previous studies.
Material and methods
Study species
The autumnal moth is a holarctic species with a univoltine life cycle (Haukioja et al., Reference Haukioja, Neuvonen, Hanhimäki, Niemelä and Berryman1988). The eggs overwinter and hatch at host plant budburst. The polyphagous larvae feed on foliage during the five larval instars and pupate in the soil by mid-summer. Adult eclosion occurs in early autumn and individuals live up to two weeks. Adults do not have to feed for maintenance or reproduction (Tammaru & Haukioja, Reference Tammaru and Haukioja1996), and females lay their eggs mainly on trunks and branches within a few days after mating (Tammaru et al., Reference Tammaru, Ruohomäki and Saikkonen1996b).
In northern and mountainous parts of Fennoscandia, population densities of the autumnal moth fluctuate with high amplitudes. Along the Scandes mountains and in semi-continental areas, populations show outbreak densities at regular intervals of nine to ten years, while more continental populations often have irregular outbreaks (Tenow et al., Reference Tenow, Nilssen, Bylund and Hogstad2007). Because of its numerical dominance in the subarctic, the mountain birch, Betula pubescens ssp. czerepanovii (Orlova) Hämet-Ahti (Fagales: Betulaceae), is the main host plant of the autumnal moth in northern Fennoscandia. Vast areas of the mountain birch zone can be severely damaged, or even killed, during moth outbreaks (Tenow, Reference Tenow1972). Southern Fennoscandian populations remain generally at low and relatively stable densities (Klemola et al., Reference Klemola, Huitu and Ruohomäki2006).
Study areas
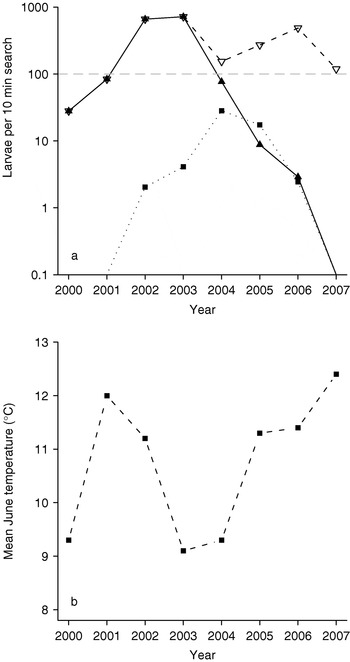
The study was carried out at the Kevo Subarctic Research Station (69° 45′ N, 27° 01′ E; 80 m a.s.l.) in northernmost Finland. Continental climate with harsh winters prevails in the Kevo area, and outbreak possibilities of the autumnal moth are limited by winter minimum temperatures often being below the threshold (ca.−36°C) for egg survival (Tenow & Nilssen, Reference Tenow and Nilssen1990). For years, Kevo had very low autumnal moth densities until a moderate increase was observed in 2002 (Klemola et al., Reference Klemola, Ruohomäki, Andersson and Neuvonen2004), reaching a peak density of about 30 larvae per 10 min search in 2004, which is still far below the highest outbreak densities (fig. 1a and Klemola et al., Reference Klemola, Klemola, Andersson and Ruohomäki2007). In 2007, larval densities were again very low (fig. 1a).
(a) Population densities and (b) mean June temperature during the years 2000–2007. Population densities of autumnal moths in Kevo (where the study was performed) and Hana (from where the parent generations were obtained), as well as of both autumnal and winter moths (pooled geometrids) in Hana are presented. (…■…, Kevo autumnal moth; –▲–, Hana autumnal moth; –▿–, Hana geometrids pooled). The horizontal dashed line shows the approximated larval abundance required for visible defoliation of mountain birches (Klemola et al., Reference Klemola, Klemola, Andersson and Ruohomäki2007). Please note the logarithmic y-axis. Mean June temperature data were obtained from the Kevo Meteorological Station located on the grounds of the Kevo Subarctic Research Station.

In each study year, the parent generation of moth eggs used for the study was collected from a different site, Hana (70° 14′ N, 28° 27′ E; 230 m a.s.l.), northern Norway, located 80 km NE from Kevo (Klemola et al., Reference Klemola, Ruohomäki, Andersson and Neuvonen2004, Reference Klemola, Andersson and Ruohomäki2008). This was due to several reasons. When this study was planned in 1999, a forthcoming outbreak could already be anticipated in Hana (cf. fig. 1 in Klemola et al., Reference Klemola, Ruohomäki, Andersson and Neuvonen2004), while there was practically zero moth density in Kevo until 2002 (fig. 1a). Thus, the study was conducted in Kevo because the forthcoming outbreak densities in Hana were assumed to lead to complete defoliation of mountain birches, which indeed then happened in 2003 and 2004 by autumnal moths, and later by winter moths. With complete defoliation, the current study would have failed in Hana because of the lack of foliage for the larvae. Furthermore, the study design required visits to the trees once a day (to check the pupating larvae), which would not have been feasible due to the remote location of Hana in relation to our field station.
Larval rearing on trees
Larvae were reared from egg to pupa in groups of up to 20 individuals (see below for details) in mesh bags on mountain birch branches (one mesh bag per tree). Fifteen mature (height 3–5 m) mountain birches were selected at Kevo in spring 2001. Branch-wide mesh bags (80×35 cm, mesh 0.4 mm) prevented larval dispersal outwards, as well as predation and parasitism on larvae inside the bags. Due to a parallel study investigating the occurrence of a delayed inducible resistance by comparing the performance of larvae grown in previously bagged trees (these trees had a branch-wide damage caused by bagged larvae of previous summer(s)) or control trees, eight of the trees were used permanently throughout the study but seven new, previously unused trees were selected in each later year. Therefore, trees could not be selected randomly (as no control tree could be used twice). Instead, trees were chosen to be as similar as possible and to have enough branches so that the mesh bag could be put to a different branch each year in the repeatedly used trees. As this parallel study did not show any consistent effects of previous defoliation on larval growth (Klemola et al., Reference Klemola, Ruohomäki, Andersson and Neuvonen2004 and unpublished data), data from all 15 trees per year were used in the present study; however, ‘defoliation in the preceding year (yes/no)’ was included as a random effect in all statistical analyses (see below).
Autumnal moth females were mated with males (both collected haphazardly in Hana as late larvae in mid-summer) in vials of 100 ml and allowed to oviposit on short pieces of twigs. In each year, eggs from 20 different broods were used and one egg of each brood was allocated to each of the 15 bags. Thus, per study tree, 20 of those twig pieces – holding one egg each – were attached to one branch, enclosing 100–200 short shoots with usually three leaves per shoot. Consequently, the egg composition in each bag was identical within each year. The branches were bagged in early spring well before budburst and natural egg hatch. Consequently, hatching of bagged larvae was well synchronized with wild larvae in the area.
The larvae developed inside the mesh bags until they ceased feeding. Larvae preparing to pupate are easily recognized by their gathering at the bottom of the bag and reduced body length. These ‘shortening’ larvae were collected once a day and immediately brought to the laboratory where they were allowed to pupate singly in vials (48 ml) containing moist Sphagnum moss. A fortnight after the larva had stopped feeding, pupal mass was weighed to the nearest 0.1 mg (Mettler-Toledo AB204-S; Giessen/Germany), and sex was visually identified based on the location and shape of the genital orifice (Scoble, Reference Scoble1992) using a stereomicroscope (Wild/Leica M3Z; Hildesheim/Germany).
Fecundity
All pupae were kept outdoors in individual vials (apart from very warm days when they were shifted indoors to a climatic chamber (+14°C)), protected from direct sunlight and checked daily for eclosing adults from the end of July onwards. Newly eclosed females were randomly mated with one male eclosed on the same day. The male either belonged to the same or to another experimental population, depending on availability of newly eclosed individuals. Pairs were kept outdoors in large vials (100 ml) and females were given the opportunity to oviposit onto a piece of plastic mesh (ca. 50×25 mm, mesh 1.5 mm) provided within the vials. As autumnal moth females are rather indiscriminative towards oviposition substrates (Tammaru et al., Reference Tammaru, Kaitaniemi and Ruohomäki1995), the mesh pieces (which facilitated egg counting) were readily accepted for oviposition. The numbers of oviposited eggs, as well as of all eggs remaining inside the female after its death, were counted by the same researcher (T.A.) each year. Females were dissected and examined using a stereomicroscope (Wild/Leica M3Z; Hildesheim/Germany). The total egg number per female was considered to be its potential fecundity. In addition, the number of fertilized eggs that were eventually oviposited was recorded. This quantity could be used as an approximation of realized fecundity (but see Discussion). Based on their colour, eggs were easily identified as being fertilized (red-orange) or unfertilized (green) (Nilssen & Tenow, Reference Nilssen and Tenow1990). Females that had no or only unfertilized eggs were omitted from analyses.
Environmental factors
Temperature conditions during larval development were described by mean June temperature and cumulative temperature sum (=thermal sum) to pupation. Mean June temperature (fig. 1b) was used because the eggs hatched during the two last weeks of May and the majority of larvae pupated in the last week of June (data not shown in detail). The thermal sum until pupation is an approximation of the physiological time available for development, also known as growing degree-days (McMaster & Wilhelm, Reference McMaster and Wilhelm1997). It is calculated by summing up the mean daily temperatures during development (in this case during larval development) that exceed the species-specific developmental threshold temperature (+2°C: Virtanen & Neuvonen, Reference Virtanen and Neuvonen1999; Ruohomäki et al., Reference Ruohomäki, Klemola, Kaitaniemi and Käär2003). All temperature data were obtained from the Kevo Meteorological Station (temperatures are measured every third hour), which is located on the grounds of the Kevo Subarctic Research Station.
Density of conspecifics during larval development was considered both on a ‘local’ (within rearing bags) and a ‘regional’ (in the Kevo area) scale. Local density may directly affect larval development via exploitation and interference competition between individuals but also via a rapid induced resistance response of the host tree (Haukioja, Reference Haukioja, Tuzun and Bent2006). This response may, however, also be induced systemically by regional larval density, similar to the previously shown systemic response within trees, i.e. leaf quality alters in intact leaves close to damaged leaves as well as in the whole tree (Haukioja, Reference Haukioja, Tuzun and Bent2006). Due to variation in egg hatch success and larval survival, not all mesh bags held the same number of larvae throughout the study period. Thus, the number of shortening larvae per bag was used as a measure of ‘local’ autumnal moth density, because most mortality usually occurs before egg hatch or during the first two larval instars. ‘Regional’ larval density of the autumnal moth was estimated by visually searching for larvae (Ruohomäki, Reference Ruohomäki1992; Kaitaniemi et al., Reference Kaitaniemi, Ruohomäki, Tammaru and Haukioja1999) in the mountain birch forest surrounding the Kevo Station. Mountain birch leaves were observed by the same person (K.R.) at the same phenological stage each year, when the majority of larvae had moulted to the fourth instar. No individual birch tree was observed for more than 30 s. Search time was increased with decreasing larval density until either approximately 15 larvae had been found or a period of one hour had elapsed. An index of relative larval density (number of third/fourth instar larvae in mountain birches per 10 min search) was calculated based on the original count data. The same estimation method was also used for assessing population densities of autumnal moths in the parent generation in Hana. As a recent study on the influence of population density on the body size of autumnal moths showed the importance of not only autumnal moth densities but of the pooled geometrid density of autumnal and winter moths (Klemola et al., Reference Klemola, Andersson and Ruohomäki2008), both density variables were used in the present study. Densities of winter moths, which were estimated with a different method (by counting the number of moth larvae on one random branch (50–100 cm long with about 100 short shoots) of ten random mountain birches), had to be transformed to the unit of ‘larvae per 10 min search’. A detailed description of this transformation process can be found in Klemola et al. (Reference Klemola, Andersson and Ruohomäki2008).
Statistical analyses
Data were analyzed with (multiple) linear mixed-effects models (Pinheiro & Bates, Reference Pinheiro and Bates2000) using the lme function in the nlme package (Pinheiro et al., Reference Pinheiro, Bates, DebRoy and Sarkar2007) of the statistics software R 2.6.0 (R Development Core Team, 2007). As larvae reared together in a mesh bag on the same tree were non-independent replicates, ‘tree’ was used as a random effect in all models. Furthermore, ‘defoliation treatment’ (whether a tree was a previously bagged or a new tree) was a random factor in all models. As already mentioned above, this was done because the treatment effect was not significant (Klemola et al., Reference Klemola, Ruohomäki, Andersson and Neuvonen2004 and unpublished data). Thus, the ‘defoliation treatment’ actually reflects random tree groups. Finally, ‘year’ was included as the highest order random effect (except in the basic models that test for yearly differences in egg numbers, in which year was used as a fixed factor). The hierarchy of random factors was: ‘tree’ nested in ‘defoliation treatment’ nested in ‘year’.
In order to analyze whether a significant proportion of variance in egg numbers could be explained by environmental factors after having controlled for the effect of pupal mass, sequential type I sums of squares were used in all F-tests, and environmental factors were always included in the multiple linear mixed-effects models after pupal mass. Parameter estimates were obtained using the restricted maximum log-likelihood (REML) method and are always given accompanied by their 95% confidence limits. However, as likelihood comparisons are not meaningful for models with different fixed effects that were fitted using REML, maximum log-likelihood (ML) fits were used for model comparison purposes. Akaike's Information Criterion corrected for small sample size (AICc) as well as Akaike's weight (w) were used as model selection criteria (Burnham & Anderson, Reference Burnham and Anderson2002).
Potential influences of the studied environmental variables on the fraction of fertilized and/or oviposited eggs were analyzed using linear mixed-effects models with arcsine square-root transformed proportion data.
Results
Body weight-fecundity relationship
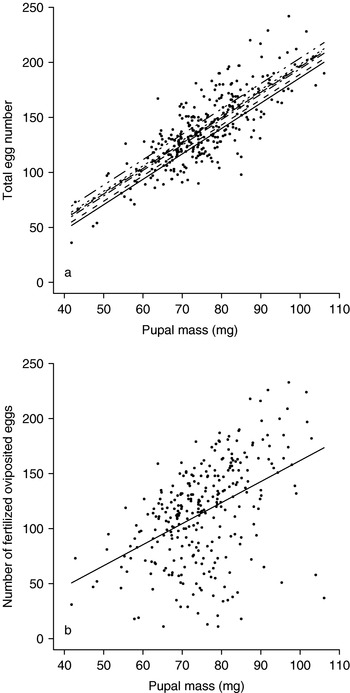
The relationship between potential fecundity and body weight in the autumnal moth, more explicitly, the regression of total egg number per female on pupal mass, resulted in significantly different intercepts in different years (−33.83±19.71 (2001), −32.54±9.89 (2002), −41.61±10.87 (2003), −44.79±11.40 (2004), −26.96±10.39 (2005), −36.66±9.10 (2006), −34.96±11.54 (2007); year: F 6,86=2.54, P=0.026; fig. 2a). The maximum difference in the average total egg number at a given pupal mass was 18 eggs. Thus, a 13% increase in potential fecundity from the ‘worst’ year (2004) to the ‘best’ year (2005) was observed. There was no significant interaction between pupal mass and year (pupal mass×year: F 6,195=0.12, P=0.995); therefore, the regression slope was the same in all years (pupal mass: b=2.31±0.22, F 1,201=474.06, P<0.0001; fig. 2a).
Body size-fecundity relationship in the autumnal moth, Epirrita autumnata. (a) Potential fecundity (total egg number) regressed on pupal mass and year. (b) ‘Realized’ fecundity (number of fertilized eggs that were oviposited) regressed on pupal mass. n=296 females from seven different years in both plots. Regression lines result from linear mixed-effects models. Regarding the potential fecundity (a), the regression lines share the same slope but have significantly different intercepts in different years. (. –., 2001; - - - -, 2002; – –, 2003; ——, 2004; - - —, 2005; - — -, 2006; — –, 2007). In contrast, the intercepts were not significantly different between years concerning the ‘realized’ fecundity (b) The results of the statistical analyses are given in the text.

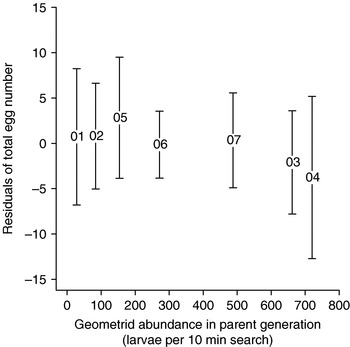
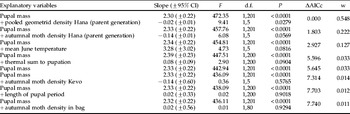
Out of all environmental factors analyzed here, the pooled geometrid density in the parent generation was the only variable that explained a significant part of the variation in total egg numbers after the effect of pupal mass had been controlled (table 1). Potential fecundity decreased with increasing pooled geometrid density. There was no significant interaction between pupal mass and pooled geometrid density in the parent generation (F 1,200=0.52, P=0.470). Although this was no residual analysis but a multiple regression, the residuals of a regression model containing only pupal mass as explanatory variable were plotted against the pooled geometrid density of the parent generation to give an impression of their interrelationship (fig. 3).
Relationship between potential fecundity in the autumnal moth, Epirrita autumnata, and the pooled geometrid density experienced by the parent generation after having corrected for the influence of pupal mass on egg numbers. Residuals (mean±95% CI) of a linear mixed-effects model in which total egg numbers (n=296 females) were regressed on pupal mass are plotted against the pooled geometrid density of the parent generation. Numbers given at the place of the mean value represent the year in which the offspring generation was sampled. No regression line is plotted, as the effect of pooled geometrid density was estimated from the original data in a multiple regression (table 1) and not based on the residuals. Those are shown for illustration purpose only.

Linear mixed-effects models explaining variation in potential fecundity (total egg numbers per female) in the autumnal moth. Explanatory variables as well as estimated parameters of the statistical models are given. Type I sums of squares are used for all F-tests. Model selection criteria, ΔAICc=difference between AICc of a model and AICcmin as well as Akaike's weight, w (describing the discrete probability of each model in the set) are shown. Interaction terms were NS in all models. Furthermore, the inclusion of more than one additional explanatory variable into the base model (containing only pupal mass) could not explain more variation than the best model in this set. Thus, those models are not included in the table for clarity's sake.

Both the fractions of oviposited eggs (fertilized and unfertilized) and of fertilized oviposited eggs among the total egg number were very high across all years (% oviposited eggs: 86.9±0.02; % fertilized oviposited eggs: 82.2±0.03). Only a very small fraction of fertilized eggs was not oviposited (0.0018±0.0007%). None of the studied explanatory variables had a significant effect on the fractions of eggs that were fertilized and/or oviposited or on the fraction of fertilized eggs that was not oviposited.
The variation in the number of fertilized oviposited eggs per given body weight was much larger than the variation in total egg numbers (fig. 2b). However, neither year nor pooled geometrid density (as in the case of potential fecundity) could be used to explain a significant part of this variation (year: F 6,86=1.29, P=0.272; pooled geometrid density: b=−0.02±0.02, F 1,5=5.20, P=0.072). The same holds for all other studied environmental variables. The common regression equation of the number of fertilized oviposited eggs explained by pupal mass is therefore: y=−29.20 (±33.10)+1.91 (±0.43)x (fig. 2b).
Factors affecting pupal mass
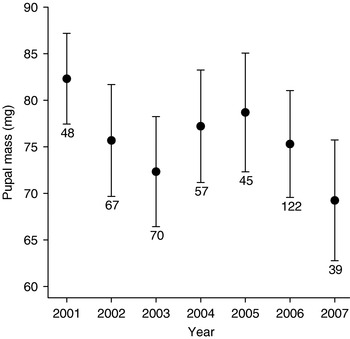
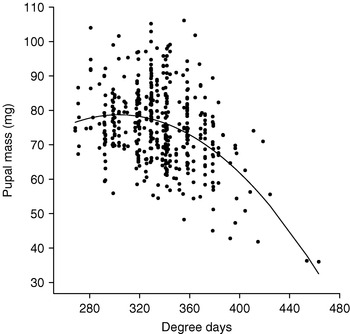
The pupal mass of autumnal moth females changed significantly over the seven years of the study (F 6,94=3.57, P=0.003; fig. 4). Out of all studied environmental factors, pupal mass was significantly affected by the thermal sum to pupation and by local autumnal moth density. While pupal size decreased linearly with local moth density (b=−0.40±0.36, F 1,88=4.87, P=0.030), there was a highly significant non-linear relationship between pupal mass and thermal sum to pupation (y=−87.52 (±66.70)+1.10 (±0.38)x−0.002 (±0.0006)x2; linear term: F 1,344=90.60, P<0.0001; quadratic term: F 1,344=41.69, P<0.0001; fig. 5), suggesting the existence of an optimal time-frame for pupation.
Pupal mass (mean±95% CI) of autumnal moth (Epirrita autumnata) females in the years 2001–2007. Sample sizes are given below the error bars. Pupal masses were significantly different between years. The results of the statistical analysis are given in the text.

Pupal mass of autumnal moth (Epirrita autumnata) females depending on the thermal sum to pupation (n=448 females from seven different years). The regression curve results from a linear mixed-effects model including a quadratic term. The results of the statistical analysis are given in the text.

Discussion
Various environmental factors are described in the literature as being capable of influencing the reproductive output of insect females irrespective of their body size. Nevertheless, female body size or pupal mass are widely used as proxies for female fecundity, for instance in studies on insect population dynamics and insect behaviour with ‘fitness’ as the focal variable (Lill & Marquis, Reference Lill and Marquis2001; Klemola et al., Reference Klemola, Ruohomäki, Andersson and Neuvonen2004). In the present field study, the female pupal mass-fecundity relationship was found to change across years most likely via maternal effects. Females produced less eggs per given body weight when their parents had experienced high densities of geometrid larvae (pooled density of autumnal and winter moths) during their development. Furthermore, the ambient temperature during development showed a positive (but statistically non-significant) correlation with egg numbers. Although these results are based upon observational data and not on experiments, they imply that measuring female body weight does not always give a sufficiently comprehensive estimate of female fecundity.
Population density experienced during larval development has been described to influence fecundity in many insect species (Prout & McChesney, Reference Prout and McChesney1985; Klemola et al., Reference Klemola, Andersson and Ruohomäki2008). However, the majority of studies on this issue either report on effects of rearing density on indirect fitness measures (e.g. body size/weight) (Ruohomäki, Reference Ruohomäki1992; Kaitaniemi et al., Reference Kaitaniemi, Ruohomäki, Tammaru and Haukioja1999), or they studied direct fitness measures (e.g. egg numbers) without correcting for the effects of body size/weight (Prout & McChesney, Reference Prout and McChesney1985). In the autumnal moth, density experienced during larval development has previously been shown to affect fecundity indirectly by reducing female body size/weight (Ruohomäki, Reference Ruohomäki1992; Klemola et al., Reference Klemola, Andersson and Ruohomäki2008). This relationship was also corroborated in the present study. The most likely explanation for this effect is the so-called rapid induced resistance of the mountain birch trees (Haukioja, Reference Haukioja, Tuzun and Bent2006; Klemola et al., Reference Klemola, Andersson and Ruohomäki2008). Based on this hypothesis, even rather low densities of autumnal moth larvae feeding on mountain birch trees can reduce the food quality within the time span of the larvae's own development (Kaitaniemi & Ruohomäki, Reference Kaitaniemi and Ruohomäki2001). An effect of the own rearing density on egg numbers after controlling for pupal mass could neither be found in the present nor in any previous study on autumnal moths.
Now, the present study shows a significant maternal effect of geometrid density in the parent generation on offspring egg numbers. Comparable to the results of Klemola et al. (Reference Klemola, Andersson and Ruohomäki2008), the pooled density of both autumnal and winter moths (which occur contemporaneously on the same host trees) explained changes in fecundity better than the density of autumnal moths alone. However, the effect size of the observed maternal effect was rather small. In fact, only parental moth densities far above the outbreak threshold seemed to be capable of affecting offspring fecundity directly (fig. 3) and fecundity was only reduced by 13%. As autumnal moths show also cyclic dynamics without reaching outbreak densities (e.g. in Kevo in fig. 1a; see also Klemola et al. (Reference Klemola, Ruohomäki, Andersson and Neuvonen2004, Reference Klemola, Klemola, Andersson and Ruohomäki2007) for population dynamics at other sites), maternal effects – at least those described here – do not seem to be capable of causing population cycles in this species. Nevertheless, they surely contribute to the characteristics of the cycle in outbreaking populations. Furthermore, there was no significant correlation between pooled geometrid density in the parent generation and offspring larval survival within bags (ρS=0.01, P=0.814). Thus, a maternal density effect on larval mortality (which contributes most to total mortality in the autumnal moth life cycle) seems to be unlikely. The existence of maternal effects in the autumnal moth has already been put forward by Alonso et al. (Reference Alonso, Ruohomäki, Riipi and Henriksson2001) in another context, but also in their experiment the effect size seemed to be rather small.
The question whether the suggested maternal effect in the autumnal moth is of an adaptive nature or not, specifically whether the eggs have a different quality or whether females simply lay less eggs, cannot be answered within the scope of the present study. Unfortunately, there are no data available on egg numbers of the mothers and on egg weights or chemical egg compositions for neither mothers nor daughters. These issues have to be addressed in future studies to challenge the conclusions of the present study.
The variation in the number of fertilized oviposited eggs per given body weight was much larger than for total egg numbers. As a consequence, realized fecundity, which is more relevant for population dynamics than potential fecundity, was less predictable from the pupal mass of a female than total egg numbers. However, in contrast to potential fecundity, none of the studied environmental factors could be used to explain a significant part of this variation. Therefore, realized fecundity per body weight does not appear to be different between years from a statistical point of view. On the one hand, this seems to contradict our implications about maternal density effects, and it implies that there are other, currently unidentified factors that influence the number of fertilized eggs that are eventually oviposited. On the other hand, there are reasons to doubt whether the number of fertilized oviposited eggs in our experiment reflects the realized fecundity of wild autumnal moths. First of all, population dynamics do not take place in 100 ml vials, where a female has to mate with a pre-selected male and where this male is constantly present during oviposition, potentially disturbing the female. Secondly, although females readily oviposit on the supplied plastic mesh, this artificial substrate may still affect oviposition. Thirdly, the males used for mating did not – due to practical reasons – all come from the same population as the females, which could cause some variation in the number of fertilized eggs. Finally, wild females ending up to e.g. light traps carry on average only few eggs (if any), implying that, without deaths by e.g. predation or extreme weather conditions, most females can indeed realize their potential fecundity (K.R., personal observation). The observed high variance in realized fecundity may thus be (partly) due to a lab artefact. Therefore and because the general pattern of variation in egg numbers depending on pupal mass was similar for both potential and realized fecundity (fig. 2a, b), total egg numbers seem to be the most reliable measure of female fecundity thus far.
In addition to maternal effects, the mean June temperature may influence potential fecundity in the autumnal moth. Although the model describing maternal effects is clearly the best model in the set, its evidence ratio compared to the model containing mean June temperature is only 4.3 and the latter model has still a probability of 12.7% (Akaike's weight). The observed maximum difference in egg numbers could be produced by a 5°C difference in mean June temperature, which falls well within the range of mean June temperatures in Kevo in the past 45 years (5.3–14.1°C). Several studies on other insect species have reported that the ambient temperature experienced during larval development can affect both egg size and egg numbers (reviewed in Fox & Czesak, Reference Fox and Czesak2000) in such a way that fewer but larger eggs are produced at cold than at warm rearing temperatures (Steigenga & Fischer, Reference Steigenga and Fischer2007). However, due to the observational nature of the data in the present study and the fact that mean June temperature and the pooled geometrid density in the parent generation were highly correlated (r=−0.77), it is hard to judge whether the almost significant effect of mean June temperature was only caused by the correlation between the two factors. This issue can only be settled with well-designed experiments.
In addition to the observed negative influence of rearing density on pupal mass, there was also an effect of the thermal sum to pupation on pupal mass. This relationship was non-linear: pupal mass first increased with increasing thermal sum but then decreased rapidly the later pupation took place. This may seem surprising at first, as a steady increase of pupal mass with development time is observed in many insect species (Stearns, Reference Stearns1992). However, each larval instar of the autumnal moth is adapted to a certain phenological stage of the mountain birch (Haukioja et al., Reference Haukioja, Ossipov and Lempa2002). Thus, the observed non-linear interrelationship between pupal mass and development time implies that there is an optimal time-frame for pupation and that pupal mass cannot be increased by a longer development time that expands beyond this optimal time-frame (Kause et al., Reference Kause, Saloniemi, Haukioja and Hanhimäki1999, Reference Kause, Saloniemi, Morin, Haukioja, Hanhimäki and Ruohomäki2001). As recently reviewed by van Asch & Visser (Reference van Asch and Visser2007), this type of relationship seems to be common in forest caterpillars.
In conclusion, the body size-fecundity relationship of the autumnal moth, Epirrita autumnata, shifted across years. The results of the present study imply that maternal effects are capable of influencing the body size-fecundity relationship in this capital breeding, cyclic forest lepidopteran. More precisely, increasing pooled geometrid densities in the parent generation decreased egg numbers in the offspring generation after the effect of pupal mass had been controlled. The rather weak nature of this effect suggests, however, that the maternal effects described in this study do not have the potential of causing cyclic population dynamics in the autumnal moth.
Acknowledgements
The authors are grateful to the Kevo Subarctic Research Institute for providing the research facilities, as well as to all field assistants that participated in this project. We, furthermore, thank Thomas Hovestadt for beneficial discussions on the manuscript. The study was financially supported by the Academy of Finland (project 48697 to K.R. and projects 111195 and 204190 to T.K.), the Turku University Foundation (grants to K.R. and T.K.) and the Emil Aaltonen Foundation (grant to T.K.).