
1. Introduction
The velocity gradient tensor provides an effective way to characterize the small-scale dynamics and kinematics of turbulent flows (Meneveau Reference Meneveau2011). By filtering (coarse graining) the velocity gradient on a length scale  $\ell$, one is able to analyse the properties of the velocity gradients at different scales in the flow by varying
 $\ell$ (Borue & Orszag Reference Borue and Orszag1998), providing insight into the multiscale dynamics of turbulence. The bare (un-filtered) velocity gradient provides insight into the local topology of the flow (Chong, Perry & Cantwell Reference Chong, Perry and Cantwell1990), and the structure of highly dissipative or vortical regions of the turbulence (Buaria et al. Reference Buaria, Pumir, Bodenschatz and Yeung2019), while the filtered gradient provides a way to characterize and understand the dynamics of the turbulent energy cascade (Carbone & Bragg Reference Carbone and Bragg2020). Some of the velocity gradient statistics are known to be qualitatively similar across the scales of the flow, i.e. for varying
 $\ell$. For example, the probability density function (PDF) of the second and third principal invariants of the velocity gradient has the well-known ‘tear-drop’ shape not only for the bare velocity gradients, but also for the filtered ones (Naso & Pumir Reference Naso and Pumir2005; Danish & Meneveau Reference Danish and Meneveau2018).
The dynamics of the velocity gradient can be analysed effectively from a Lagrangian perspective, i.e. following a fluid particle trajectory (Vieillefosse Reference Vieillefosse1984; Meneveau Reference Meneveau2011). However, the pressure Hessian and viscous stress are non-local and unclosed in this frame of reference, requiring in-depth modelling. This work aims to enhance the understanding of the statistical properties of the velocity gradient dynamics at different scales using data from direct numerical simulation (DNS) of the forced Navier–Stokes equations.
In Danish & Meneveau (Reference Danish and Meneveau2018), the statistics of the filtered velocity gradients have been investigated, with a focus on how probability fluxes in the phase space of the invariants of the filtered velocity gradients behave. In the present work, the multi-scale characterization of the velocity gradient is extended by analysing it in the strain-rate eigenframe, formed by the eigenvectors of the symmetric strain-rate tensor. In this frame, the effect of the incompressibility constraint, the local strain self-amplification/reduction and the centrifugal force due to rotation of the fluid element can be distinctly untangled. Also, it has been recently shown that the description of the velocity gradient dynamics in the strain-rate eigenframe also allows for a dimensionality reduction of the non-local pressure Hessian when the single-time properties of the velocity gradients are considered (Carbone, Iovieno & Bragg Reference Carbone, Iovieno and Bragg2020), allowing for simpler modelling of the pressure Hessian.
An analysis of the velocity gradients in the strain-rate eigenframe has been employed in previous works for an effective description of the velocity gradient dynamics (Vieillefosse Reference Vieillefosse1982; Dresselhaus & Tabor Reference Dresselhaus and Tabor1992; Nomura & Post Reference Nomura and Post1998; Lawson & Dawson Reference Lawson and Dawson2015). In the pioneering works by Vieillefosse (Reference Vieillefosse1982, Reference Vieillefosse1984) the so-called restricted Euler (RE) model was introduced for an inviscid flow by neglecting the non-local part of the pressure Hessian, while retaining its local contribution. One of the consequences of setting the non-local part of the pressure Hessian to zero in the inviscid equations is conservation of the angular momentum of the fluid element. However, as Vieillefosse demonstrated, this localization of the pressure Hessian results in a model for the velocity gradients that exhibits a finite-time singularity. This singularity arises because although the rotation of the fluid element has a stabilizing effect on the dynamics, the strain self-amplification mechanism drives the system towards the finite-time singularity, in which the fluid element is flattened onto a plane (Vieillefosse Reference Vieillefosse1984). In real turbulence, extreme fluid element deformation can occur either in the form of the fluid element flattening into planes (pancake shape) or stretching into elongated structures (cigar shape) (Girimaji & Pope Reference Girimaji and Pope1990b). There is, however, a bias towards deformation into planes, associated with the tendency of the intermediate Lyapunov exponent to be positive (Johnson & Meneveau Reference Johnson and Meneveau2015).
Despite the finite-time singularity, which makes the system impractical for modelling, the RE model revealed many non-trivial geometrical features of the motion of an incompressible and inviscid flow (Cantwell Reference Cantwell1992). For example, it highlights the tendency of the intermediate strain-rate eigenvalue to take on positive values and it reveals the preferential alignment between the vorticity vector and the intermediate strain-rate eigenvector. However, the RE system conserves several quantities and the presence of these first integrals is related to the onset of the singularity. In a real turbulent flow, the non-local pressure Hessian and viscous stress are key elements which reduce the number of conserved quantities. One of the conserved quantities in the RE system is the determinant of the commutator between the symmetric and anti-symmetric parts of the velocity gradient tensor. That this quantity is conserved implies fundamental constraints on the eigenframe dynamics, namely, that the ordering of the eigenvalues cannot change with respect to the initial conditions and, analogously, the vorticity components in the strain-rate eigenframe cannot change sign (Vieillefosse Reference Vieillefosse1982). The presence of the non-local pressure Hessian and viscous stress in the real Navier–Stokes system can break the conservation of this and other quantities that are conserved in RE. One of the objectives of the present paper is to explore this at different scales in the flow.
Given the crucial role played by the non-local pressure Hessian, as revealed through the RE model, several subsequent models have sought to derive closure models for this term, as well as the viscous term appearing the in Navier–Stokes system. Examples include an early stochastic model based on an exponentiated Gaussian process generating log-normal dissipation rates (Girimaji & Pope Reference Girimaji and Pope1990a), the Lagrangian tetrad model (Chertkov, Pumir & Shraiman Reference Chertkov, Pumir and Shraiman1999; Naso & Pumir Reference Naso and Pumir2005), the recent fluid deformation approximation model (Chevillard et al. Reference Chevillard, Meneveau, Biferale and Toschi2008), the Gaussian random fields approximation (Wilczek & Meneveau Reference Wilczek and Meneveau2014), the recent deformation of Gaussian fields model (Johnson & Meneveau Reference Johnson and Meneveau2016) and closures based on isotropic tensor function representations (Leppin & Wilczek Reference Leppin and Wilczek2020). The velocity gradient dynamics at high Reynolds number is particularly challenging to reproduce. Models that are able to predict features of high Reynolds number flows are constructed using phenomenological arguments such as log-normality of the pseudo-dissipation of kinetic energy (Girimaji & Pope Reference Girimaji and Pope1990a) and multifractality of fully developed turbulence (Pereira, Moriconi & Chevillard Reference Pereira, Moriconi and Chevillard2018). Shell and multi-level models can also reproduce high Reynolds number flows by capturing the interaction between neighbouring scales, such that the interaction between multiple scales in the flow influences the velocity gradients (Biferale et al. Reference Biferale, Chevillard, Meneveau and Toschi2007; Johnson & Meneveau Reference Johnson and Meneveau2017).
These models provide closures for the non-local pressure Hessian that are able to avoid finite-time singularities in the system, and to different degrees, they capture many of the important statistical properties of the velocity gradients. Work still needs to be done, however, to improve the accuracy of their predictions. Furthermore, most of these works, with the exception of the tetrad closure, focused on the bare velocity gradients and equivalent models for the filtered counterpart, which can explicitly include the sub-grid stresses, are lacking. All of the aforementioned closure models for the non-local pressure Hessian and viscous stress require detailed knowledge of the statistical geometry and invariants of the velocity gradient dynamics. For the filtered gradient, characterizing the statistical geometry and invariants of the sub-grid stress is also required to guide the development of Lagrangian models for the filtered velocity gradients. Moreover, as mentioned earlier, the RE model implies fundamental constraints on the eigenframe dynamics, and we wish to explore the extent to which these constraints are violated in Navier–Stokes turbulence, at different scales in the flow. These points motivate the present work.
In the present work, the statistics of the dynamical terms in the filtered velocity gradient equations written in the strain-rate eigenframe, are characterized using results from DNS of statistically steady and isotropic incompressible turbulence. The paper is organized as follows. In § 2, the equations for the velocity gradient in the strain-rate principal basis are outlined. Details on the numerical simulations are in § 3 and the numerical result are presented in § 4. In the numerical analysis, focus is put on the characterization of the non-local/unclosed dynamical terms conditioned on the local/closed dynamical terms. A summary of the main results and the conclusions are in § 5.
2. Dynamical equations in the strain-rate eigenframe
In this section the equations for the filtered velocity gradient are presented and written in the eigenframe of the filtered strain-rate tenor. Since the equations for the velocity gradient in the strain-rate eigenframe are not often employed, and the formulation of these forms of the equations are only briefly presented in a few previous works (Vieillefosse Reference Vieillefosse1982; Dresselhaus & Tabor Reference Dresselhaus and Tabor1992), we will outline the key steps leading to these equations, as well as discuss the terms appearing in the equations which will be helpful for the results section.
2.1. Equations for the filtered velocity gradient
The filtered velocity field is governed by the incompressible, filtered, continuity and Navier–Stokes equations (NSE)
 \begin{gather} \boldsymbol{\nabla}\boldsymbol{\cdot}{\tilde{\boldsymbol{u}}} = 0 , \end{gather}
 \begin{gather}\tilde{D}_t{\tilde{\boldsymbol{u}}} \equiv \partial_t{\tilde{\boldsymbol{u}}} + ({\tilde{\boldsymbol{u}}}\boldsymbol{\cdot}\boldsymbol{\nabla}) {\tilde{\boldsymbol{u}}} = -\boldsymbol{\nabla} \tilde{P} + \nu\nabla^2{\tilde{\boldsymbol{u}}} - \boldsymbol{\nabla}\boldsymbol{\cdot}\boldsymbol{\tau}, \end{gather}
where  ${\tilde {\boldsymbol {u}}}(\boldsymbol {x},t)$,
 $\tilde {P}(\boldsymbol {x},t)$ are the filtered fluid velocity and pressure fields and
 $\nu$ is the kinematic viscosity. We use an isotropic filtering kernel
 $G_{\ell }$ with filtering length
 $\ell$, with which we define the filtering operation of an arbitrary field
 $\boldsymbol {\xi }$ as (Pope Reference Pope2000)
 \begin{equation} \tilde{\boldsymbol{\xi}}(\boldsymbol{x},t) = \int G_{\ell}\left(\|\boldsymbol{x}-\boldsymbol{y}\|\right)\boldsymbol{\xi}(\boldsymbol{y},t)\,\textrm{d}\boldsymbol{y}, \end{equation}
such that  $\boldsymbol {\xi }$ is the bare (un-filtered) field, and
 $\tilde {\boldsymbol {\xi }}$ the filtered field. The sub-grid stress is
 \begin{equation} \boldsymbol{\tau} \equiv \widetilde{\boldsymbol{uu}^{\top}} - \tilde{\boldsymbol{u}}\tilde{\boldsymbol{u}}^{\top}, \end{equation}
where  $\cdot ^{\top }$ indicates transposition.
By taking the gradient of (2.1), the equations for the velocity gradient are obtained:
 \begin{gather} \textrm{Tr}(\tilde{\boldsymbol{A}}) = 0 , \end{gather}
 \begin{gather}\tilde{D}_t{\tilde{\boldsymbol{A}}} = -\tilde{\boldsymbol{A}}\boldsymbol{\cdot}\tilde{\boldsymbol{A}} - \tilde{\boldsymbol{H}}^{{{{P}}}} + \nu \nabla^2 {\tilde{\boldsymbol{A}}} - \boldsymbol{\nabla}\left(\boldsymbol{\nabla}\boldsymbol{\cdot}\boldsymbol{\tau}\right). \end{gather}
The components of the filtered velocity gradient and filtered pressure Hessian in the standard Cartesian basis are
 \begin{equation} \tilde{A}_{ij} \equiv \partial_j \tilde{u}_i , \quad \tilde{H}^{P}_{ij} \equiv \partial_j\partial_i \tilde{P} , \end{equation}
where  $\partial _j$ denotes the derivative with respect to the Cartesian coordinate
 $x_j$. In our notation,
 $\textrm {Tr}(\cdot )$ indicates the matrix trace, while ‘
 $\boldsymbol {\cdot }$’ denotes the standard matrix–matrix product. It is insightful to consider the equations for the symmetric and anti-symmetric parts of the filtered velocity gradient. The symmetric part of the filtered velocity gradient,
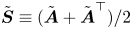 ${\tilde {\boldsymbol {S}}} \equiv ({\tilde {\boldsymbol {A}}}+{\tilde {\boldsymbol {A}}}^{\top })/2$, is the filtered strain rate, while the anti-symmetric part,
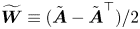 ${\widetilde {\boldsymbol {W}}} \equiv ({\tilde {\boldsymbol {A}}}-{\tilde {\boldsymbol {A}}}^{\top })/2$, is associated with the filtered vorticity,
 ${\tilde {\boldsymbol {\omega }}} = \boldsymbol {\nabla } \boldsymbol {\times } {\tilde {\boldsymbol {u}}}$. The equation for the filtered velocity gradient (2.4) is decomposed into its symmetric and anti-symmetric part. The filtered strain rate is governed by
 \begin{gather} \textrm{Tr}(\tilde{\boldsymbol{S}}) = 0 , \end{gather}
 \begin{gather}\tilde{D}_t{\tilde{\boldsymbol{S}}} = -{\tilde{\boldsymbol{S}}}\boldsymbol{\cdot}{\tilde{\boldsymbol{S}}} + {\widetilde{\boldsymbol{W}}}\boldsymbol{\cdot}{\widetilde{\boldsymbol{W}}}^{\top} - \tilde{\boldsymbol{H}}^{{{{P}}}} + \tilde{\boldsymbol{H}}^{{{$\nu$}}} - \boldsymbol{H}^{\tau}, \end{gather}
where the Cartesian components of the viscous and sub-grid stress contributions are
 \begin{equation} {H}^{\nu}_{ij} \equiv \nu \partial_{k}\partial_{k} \tilde{S}_{ij}, \quad {H}^{\tau}_{ij} \equiv \partial_k\left(\partial_j\tau_{ik} + \partial_i\tau_{jk}\right)/2. \end{equation}
The filtered vorticity is governed by the equation
 \begin{equation} \tilde{D}_t\tilde{\boldsymbol{\omega}} = {\tilde{\boldsymbol{S}}}\boldsymbol{\cdot} \tilde{\boldsymbol{\omega}} + \tilde{\boldsymbol{\varOmega}}^{{{$\nu$}}} - \boldsymbol{\varOmega}^{\tau}, \end{equation}
and the Cartesian components of the viscous and sub-grid stress contributions are
 \begin{equation} \tilde{\varOmega}^{\nu}_{ij} \equiv \nu \partial_{k}\partial_{k} \tilde{\omega}_{i}, \quad \varOmega^{\tau}_{ij} \equiv \epsilon_{ikj} \partial_k \partial_m\tau_{jm}, \end{equation}
where  $\epsilon _{ijk}$ is the permutation symbol.
2.2. Navier–Stokes equations in the strain-rate eigenframe
The equations for the filtered strain rate (2.6) and filtered vorticity (2.8) are now expressed in the filtered strain-rate eigenframe, the derivation is detailed in appendix A. For notation simplicity, the tilde denoting filtering quantities is suppressed in the following.
The strain-rate eigenframe is formed by the strain-rate eigenvectors  $\{\boldsymbol {v}_i\}$ and it undergoes a rigid body rotation, since the eigenvectors remain orthonormal and right oriented for all times. The angular velocity of the strain-rate eigenframe is associated with the anti-symmetric tensor
 $\boldsymbol {\varPi }$ which represents the rate of rotation in the plane composed of two of the eigenvectors about the axis of the third, that is
 $\varPi _{ij}=\textrm {d}_t\boldsymbol {v}_i\boldsymbol {\cdot }\boldsymbol {v}_j$ (Nomura & Post Reference Nomura and Post1998). The equations for the filtered strain-rate eigenvalues
 $\lambda _i$ and eigenframe rotation-rate
 $\varPi _{ij}$ dynamics read
 \begin{gather} \sum_{i=1}^3 \lambda_i = 0, \end{gather}
 \begin{gather}D_t \lambda_i = -\lambda_i^2 + \tfrac{1}{4}\left(\omega^2-\omega_i^{* 2}\right) - H_{i(i)}^{P*} + H_{i(i)}^{\nu*} - H_{i(i)}^{\tau*}, \end{gather}
 \begin{gather}(\lambda_{(\,j)}-\lambda_{(i)})\varPi^{*}_{ij} = -\tfrac{1}{4}\omega_i^{*}\omega_j^{*} - H_{ij}^{P*} + H_{ij}^{\nu*} - H_{ij}^{\tau*},\quad \text{for } i\neq j , \end{gather}
where  $\omega _i^{*}=\boldsymbol {v}_i^{\top }\boldsymbol {\cdot } \boldsymbol {\omega }$ are the vorticity components in the strain eigenframe,
 $\omega \equiv \|\boldsymbol {\omega }\|$ is the norm of the vorticity and indices in parentheses are not contracted. The symbol
 $(\cdot )^*$ denotes components in the strain-rate principal basis. In particular the components of the pressure, viscous and sub-grid contributions read
 \begin{equation} H_{ij}^{P *} = \boldsymbol{v}_i^{\top}\boldsymbol{\cdot}\boldsymbol{H}^P\boldsymbol{\cdot}\boldsymbol{v}_j, \quad H_{ij}^{\nu *} = \boldsymbol{v}_i^{\top}\boldsymbol{\cdot}\boldsymbol{H}^{\nu}\boldsymbol{\cdot}\boldsymbol{v}_j, \quad H_{ij}^{\tau *} = \boldsymbol{v}_i^{\top}\boldsymbol{\cdot}\boldsymbol{H}^{\tau} \boldsymbol{\cdot}\boldsymbol{v}_j. \end{equation}
Analogously, the vorticity equation (2.8) in the strain-rate eigenframe reads
 \begin{equation} D_t \omega_i^{*} = \lambda_{(i)}\omega_i^{*} - \varPi_{ij}^{*}\omega_j^{*} + \varOmega_i^{\nu*} - \varOmega_i^{\tau*}, \end{equation}
where the principal components of the viscous and sub-grid contributions are
 \begin{equation} \varOmega_{i}^{\nu *} = \boldsymbol{v}_i^{\top}\boldsymbol{\cdot}\boldsymbol{\varOmega}^{\nu}, \quad \varOmega_{i}^{\tau *} = \boldsymbol{v}_i^{\top}\boldsymbol{\cdot}\boldsymbol{\varOmega}^{\tau}. \end{equation}
Equation (2.10a) is just the incompressibility constraint expressed in the eigenframe. The first term on the right-hand side of (2.10b) is the strain self-interaction which acts to amplify the magnitude of the most compressional eigenvalue and suppress the magnitude of the most extensional eigenvalue. The second term represents a straining produced in the fluid due to the rotation of the fluid element and the associated centrifugal force. This term acts only in the plane orthogonal to the vorticity vector. The third, fourth and fifth terms in (2.10b) are the symmetric contributions from the pressure Hessian, viscous stress and sub-grid stress. The isotropic part of the pressure Hessian guarantees incompressibility. The anisotropic part of the pressure Hessian plays a major role in regularization of the dynamics generated by the local terms (which are expressible in terms of the gradient at the fluid particle position) and we will analyse its statistics in detail. The viscous stress acts, on average, as a damping on both the strain rate and the vorticity. However, the statistical behaviour of the viscous stress differs from that of a simple linear damping and it also plays a relevant role in the transport of vorticity. The sub-grid stress represents the effect of the scales that have been filtered out of the filtered gradient dynamics. We will characterize its statistical properties across the scales and it will be shown how the sub-grid stress interacts with the pressure Hessian and viscous stress in a non-trivial way.
The contributions to the eigenframe components of the rotation tensor  $\boldsymbol {\varPi }$ are described by (2.10c). They consist of contributions from the centrifugal stresses due to the rotation of the fluid element (which is retained in the RE model), the anisotropic pressure Hessian, viscous and sub-grid stresses, which are defined as
 \begin{equation} \left. \begin{gathered} \varPi^{RE*}_{ij} \equiv -\frac{1}{4}\frac{\omega_i^{*}\omega_j^{*}}{\lambda_{(\,j)}-\lambda_{(i)}}, \quad \varPi^{P*}_{ij} \equiv -\frac{H_{ij}^{P*}}{\lambda_{(\,j)}-\lambda_{(i)}},\\ \varPi^{\nu*}_{ij} \equiv \frac{H_{ij}^{\nu*}}{\lambda_{(\,j)}-\lambda_{(i)}}, \quad \varPi^{\tau*}_{ij} \equiv -\frac{H_{ij}^{\tau*}}{\lambda_{(\,j)}-\lambda_{(i)}}, \end{gathered} \right\} \end{equation}
for  $i\ne j$. The numerators in (2.14) may be interpreted as representing torques, which arise from local and non-local effects, while the denominator can be interpreted as the moment of inertia.
Pressure depends quadratically on the velocity gradient through its second invariant  $Q\equiv -\textrm {Tr}(\boldsymbol {A}\boldsymbol {\cdot }\boldsymbol {A})/2$
 \begin{equation} P(\boldsymbol{x},t) = -\frac{1}{2{\rm \pi}} \int \frac{Q(\boldsymbol{y},t)}{\|\boldsymbol{y}-\boldsymbol{x}\|} \,\textrm{d} \boldsymbol{y}. \end{equation}
Since the kernel in (2.15) decays only algebraically (as opposed to a strongly decaying exponential kernel, for example) with distance from the fluid particle at  $\boldsymbol {x}$, as
 $\|\boldsymbol {y}-\boldsymbol {x}\|^{-1}$ for the pressure field and as
 $\|\boldsymbol {y}-\boldsymbol {x}\|^{-3}$ for the pressure Hessian, the local and non-local contributions from
 $P(\boldsymbol {x},t)$ to
 $\varPi _{ij}^{P*}$ may be of comparable magnitude. In fact, previous results for the bare velocity gradient dynamics show that the contribution from the non-local pressure Hessian to
 $\varPi _{ij}^{P*}$ dominates over the local contribution (She et al. Reference She, Jackson, Orszag, Hunt, Phillips and Williams1991; Dresselhaus & Tabor Reference Dresselhaus and Tabor1992). We will consider whether this also is the case for finite filtering lengths
 $\ell _F>0$.
The dynamics of the vorticity in the eigenframe is described by (2.12). The first term on the right-hand side of (2.12) is vortex stretching, and the physical mechanism embedded in that term is particularly clear from this eigenframe perspective. The second represents the reorientation (tilting) of the vorticity with respect to the eigenframe due to the rotation of the eigenframe. This term does not affect the evolution of the vorticity magnitude directly since 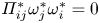 $\varPi _{ij}^{*}\omega _j^{*}\omega _i^{*}=0$, although it indirectly contributes since the vortex-stretching term depends on
 $\omega _j^{*}$. Moreover, the angular velocity component along the vorticity direction does not affect the tilting of vorticity, and corresponds to a redundant degree of freedom with respect to the dynamical evolution of
 $\lambda _i$ and
 $\omega _j^{*}$ (Carbone et al. Reference Carbone, Iovieno and Bragg2020). The RE contribution to vorticity tilting in (2.12) is
 \begin{equation} -\varPi^{RE*}_{ij}\omega_j^{*} = \frac{1}{4}\sum_{j \neq i} \frac{\omega_j^{*2}}{\lambda_{j}-\lambda_{i}}\omega_i^{*}, \end{equation}
which for  $i = 1$ reads as
 \begin{equation} -\varPi^{RE*}_{1j}\omega_j^{*} = \frac{1}{4} \left(\frac{\omega_2^{*2}}{\lambda_{2}-\lambda_{1}} + \frac{\omega_3^{*2}}{\lambda_{3}-\lambda_{1}} \right) \omega_1^{*}, \end{equation}
and similarly for other components. The  $j \neq i$ in (2.16) is to remind the reader that when computing
 $\varPi ^{RE*}_{ij}\omega _j^{*}$ as matrix vector product,
 $\varPi ^{RE*}_{ij}$ corresponds to an anti-symmetric tensor having zero along the diagonals. Since the ordering of the eigenvalues cannot change in the RE model (Nomura & Post Reference Nomura and Post1998), this contribution acts as a nonlinear damping for
 $\omega _1^{*}$ and as a nonlinear amplification for
 $\omega _3^{*}$ in the RE model. In real turbulence governed by the NSE, the eigenvalue ordering can change with time, such that the sign, and therefore the role of this term is not fixed with time.
By substituting (2.10c) into (2.12) it can be shown that the viscous stress contribution to vorticity tilting,  $\varPi _{ij}^{\nu *}\omega _j$, is identically cancelled by part of the contribution coming from
 $\varOmega _i^{\nu *}$ (Dresselhaus & Tabor Reference Dresselhaus and Tabor1992; Nomura & Post Reference Nomura and Post1998; Lawson & Dawson Reference Lawson and Dawson2015). However, we wish to consider the full viscous contribution,
 $\varOmega _i^{\nu *}$, and therefore do not expand it into its subparts. The third and fourth terms on the right-hand side of the vorticity equation (2.12) derive from the anti-symmetric part of the viscous and sub-grid stress. Since all the other terms in that equation are proportional to
 $\boldsymbol {\omega }$, these are the only terms that can generate vorticity from an initially irrotational state.
3. Direct numerical simulation
To analyse the dynamical properties of the filtered velocity gradients in the strain-rate eigenframe, we consider data from a DNS of statistically stationary, isotropic turbulence. The data we use are from the DNS in Ireland, Bragg & Collins (Reference Ireland, Bragg and Collins2016a,Reference Ireland, Bragg and Collinsb), at a Taylor microscale Reynolds number  $R_{\lambda }=597$. Incompressible Navier–Stokes equations were solved using a pseudo-spectral method on a three-dimensional, triperiodic cubic domain of length
 $2{\rm \pi}$, discretized with
 $2048^3$ grid points. Deterministic forcing scheme kept the kinetic energy of the flow constant in time. The scale separation between the integral length scale
 $\mathcal {L}$ and the Kolmogorov scale
 $\eta$ in the DNS flow was
 $\mathcal {L}/\eta \simeq 812$. Further details on the numerical method used can be found in Ireland et al. (Reference Ireland, Vaithianathan, Sukheswalla, Ray and Collins2013). Details of the simulation are given in table 1.
Flow parameters for the DNS study (all dimensional parameters are in arbitrary units). The simulation was performed in parallel on  $N_{{proc}}$ processors and all statistics are averaged over
 $T$, the duration of the run;
 $R_{\lambda } \equiv u'\lambda /\nu \equiv 2K/\sqrt {5/3\nu \langle \epsilon \rangle }$ is the Taylor microscale Reynolds Number,
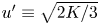 $u' \equiv \sqrt {2K/3}$ is the root mean square of fluctuating fluid velocity,
 $K$ is the turbulent kinetic energy,
 $\lambda$ is the Taylor microscale,
 $\nu$ is the fluid kinematic viscosity,
 $\langle \epsilon \rangle \equiv 2 \nu \int _{0}^{\kappa _{max}} \kappa ^2 E(\kappa )\,\textrm {d}\kappa$ is the mean turbulent kinetic energy dissipation rate,
 $\kappa$ is the wavenumber in Fourier space and
 $E(\kappa )$ is the energy spectrum. The integral length scale is defined as
 $\mathcal {L} \equiv (3{\rm \pi} /2K) \int _{0}^{\kappa _{max}} (E(\kappa )/\kappa )\,\textrm {d}\kappa$,
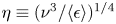 $\eta \equiv (\nu ^{3}/\langle \epsilon \rangle )^{1/4}$ is the Kolmogorov length scale,
 $\tau _{\eta } \equiv \sqrt {\nu /\langle \epsilon \rangle }$ is the Kolmogorov time scale,
 $u_{\eta } \equiv (\langle \epsilon \rangle \nu )^{3/4}$ is the Kolmogorov velocity scale and
 $\tau _{\mathcal {L}} \equiv \mathcal {L}/u'$ is the large-eddy turnover time. The maximum resolved wavenumber is
 $\kappa _{{max}} = \sqrt {2}N/3$,
 $\kappa _{{max}}\eta$ is the small-scale resolution,
 $L$ is the domain size and
 $N$ is the number of grid points in each direction.

We apply a sharp spectral cutoff at wavenumber  $k_F$ to obtain the filtered field. In order to relate the spectral cutoff wavenumber
 $k_F$ to a physical space filtering scale, we define
 $\ell _F\equiv 2{\rm \pi} /k_F$ (Eyink & Aluie Reference Eyink and Aluie2009). When constructing the pressure Hessian from the velocity field, there are some subtleties that must be carefully accounted for in order to ensure that the pressure Hessian computed has the correct properties. These issues are discussed in appendix B. The velocity field is filtered at scale
 $\ell _F$ and the resulting filtered velocity gradient, pressure Hessian, viscous stress and sub-grid stress are analysed.
4. Results and discussion
We now turn to consider the role of the different terms appearing in the eigenframe dynamical equations for different filtering scales  $\ell _F$, with quantities normalized using the scale-dependent time scale
 \begin{equation} \tilde{\tau} \equiv \sqrt{ \nu / {\langle \widetilde{\epsilon} \rangle} }, \end{equation}
where 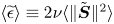 $ {\langle \widetilde{\epsilon} \rangle }\equiv 2\nu \langle \|\tilde {\boldsymbol {S}}\|^2\rangle$ is the scale-dependent dissipation rate. Furthermore, while the eigenvalues
 $\lambda _1,\lambda _2,\lambda _3$ are not ordered in the dynamical equations discussed in § 2, it is standard and helpful to consider results in which the eigenvalues are ordered. Therefore, in the results that follow, the eigenvalues are ordered
 $\lambda _1\geq \lambda _2\geq \lambda _3$, with corresponding ordered eigenvectors
 $\boldsymbol {v}_1,\boldsymbol {v}_2,\boldsymbol {v}_3$. This ordering allows us to unambiguously interpret the significance of the sign of the local dynamical terms in (2.10) and (2.12). We also remind the reader that for notational simplicity the tilde used earlier to denote filtered quantities has been dropped, and all variables correspond to filtered variables unless otherwise stated.
The results section is organized as follows. We begin by computing the first and second moments of the terms in the strain-rate eigenvalue and enstrophy component evolution equations at various filtering scales in § 4.1. This helps to understand the relative importance of the various terms and whether they aid or oppose the growth of strain-rate eigenvalues and enstrophy components, on average. Next, in § 4.2, we comment on the average behaviour of the strain-rate eigenvalues and enstrophy components when conditioned on the invariants of the velocity gradient. In § 4.3, we focus on the local and non-local contributions to the strain-rate eigenframe rotation rate, and the associated tilting of the vorticity vector with respect to the eigenframe. Then, we turn our attention to the characterization of the pressure Hessian in § 4.4. First, we analyse the diagonal components of the anisotropic pressure Hessian in the strain-rate eigenframe, conditioned on the square of the local velocity gradient and filtered at various scales. Then, we illustrate the preferential state of the pressure Hessian at different scales through a newly proposed generalization of the Lumley triangle. We proceed to characterize the viscous terms by focusing on the eigenframe components of the Laplacian of the strain-rate tensor and vorticity vector in § 4.5. Finally, in § 4.6, we report correlations between the sub-grid stress and other terms in the velocity gradient equations expressed in the eigenframe, across a range of scales.
4.1. Contributions to eigenvalue and vorticity component dynamics
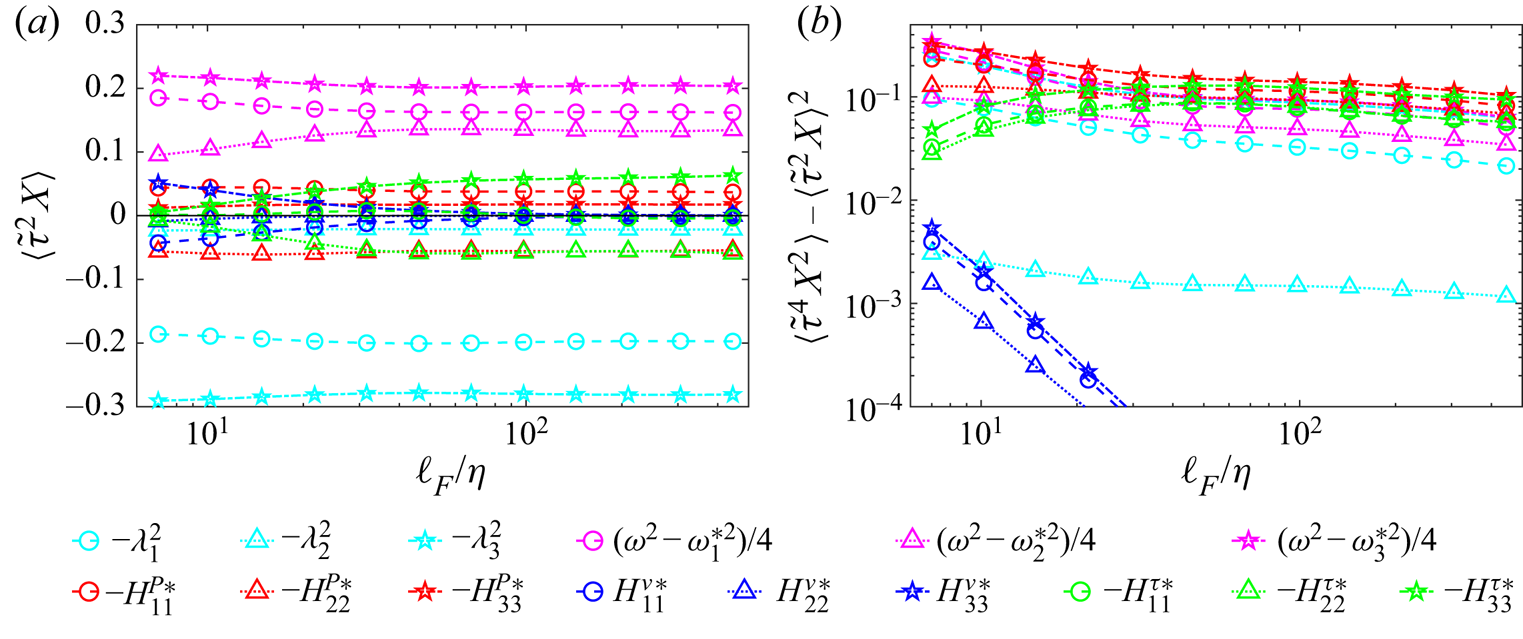
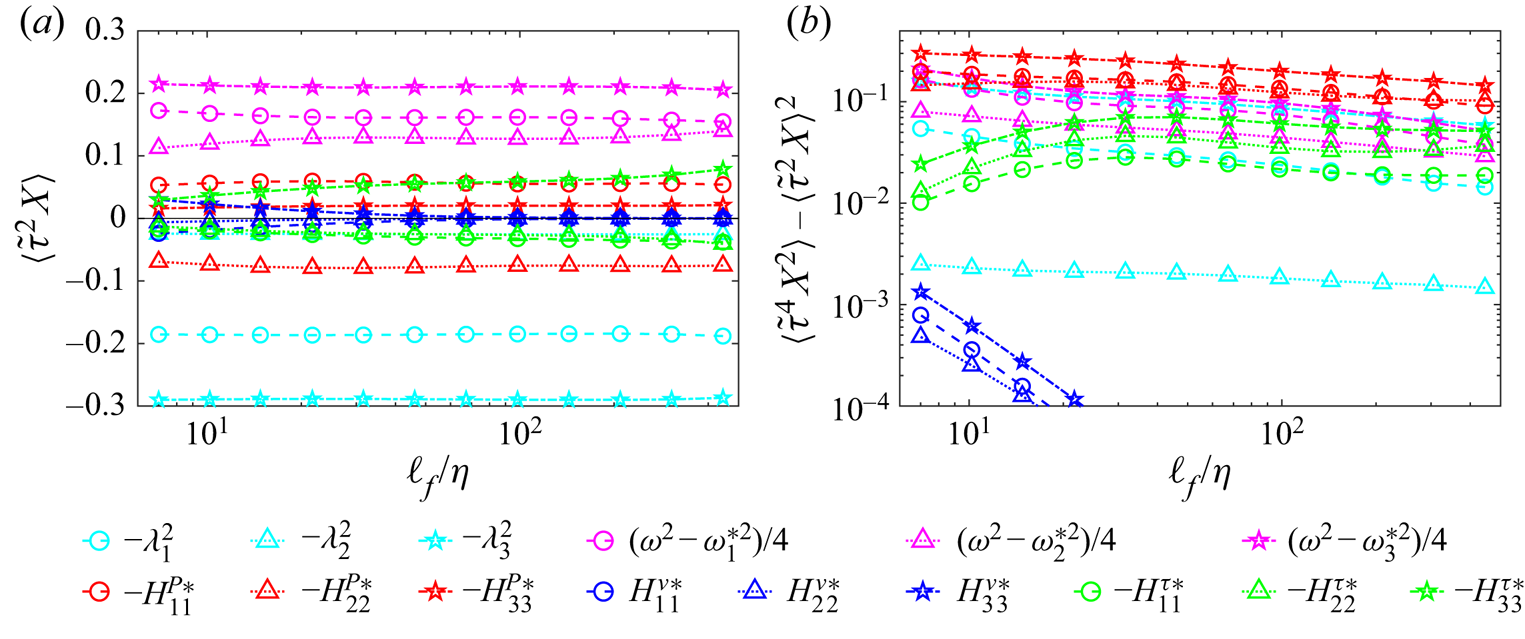
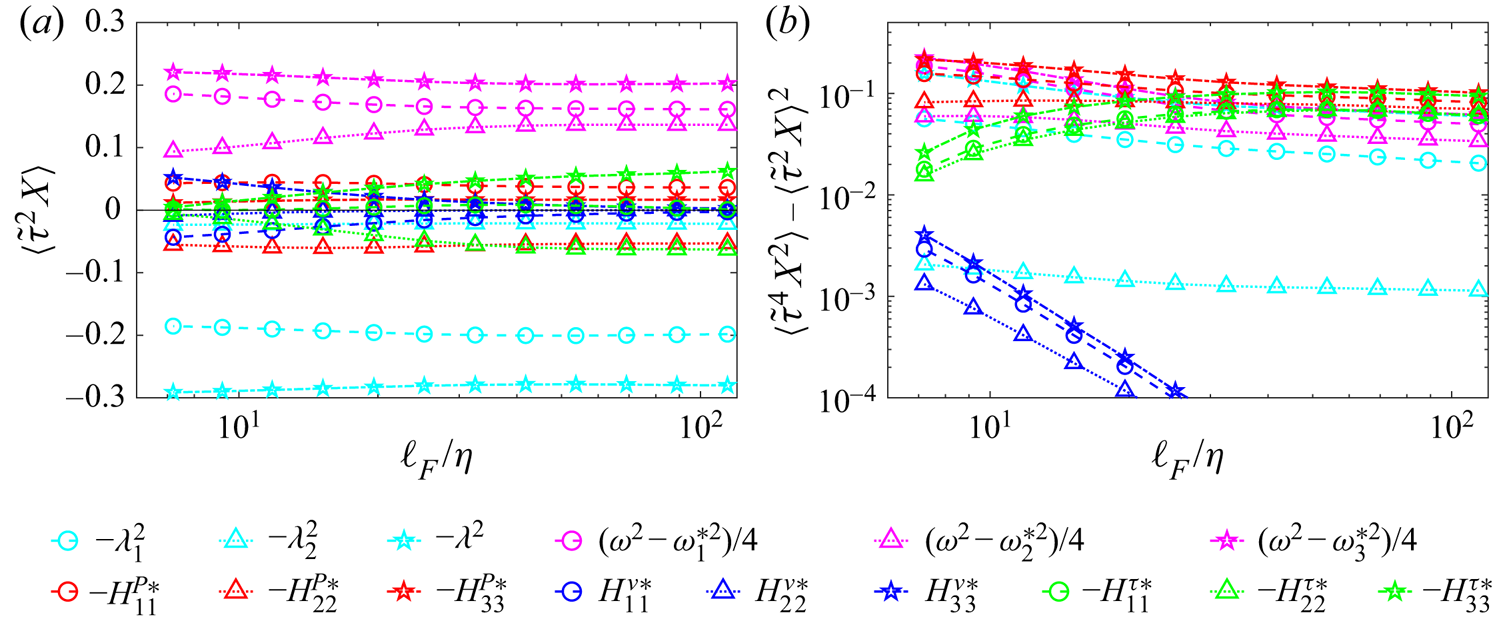
Figure 1 shows the averages and second moments of the contributions to the evolution of the strain-rate eigenvalues, governed by (2.10b). Note that the average contributions need not be zero. For example, while  $\langle H_{ij}^{P}\rangle \equiv \langle {\boldsymbol {e}_i^{\top }\boldsymbol {\cdot }\boldsymbol {H}^P\boldsymbol {\cdot }\boldsymbol {e}_j }\rangle = \boldsymbol {e}_i^{\top }\boldsymbol {\cdot } \langle \boldsymbol {H}^P \rangle \boldsymbol {\cdot }\boldsymbol {e}_j = 0\ \forall \, i,j$ (since
 $\boldsymbol {e}_i$ are not random) for a homogeneous flow,
 $\langle H_{ij}^{P*}\rangle \equiv \langle {\boldsymbol {v}_i^{\top }\boldsymbol {\cdot }\boldsymbol {H}^P\boldsymbol {\cdot }\boldsymbol {v}_j} \rangle$ need not be zero because
 $\boldsymbol {v}_i$ fluctuates and is correlated with
 $\boldsymbol {H}^P$. Moreover,
 $\boldsymbol {v}_i$ are the eigenvectors corresponding to the ordered eigenvalues, which also introduces a bias in the average components. For example, when computing
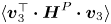 $\langle {\boldsymbol {v}_3^{\top } \boldsymbol {\cdot }\boldsymbol {H}^P\boldsymbol {\cdot }\boldsymbol {v}_3} \rangle$ we are averaging the components of the Hessian along the most compressional strain direction (not a generic direction in the flow) and we expect that the orientation of the
 $\boldsymbol {H}^P$ eigenframe is correlated to the orientation of the strain-rate eigenframe.
(a) Average and (b) variance of the terms in (2.10b), normalized by the scale-dependent time scale  $\tilde {\tau }$, and plotted as a function of the filtering scale
 $\ell _F/\eta$. Different colours distinguish the various terms, while different line types and symbols refer to different components of those terms.

The most negative strain-rate eigenvalue,  $\lambda _3$, has on average the largest magnitude among the strain-rate eigenvalues. An implication of this is, for example, that its contribution dominates the strain self-amplification,
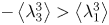 $-\left \langle \lambda _3^3\right \rangle >\left \langle \lambda _1^3\right \rangle$ at all scales in the flow (Tsinober Reference Tsinober2001; Carbone & Bragg Reference Carbone and Bragg2020). The term
 $-\lambda _3^2$ drives the RE system towards a finite-time singularity since it dominates the dynamics, amplifying a negative
 $\lambda _3$ (Vieillefosse Reference Vieillefosse1982). However, the rotation of the fluid element gives a strong stabilizing contribution through
 $\omega ^2-\omega _3^{* 2}$, with magnitude that is comparable to that of the self-amplification of
 $\lambda _3$. The misalignment between
 $\boldsymbol {\omega }$ and
 $\boldsymbol {v}_3$ can be then traced back to the importance of the stabilizing effect of
 $\omega ^2-\omega _3^{* 2}$. In particular, the vorticity component
 $\omega _3^{*}$ (and the corresponding alignment
 $\omega _3^{*}/\omega$) is small along the right Vieillefosse tail where the RE system blows up, as shown in figure 4. The stabilizing effect of the rotation of the fluid element is exploited in reduced models for the velocity gradient dynamics to avoid the finite-time singularity thus producing steady-state statistics of the velocity gradient. Indeed, when the relative weight of the strain self-amplification
 $\alpha \lambda _i^2$ is reduced with respect to the magnitude of the rotation term
 $\beta (\omega -\omega _i^{*2})$, through the model coefficients
 $\alpha$ and
 $\beta$, then steady-state statistics can be obtained (Wilczek & Meneveau Reference Wilczek and Meneveau2014; Lawson & Dawson Reference Lawson and Dawson2015). This reduction of nonlinearity is attributed mainly to the pressure Hessian. On the other hand, the term
 $-\lambda _1^2$ has by definition a stabilizing effect on
 $\lambda _1$ while the corresponding vorticity contribution
 $(\omega ^2-\omega _1^{* 2})$ helps the growth of
 $\lambda _1$.
Since  $-\lambda _3^2$ tends to make the dynamics unstable, it would be expected that, in order to prevent the velocity gradients becoming singular, the strongest effect of the pressure Hessian would be on
 $\lambda _3$. However, the average pressure Hessian contribution to
 $\lambda _3$, namely
 $\langle -H_{33}^{P*}\rangle$, is the smallest among the pressure components, although its variance is the largest, as shown in figure 1(b). Nevertheless, on average, this term does tend to hinder the growth of negative
 $\lambda _3$. The diagonal components of
 $\langle -H_{ij}^{P*}\rangle$, when normalized by
 $\tilde {\tau }^2$, do not show significant variations as a function of
 $\ell _F$. Therefore, at least on average,
 $H_{ij}^{P*}$ scales approximately as
 ${\sim }\tilde {\tau }^{-2}$, as expected from dimensional analysis, and consistent with models such as that of Wilczek & Meneveau (Reference Wilczek and Meneveau2014), which express the pressure Hessian as a linear combination of
 $\boldsymbol {S}\boldsymbol {\cdot }\boldsymbol {S}$ and
 $\boldsymbol {W}\boldsymbol {\cdot }\boldsymbol {W}^{\top }$. However, we would expect departures from this scaling for higher-order moments of
 $-H_{ij}^{P*}$ due to intermittency.
The average effect of the pressure Hessian on  $\lambda _1$ is
 $\langle -H_{11}^{P*}\rangle$ and is positive, indicating that on average the pressure Hessian helps the growth of
 $\lambda _1$. This also implies that the pressure Hessian indirectly contributes to the stretching of
 $\boldsymbol {\omega }$ along
 $\boldsymbol {v}_1$, opposing the preferential alignment of the vorticity with the intermediate eigenvector
 $\boldsymbol {v}_2$. Interestingly, the largest average contribution from the pressure Hessian is for the intermediate eigenvalue,
 $\lambda _2$, and
 $\langle -H_{22}^{P*}\rangle$ is negative at all scales, driving
 $\lambda _2$ towards negative values. In this sense, the pressure Hessian hinders vortex stretching, suppressing the nonlinear amplification of
 $\omega _2^{*}$ through
 $\lambda _2$ (see (2.12)).
The viscous term  $\langle H_{i(i)}^{\nu *}\rangle$ tends to hinder all the eigenvalues, with
 $\langle H_{11}^{\nu *}\rangle <0$,
 $\langle H_{22}^{\nu *}\rangle <0$ and
 $\langle H_{33}^{\nu *}\rangle >0$. In the dissipation range,
 $\langle H_{i(i)}^{\nu *}\rangle$ is largest in magnitude for
 $i=3$, which is associated with
 $\lambda _3$ having the largest magnitude on average. Furthermore,
 $\langle H^{\nu *}_{22}\rangle$ is very small compared to the other components, and therefore because of incompressibility,
 $\langle H_{11}^{\nu *}\rangle \approx -\langle H_{33}^{\nu *}\rangle$. The term is related to the curvature of the strain field and the clear tendency for
 $\langle H_{22}^{\nu *}\rangle$ to be small can be a consequence of the moderate fluctuations of the intermediate eigenvalue. Indeed, the contribution from
 $\lambda _2$ to the strain self-amplification, namely
 $\left \langle \lambda _2^3\right \rangle$, is the smallest among the contributions of the eigenvalues (Tsinober Reference Tsinober2001; Carbone & Bragg Reference Carbone and Bragg2020). Also, the sign of
 $\lambda _2$ fluctuates and the average
 $\lambda _2$ is small with respect to the average of the other eigenvalues. The average viscous stress components vary considerably across the scales, as expected since by definition these terms play a sub-leading dynamical role outside of the dissipation range.
The role of the sub-grid stress has not been investigated much in the literature, especially from the perspective of the strain-rate eigenframe. The sub-grid stress contribution to the dynamics increases with increasing  $\ell _F$, and at the largest scales the sub-grid stress makes a leading order contribution to the eigenvalue dynamics. The sub-grid stress has strong variations across the scales even if normalized with a scale-dependent time scale. However, across all the scales
 $\langle H^{\tau *}_{11}\rangle$ remains very small compared to the other components and, as a consequence,
 $\langle H^{\tau *}_{33}\rangle \simeq \langle H^{\tau *}_{22}\rangle$. The sub-grid stress tends on average to drive
 $\lambda _2$ towards negative values and it hinders the growth of
 $|\lambda _3|$. In this sense, for the intermediate and most compressional principal directions, it acts similarly to the pressure Hessian, even if the quantitative trends of
 $H^{P*}_{i(i)}$ and
 $H^{\tau *}_{i(i)}$ across the scales are very different.
Figure 1(b) shows the variance of the contributions to the eigenvalue equation. The results show that the variance of  $H_{i(i)}^{P*}$ is the largest of the contributions, with the variance of
 $H_{11}^{P*}$ and
 $H_{33}^{P*}$ decreasing as
 $\ell _F$ is increased, but becoming approximately constant in the inertial range when normalized by
 $\tilde {\tau }$. On the other hand, the variance of
 $H_{22}^{P*}$ is almost independent of
 $\ell _F$ when normalized by
 $\tilde {\tau }$, and this component is always the smallest. This is perhaps the reason why
 $\lambda _2$ undergoes smaller fluctuations in its time evolution than the other eigenvalues, which confirms the observation by Dresselhaus & Tabor (Reference Dresselhaus and Tabor1992) concerning the relatively small magnitude and persistency of the intermediate eigenvalue. The variance of the viscous term, normalized by
 $\tilde {\tau }$, becomes very small as
 $\ell _F$ is increased, decreasing as
 $\ell _F^{-\xi }$ with
 $\xi$ between 2 and 3.
Since there is a sign ambiguity in the definition of the eigenvectors  $\boldsymbol {v}_i$, there is a corresponding ambiguity in the sign of
 $\omega ^*_i$. When solving (2.12) in a Lagrangian frame this ambiguity is removed through the choice of a particular direction for
 $\boldsymbol {v}_i$ in the initial conditions. However, we are computing terms based on data in the Eulerian frame (i.e. at fixed grid points). Therefore, instead of considering the dynamical contributions to (2.12), we will consider the dynamical contributions to the enstrophy equation (here we are calling
 $\omega _i^{*2} \equiv \omega _{(i)}^{*} \omega _i^{*}$ the enstrophy, although strictly speaking, the enstrophy is
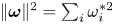 $\|\boldsymbol {\omega }\|^2=\sum _i \omega _i^{*2}$)
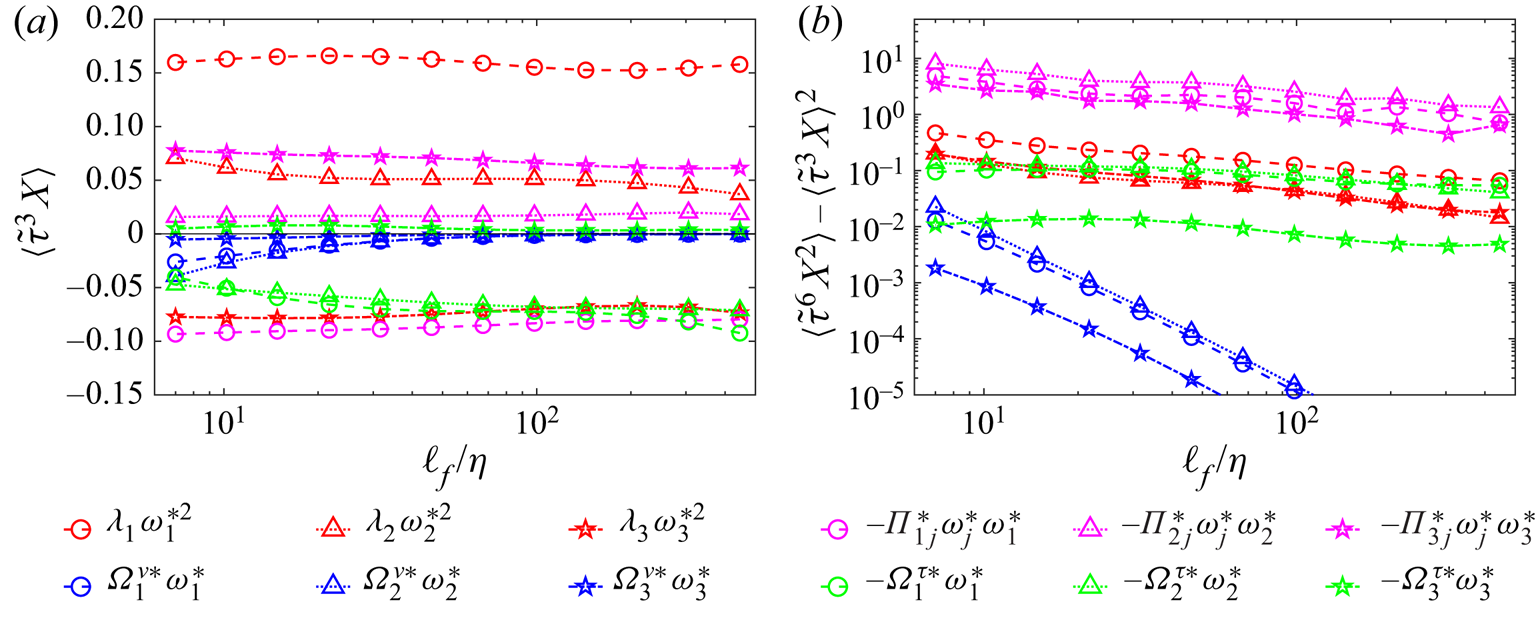
 \begin{equation} \tfrac{1}{2}D_t \omega_i^{*2} = \lambda_{(i)}\omega_i^{*2} - \varPi_{ij}^{*}\omega_j^{*}\omega_{(i)}^{*} + \varOmega_i^{\nu*}\omega_{(i)}^{*} - \varOmega_i^{\tau*}\omega_{(i)}^{*}. \end{equation}
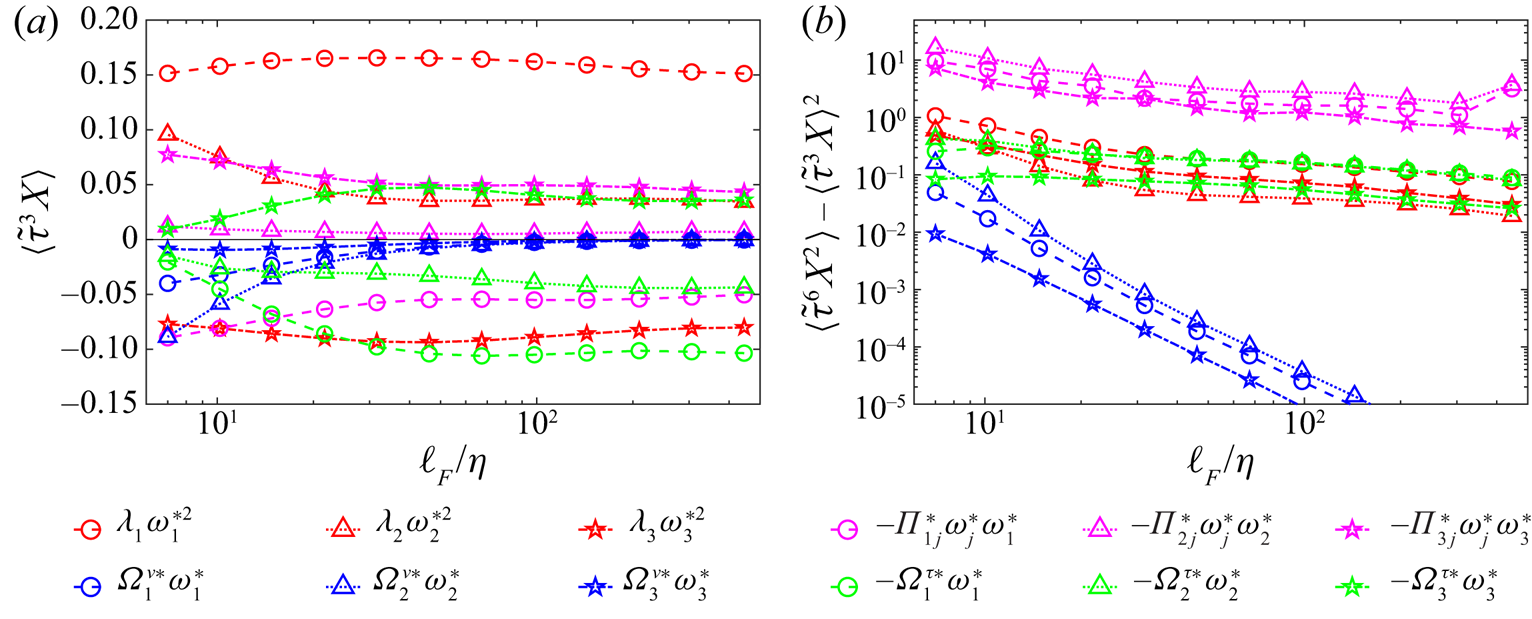
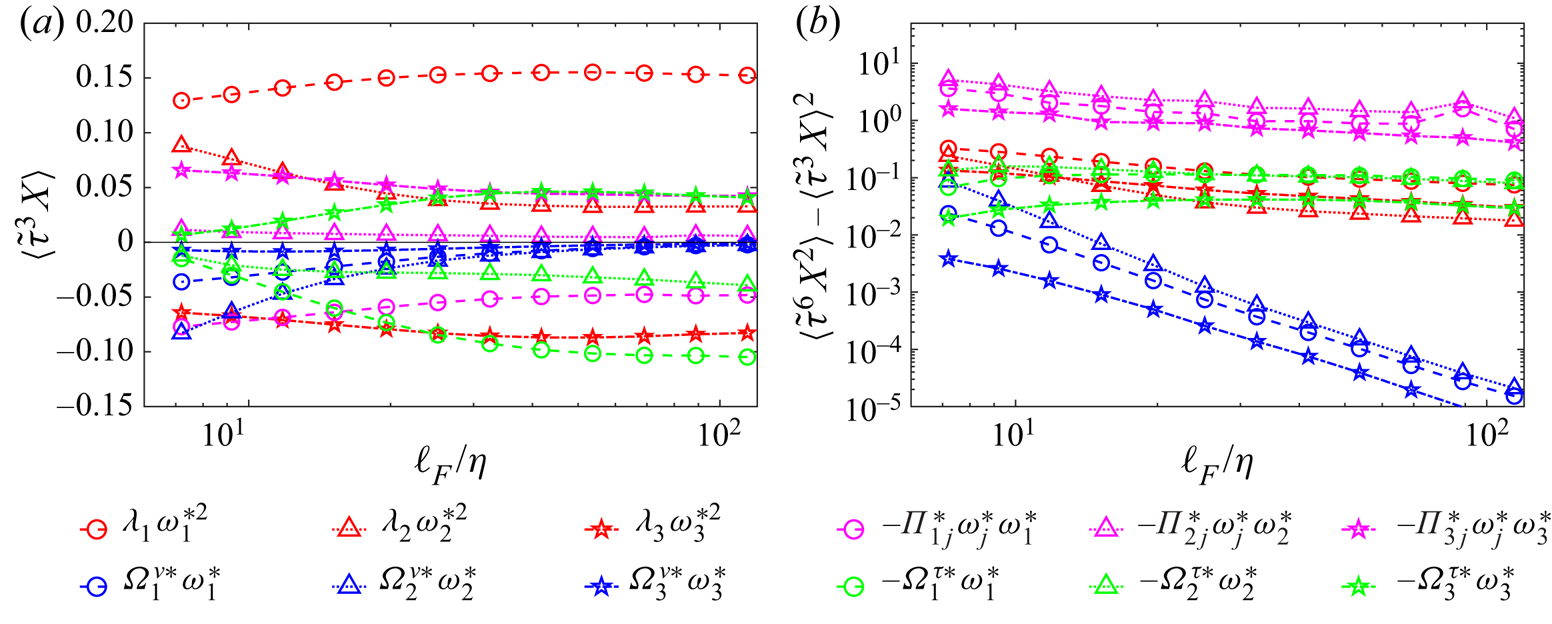
In figure 2(a) we show the averages of the terms on the right-hand side of (4.2). The results show that the vortex-stretching term  $\lambda _{(i)}\omega _i^{*2}$ acts on average to increase
 $\omega _1^{* 2}$ and
 $\omega _2^{* 2}$, and to reduce
 $\omega _3^{* 2}$. It is known that although
 $\boldsymbol {\omega }$ is preferentially aligned with
 $\boldsymbol {v}_2$ (Ashurst et al. Reference Ashurst, Kerstein, Kerr and Gibson1987; Meneveau Reference Meneveau2011),
 $\lambda _1\omega _1^{* 2}$ gives on average the largest contribution to vortex stretching
 $\langle \boldsymbol {\omega }^{\top }\boldsymbol {\cdot }\boldsymbol {S} \boldsymbol {\cdot } \boldsymbol {\omega }\rangle =\sum _{i}\langle \lambda _{(i)}\omega _i^{* 2}\rangle$ in the limit
 $\ell _F/\eta \to 0$ (i.e. for the unfiltered gradients) since
 $\lambda _1$ tends to be larger than
 $\lambda _2$ (Tsinober Reference Tsinober2001). Our results show that for
 $\ell _F$ outside of the dissipation range, the contribution to vortex stretching from
 $\lambda _1\omega _1^{* 2}$ becomes increasingly dominant, with
 $\langle \lambda _2\omega _2^{* 2}\rangle \ll \langle \lambda _1\omega _1^{* 2}\rangle$ in the inertial range. It is also interesting to note that while the normalized average
 $\tilde {\tau }^3\langle \lambda _{(i)}\omega _i^{* 2}\rangle$ changes substantially for
 $i=2$ as
 $\ell _F$ is increased from the dissipation to inertial range scales, it varies weakly with
 $\ell _F$ for
 $i=1,3$. This is in agreement with the weakening of the preferential alignment between the vorticity and the intermediate strain-rate eigenvector as
 $\ell _F$ is increased, while the statistical alignment of
 $\boldsymbol {\omega }$ with
 $\boldsymbol {v}_1$ and
 $\boldsymbol {v}_3$ depends very weakly on the filtering length (Danish & Meneveau Reference Danish and Meneveau2018).
(a) Average and (b) variance of the terms in (4.2), normalized by the scale-dependent time scale  $\tilde {\tau }$, and plotted as a function of the filtering scale
 $\ell _F/\eta$. Different colours distinguish the various terms, while different line types and symbols refer to different components of those terms.

The alignment between the vorticity and the strain-rate eigenvectors is in part governed by the vorticity tilting term  $\varPi _{ij}^{*}\omega _j^{*}$. That term plays a central role in determining the preferential alignment between
 $\boldsymbol {\omega }$ and
 $\boldsymbol {v}_2$ in the RE system, through
 $\varPi _{ij}^{RE*}\omega _j^{*}$, (Dresselhaus & Tabor Reference Dresselhaus and Tabor1992; Nomura & Post Reference Nomura and Post1998) and also in real turbulent flows due to the dominance of local over non-local contributions to the vorticity tilting (Lawson & Dawson Reference Lawson and Dawson2015). The vorticity tilting does not directly affect the total enstrophy
 $\|\boldsymbol {\omega }\|^2$, but it does contribute to the dynamics of the individual contributions
 $\omega _i^{*2}$. In particular, the results in figure 2 indicate that on average
 $\varPi _{ij}^{*}\omega _j^{*}\omega _{(i)}^{*}$ tends to enhance
 $\omega _3^{*2}$ while reducing
 $\omega _1^{*2}$. Therefore, the tilting tends to oppose the stretching of vorticity along
 $\boldsymbol {v}_1$ and to oppose the compression of vorticity along
 $\boldsymbol {v}_3$. In this sense, on average,
 $\varPi _{ij}^{*}\omega _j^{*}\omega _{(i)}^{*}$ has opposing effects to
 $\lambda _{(i)}\omega _i^{*2}$ for
 $i=1,3$. The results also show that the vorticity tilting makes a small positive contribution to the growth of
 $\omega _2^{*2}$ on average.
The viscous term acts on average to reduce the magnitude of all the components of enstrophy, with its effect strongest on  $\omega _2^{* 2}$ and weakest on
 $\omega _3^{* 2}$. As expected, its average contribution markedly decreases with increasing filtering length as
 $\ell _F$ moves outside the dissipation range. The average sub-grid stress contribution to
 $D_t \omega _i^{*2}$ in (4.2) increases as
 $\ell _F$ is increased and becomes approximately constant in the inertial range when normalized by
 $\tilde {\tau }^3$, where its contribution becomes comparable in magnitude to the vortex-stretching terms
 $\lambda _i\omega _i^{*2}$,
 $i=2,3$. However, the sub-grid contribution is opposite in sign to the vortex-stretching contributions, tending to hinder
 $\omega _1^{*2}$ and
 $\omega _2^{*2}$ and to enhance
 $\omega _3^{*2}$.
The variances of the terms on the right-hand side of (4.2) are shown in figure 2(b). The variance of the vorticity tilting terms is very large, which indicates sudden rotations of the vorticity vector with respect to the eigenframe. Similar to the behaviour of the averages in figure 2(a), the results show that fluctuations in  $\lambda _i\omega _i^{* 2}$ are greatest for
 $i=1$, and the contribution from
 $i=2$ becomes much smaller than that from
 $i=1$ for
 $\ell _F$ in the inertial range. Most interestingly, we find that the sub-grid contributions for
 $i=1,2$ are very similar (almost identical in the inertial range), while the contribution for
 $i=3$ is much smaller, a feature preserved across the scales. This indicates that there is not a simple relationship between the sub-grid and vortex-stretching terms, which poses a challenge for large-eddy simulation modelling.
We have computed the moments in figures 1 and 2 across a range of Reynolds numbers (particular case of  $Re_{\lambda } = 224$ shown in appendix D) and obtained similar trends. This confirms that the statistics are converged and show that the moments depend weakly on the Reynolds number, at least in the range considered (
 $Re_{\lambda } \approx 200\text {--}600$). This is not too surprising given that these are normalized lower-order moments, but we would expect stronger Reynolds number effects for higher-order moments, due to intermittency.
4.2. Behaviour of eigenvalues and vorticity in the  $R$, $Q$ plane


The statistical behaviour in the  $R,Q$ plane, expressed in terms of the joint PDF of the invariants, is captured qualitatively by most of the models. The agreement between models and DNS is particularly good in closures based on tensor representations of the pressure Hessian in terms of the local velocity gradients squared (Wilczek & Meneveau Reference Wilczek and Meneveau2014) and closures which include multiscale energy transfer (Biferale et al. Reference Biferale, Chevillard, Meneveau and Toschi2007; Johnson & Meneveau Reference Johnson and Meneveau2017). However, the Gaussian closure underpredicts the probability along the left Vieillefosse tail, while it overestimates the probability of states along the right Vieillefosse tail and of vorticity-dominated states. Models based on the recent fluid deformation (RFD) hypotheses (Chevillard & Meneveau Reference Chevillard and Meneveau2006) considerably underestimate the probability of large values for
 $R,Q$. This issue also persists in more sophisticated closures in which the velocity field is supposed to be Gaussian at some time in the past (Johnson & Meneveau Reference Johnson and Meneveau2016) or in which multifractality of the gradient statistics is imposed (Pereira et al. Reference Pereira, Moriconi and Chevillard2018). To further our understanding of the eigenvalue and vorticity dynamics, we now show the average of the eigenvalues and eigenframe vorticity components in the phase space of the velocity gradient invariants.
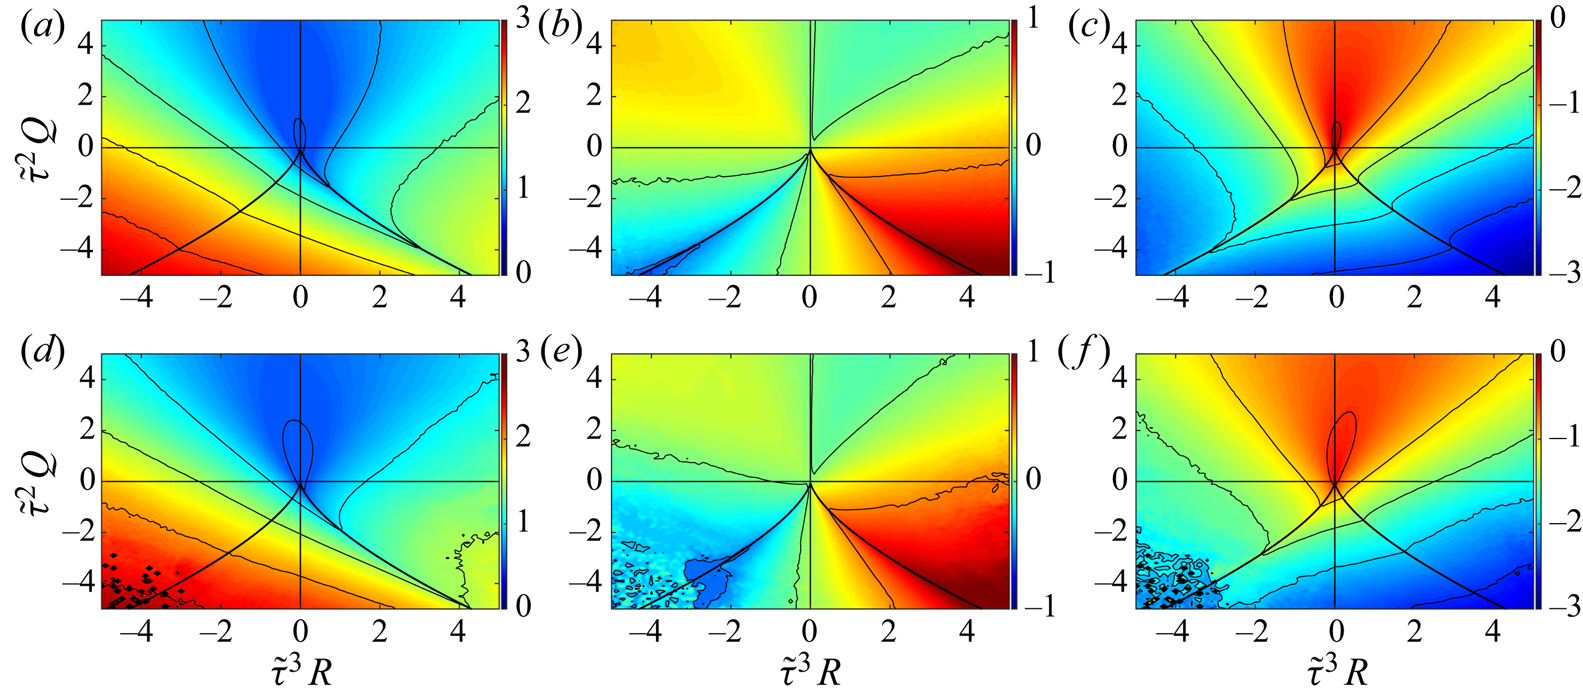
In figure 3, we show the average of the filtered strain-rate eigenvalues conditioned on the principal invariants of the filtered velocity gradient 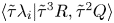 $\langle \tilde {\tau }\lambda _i| {\tilde {\tau }}^3 R, {\tilde {\tau }}^2 Q\rangle$, where
 $R=-\textrm {Tr}(\boldsymbol {A}^3)/3$ and
 $Q=-\textrm {Tr}(\boldsymbol {A}^2)/2$. The colour map is in a linear scale, and the results refer to the filtering lengths
 $\ell _F/\eta =7.0$ and
 $\ell _F/\eta =67.3$. The colour bar range has been truncated in order to highlight the trend of the variables around the most probable values. The results show that
 $\left \langle \lambda _2|R,Q\right \rangle$ is relatively large and positive along the right Vieillefosse tail compared to its value in other regions of the phase space. Since the joint PDF of
 $R,Q$ is large along the right Vieillefosse tail (Chong et al. Reference Chong, Soria, Perry, Chacin, Cantwell and Na1998; Lüthi, Holzner & Tsinober Reference Lüthi, Holzner and Tsinober2009; Elsinga & Marusic Reference Elsinga and Marusic2010; Meneveau Reference Meneveau2011) then that phase space region contributes strongly to the tendency for
 $\lambda _2$ to be positive, with
 $\left \langle \lambda _2\right \rangle >0$. In contrast,
 $\left \langle \lambda _1 | R,Q\right \rangle$ is relatively small along the right Vieillefosse tail as compared to the larger value it takes along the left Vieillefosse tail, where
 $R<0$, corresponding to states of biaxial compression with
 $\lambda _2<0$. The most compressional eigenvalue
 $\left \langle \lambda _3|R,Q\right \rangle$ tends to have relatively small magnitudes in the vortex-stretching quadrant (
 $Q>0$ and
 $R<0$), compared to values it takes on other regions of the
 $R,Q$ plane. On the other hand,
 $\left \langle \lambda _2|R,Q\right \rangle$ is positive on average here, showing that it contributes to the stretching of vorticity along the direction
 $\boldsymbol {v}_2$ in this quadrant.
Average of the filtered strain-rate eigenvalues conditioned on the second and third principal invariants of the filtered velocity gradient tensor. Panels (a–c) show conditional averages 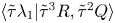 $\langle \tilde {\tau }\lambda _{1}|{\tilde {\tau }}^3 R, {\tilde {\tau }}^2 Q\rangle$,
 $\langle \tilde {\tau }\lambda _{2}|{\tilde {\tau }}^3 R, {\tilde {\tau }}^2 Q\rangle$ and
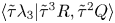 $\langle \tilde {\tau }\lambda _{3}|{\tilde {\tau }}^3 R, {\tilde {\tau }}^2 Q\rangle$, respectively, for
 $\ell _F/\eta =7.0$ and (d–f) show the corresponding quantities for
 $\ell _F/\eta =67.3$. The colour map is in linear scale, and the thick black lines represent the Vieillefosse tails. Note that average values greater/smaller than the largest/smallest value in the colour bar are clipped to the colour corresponding to largest/smallest value in the colour bar.

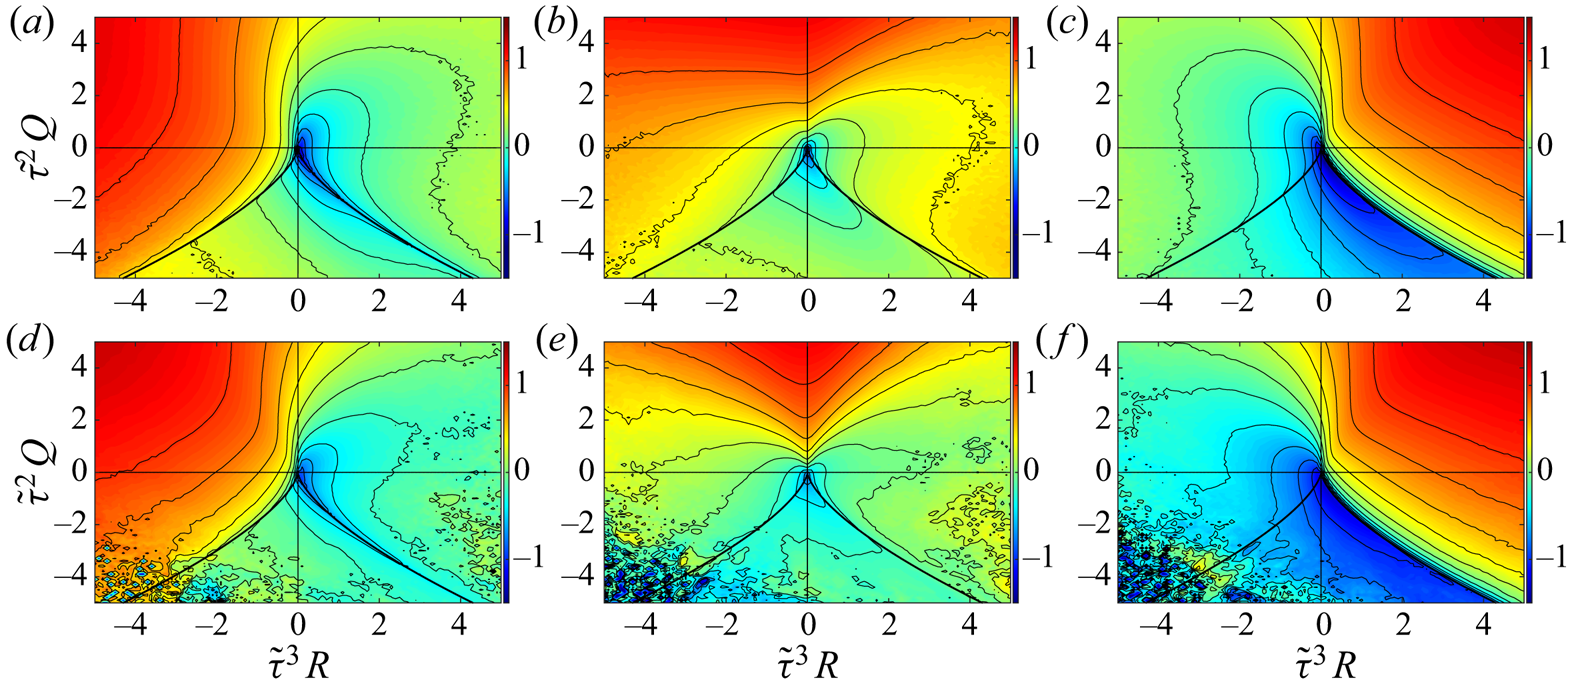
In figure 4, we show the results for  $\left \langle (\tilde {\tau }\omega _i^{*})^2|{\tilde {\tau }}^3 R, {\tilde {\tau }}^2 Q\right \rangle$, for the same filtering lengths
 $\ell _F/\eta =7.0$ and
 $\ell _F/\eta =67.3$. The quantity
 $\omega _i^{*2}$ rather than
 $\omega _i^{*}$ has been employed to remove the ambiguity of the sign of
 $\omega _i^{*}$ that was discussed earlier, and the colour map is in logarithmic scale. The quantity
 $\left \langle \omega _2^{*2}|R,Q\right \rangle$ is large over a wide region of the upper plane
 $Q>0$ where rotational motion dominates the velocity gradients. It also takes relatively large values close to the right Vieillefosse tail, compared to the values that the other vorticity components take in that region. The results for
 $\left \langle \omega _3^{*2}|R,Q\right \rangle$ indicate that the vorticity component along
 $\boldsymbol {v}_3$ is smaller below and in the proximity of the right Vieillefosse tail compared to other regions of the phase space and is associated with the misalignment between
 $\boldsymbol {\omega }$ and
 $\boldsymbol {v}_3$ in that region of the
 $R,Q$ plane (Carbone et al. Reference Carbone, Iovieno and Bragg2020). This can be related to the compression along the vorticity axis that arises due to incompressibility of the flow, described by the second term on the right-hand side of (2.10b) together with the local pressure Hessian contribution. Since this term is non-negative, then it acts to suppress the growth of the compressional eigenvalue
 $\lambda _3$. However, if the vorticity was perfectly aligned with
 $\boldsymbol {v}_3$ then this term would vanish. Therefore, misalignment of the vorticity with
 $\boldsymbol {v}_3$ stabilizes the system by providing a mechanism to prevent the blow-up of
 $\lambda _3$ along the right Vieillefosse tail. The relatively large value of
 $\left \langle \omega _3^{*2}|R,Q\right \rangle$ observed in the quadrant
 $R>0$ and
 $Q>0$ compared to other quadrants is expected, since this is the quadrant associated with vortex compression (Tsinober Reference Tsinober2001).
Average of the square of the vorticity components conditioned on the second and third principal invariants of the filtered velocity gradient tensor. Panels (a–c) show conditional averages  $\left \langle (\tilde {\tau }\omega _1^{*})^2|{\tilde {\tau }}^3 R, {\tilde {\tau }}^2 Q\right \rangle$,
 $\left \langle (\tilde {\tau }\omega _2^{*})^2|{\tilde {\tau }}^3 R, {\tilde {\tau }}^2 Q\right \rangle$ and
 $\left \langle (\tilde {\tau }\omega _3^{*})^2|{\tilde {\tau }}^3 R, {\tilde {\tau }}^2 Q\right \rangle$, respectively, for
 $\ell _F/\eta =7.0$ and (d–f) show the corresponding quantities at
 $\ell _F/\eta =67.3$. The colour map is in
 $\log _{10}$ scale and the thick black lines represent the Vieillefosse tails. Note that average values greater/smaller than the largest/smallest value in the colour bar are clipped to the colour corresponding to largest/smallest value in the colour bar.

The conditional averages shown in figures 3 and 4 confirm that, qualitatively, the statistics are weakly dependent on the filtering length scale, as observed for the probability density flux in the  $R,Q$ plane (Danish & Meneveau Reference Danish and Meneveau2018). One exception is the behaviour of
 $\omega _2^{*}$, for which comparing figures 4(b) and 4(e) reveals significant qualitative changes in the behaviour of
 $\left \langle \omega _2^{*2}|R,Q\right \rangle$ as
 $\ell _F$ is increased.
4.3. Rotation of the strain-rate eigenframe and tilting of the vorticity vector
The tilting of the vorticity vector with respect to the strain-rate eigenframe plays a central role in determining the geometric alignments of the strain rate and vorticity, and the rotation rate of the eigenframe can take on very large values even in simple flows (Dresselhaus & Tabor Reference Dresselhaus and Tabor1992). This rotation rate is determined by the interaction between vorticity, pressure gradient and viscous and sub-grid forces, and (2.10c) suggests that the rotation can be very strong when the differences between the strain-rate eigenvalues becomes small. To understand this better, and the effect of filtering on these processes, we now turn to analyse in detail the statistics of the rotation rate of the eigenframe and its dependence upon the local state of the velocity gradient.
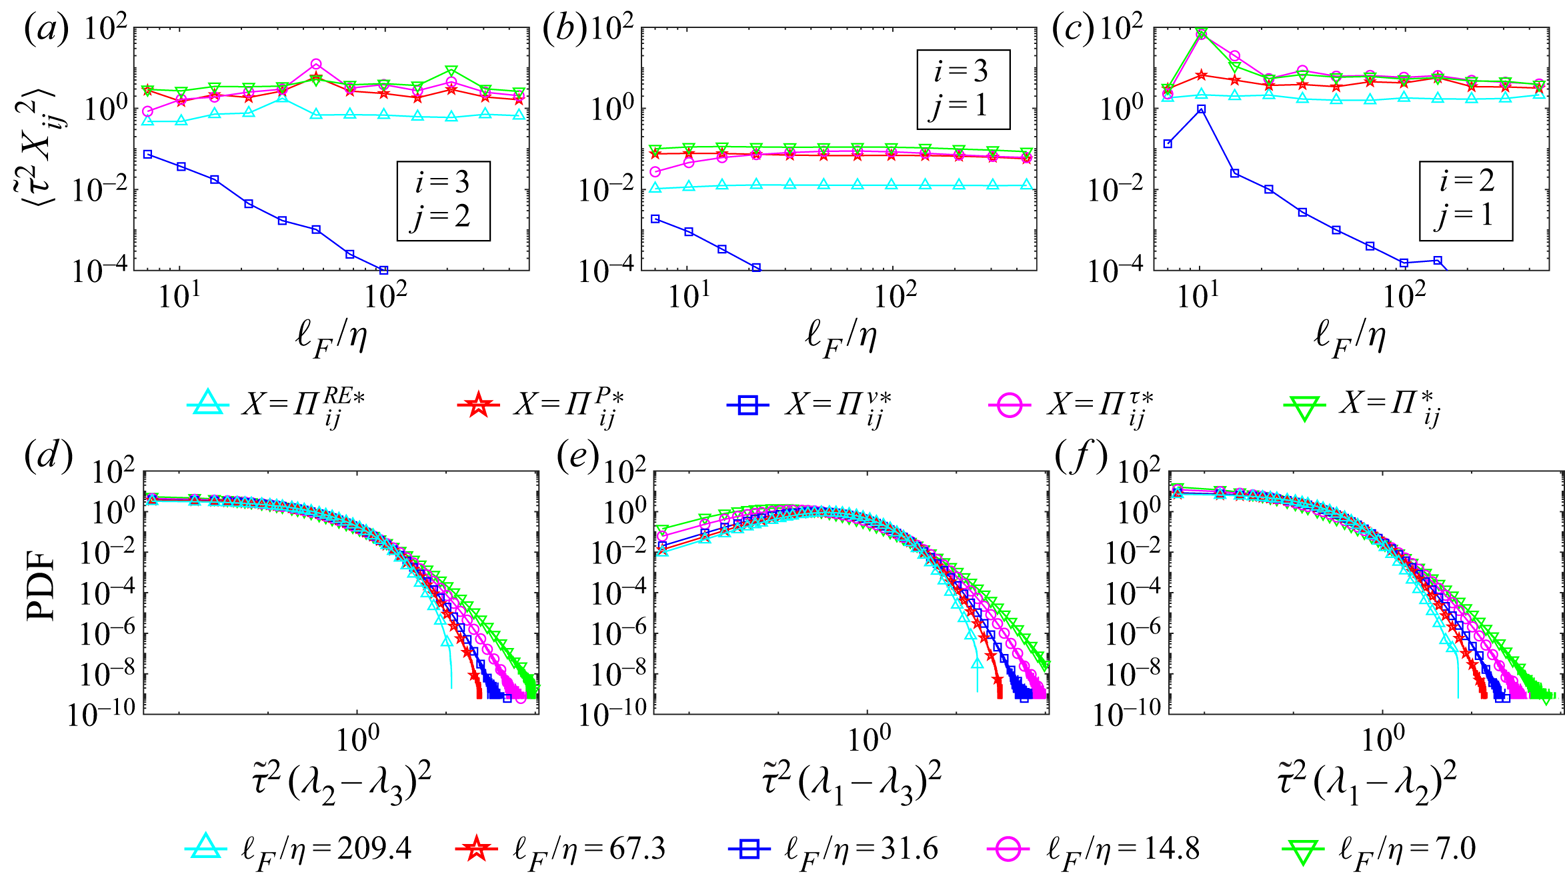
Figure 5(a–c) shows the second moment of the different contributions to the eigenframe rotation rate  $\varPi _{ij}^*$ (see (2.14)), and figure 5(d–f) shows the PDF of the square of the difference in the eigenvalues, which represents the resistance of the eigenframe (Vieillefosse Reference Vieillefosse1982). While the local contributions (captured by the RE model) to the eigenframe rotation rate have been investigated in detail (Dresselhaus & Tabor Reference Dresselhaus and Tabor1992), together with its impact on the vorticity dynamics, the non-local contributions have received less attention. The second moment of the pressure Hessian contribution is close to the second moment of the overall rotation rate and they are almost independent of the filtering length (when normalized by
 $\tilde {\tau }$). This indicates that the non-local effects on the rotation rate of the eigenframe dominate over the contribution from vorticity that features in the RE model. However, we will observe that the local RE term plays a leading role in the tilting of the vorticity vector. The sub-grid stress also gives an important contribution to the eigenframe rotation rate, especially at large scales. On the other hand, the viscous contribution is small with
 $\left \langle (\tilde {\tau } \varPi _{ij}^{\nu *})^2 \right \rangle$ decreasing as
 $\ell _F^{-\xi }$, with
 $\xi$ between 2 and 3. The component
 $\left \langle (\tilde {\tau } \varPi _{31}^{*})^2 \right \rangle$, associated with the angular velocity of the eigenframe along
 $\boldsymbol {v}_2$, is much smaller than the other components. If we consider the PDFs of
 $(\lambda _j-\lambda _i)^2$ in figure 5(d–f) we see that the mode of the random variable is considerably larger for
 $(\lambda _1-\lambda _3)^2$ than for the other cases. The reason for this is that due to incompressibility,
 $(\lambda _1-\lambda _3)^2\to 0$ also implies
 $\lambda _2\to 0$, and the probability of states with strain rate almost zero is vanishingly small. As a result, the average values of
 $(\lambda _1-\lambda _3)^2$ are larger than for
 $(\lambda _2-\lambda _3)^2$ or
 $(\lambda _1-\lambda _2)^2$, implying on average an increased resistance to rotations of the eigenframe about
 $\boldsymbol {v}_2$, and hence to
 $\left \langle (\tilde {\tau } \varPi _{31}^{*})^2 \right \rangle$ being smaller than the other components.
(a–c) Second moment of the components of the RE, pressure, viscous and sub-grid contributions to the strain-rate eigenframe rotation rate, together with the overall rotation rate. (d–f) The PDF of the square of the differences in the eigenvalues, which appear in the equation for the rotation rate of the eigenframe (2.10c).

The results in figure 5(d–f) also indicate that the probability of axisymmetric states with  $\lambda _2\approx \lambda _1$ and
 $\lambda _2\approx \lambda _3$ is quite high, with the probability of observing
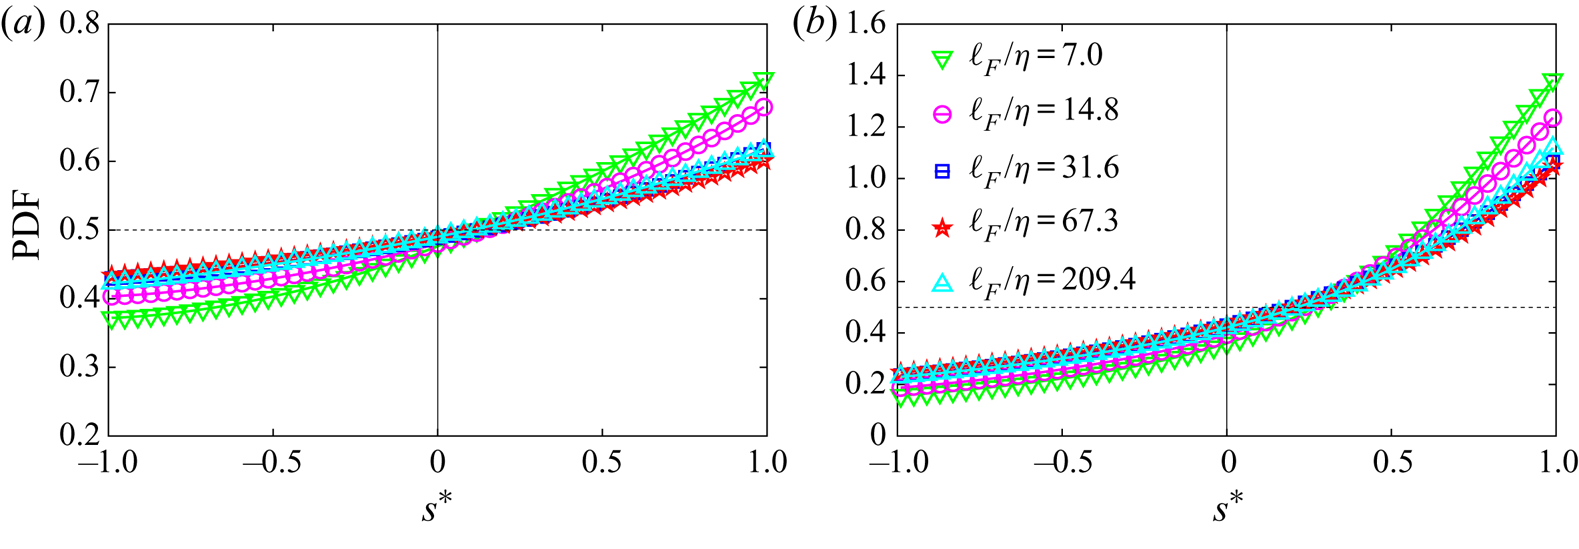
 $\lambda _2\approx \lambda _1$ larger, in agreement with previous results that showed that axisymmetric extension occurs more often than axisymmetric compression (Lund & Rogers Reference Lund and Rogers1994; Meneveau Reference Meneveau2011). However, the probability to observe
 $\tilde {\tau }(\lambda _2-\lambda _3)\to 0$ is only three times smaller than that for observing
 $\tilde {\tau }(\lambda _2-\lambda _1)\to 0$. A more accurate estimation of the relative occurrence rates of axisymmetric compression and expansion can be achieved by means of a dimensionless parameter (Lund & Rogers Reference Lund and Rogers1994) as discussed in § 4.4.2. The main effect of filtering on these PDFs is to simply suppress the tails, associated with reduced intermittency at larger scales. However, for the PDF of
 $(\lambda _1-\lambda _3)^2$, there is also a significant effect of filtering on the behaviour for
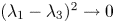 $(\lambda _1-\lambda _3)^2\to 0$, with the probability of states with
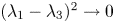 $(\lambda _1-\lambda _3)^2\to 0$ decreasing as
 $\ell _F$ is increased.
The quantity  $\lambda _j-\lambda _i$ acts as a weight in (2.10c), and the behaviour of
 $\varPi _{ij}^{*}$ depends on how the various contributions to
 $\varPi _{ij}^{*}$ on the right-hand side of (2.10c) behave as
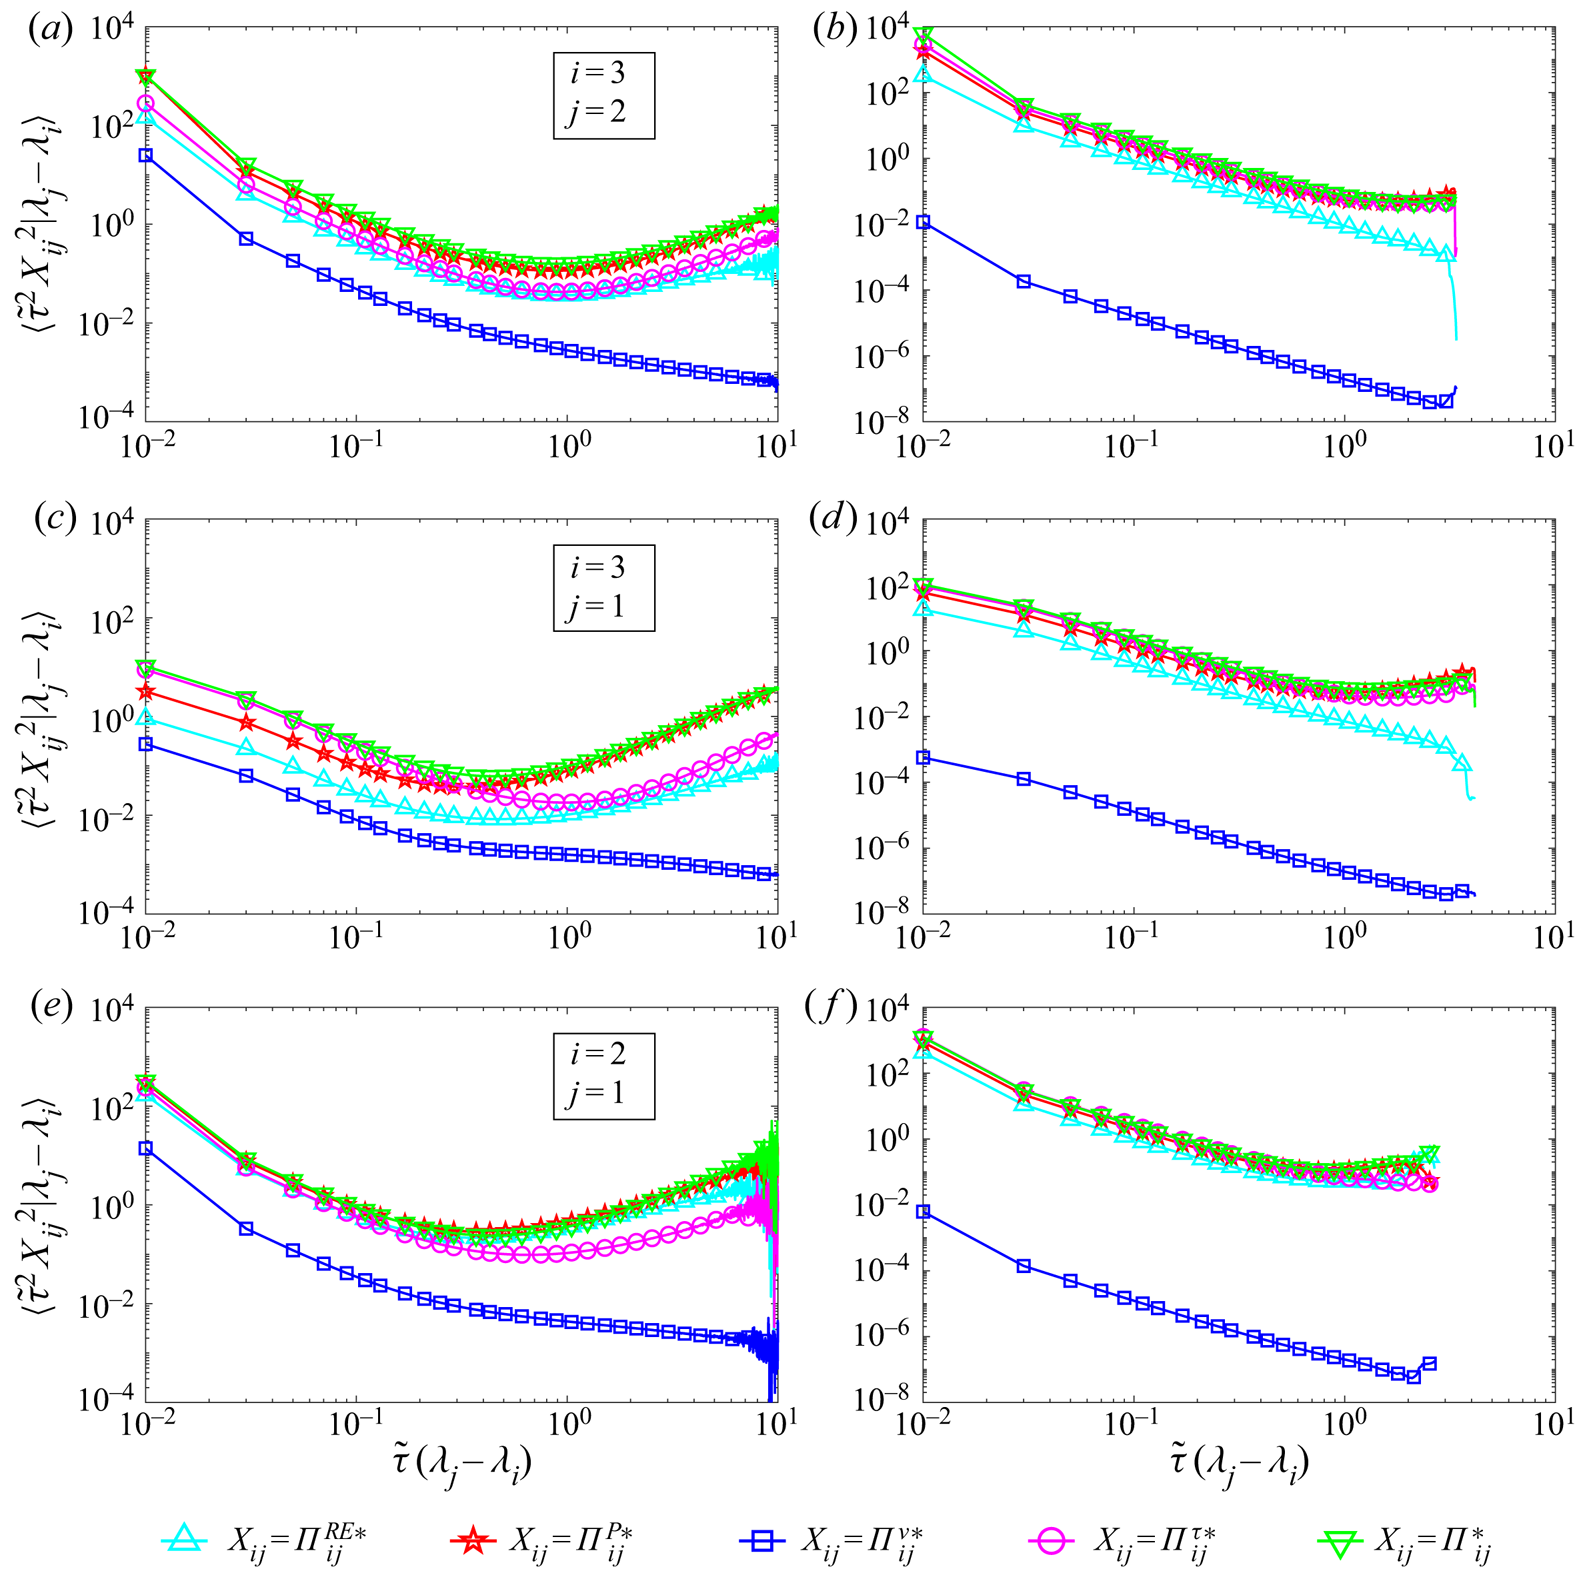
 $\lambda _j-\lambda _i$ varies. To explore this, in figure 6 we show results for
 $\left \langle X _{ij}^2\vert \lambda _j-\lambda _i \right \rangle$, with
 $i>j$ such that
 $\lambda _j-\lambda _i > 0$, where
 $X_{ij}$ is either the eigenframe rotation rate
 $\varPi _{ij}^*$ or else one of the distinct contributions to
 $\varPi _{ij}^*$, namely
 $\varPi ^{RE*}_{ij}, \varPi ^{P*}_{ij}, \varPi ^{\nu *}_{ij} or \varPi ^{\tau *}_{ij}$ (see (2.14)). The results show that
 $\left \langle X _{ij}^2\vert \lambda _j-\lambda _i \right \rangle \propto (\lambda _j-\lambda _i)^{-2}$ for small
 $\tilde {\tau }(\lambda _j-\lambda _i)$, indicating a weak correlation between
 $(\lambda _j-\lambda _i)$ and the vorticity, pressure Hessian, sub-grid stress and viscous stress in this range. However, for
 $\tilde {\tau }(\lambda _j-\lambda _i)\geq O(1)$,
 $\left \langle X ^2\vert \lambda _j-\lambda _i \right \rangle$ starts to increase for some of the cases. This non-monotonic behaviour is quite intriguing, but the increase cannot persist in the limit
 $\tilde {\tau }(\lambda _j-\lambda _i)\to \infty$ if the flow field is to remain regular. Also, the results show that the increase at
 $\tilde {\tau }(\lambda _j-\lambda _i)\geq O(1)$ becomes less apparent as the filter length is increased. For the smallest filter scales, the results in figure 6 show that the dominant contribution to the eigenframe rotation-rate comes from the pressure Hessian, with important contributions from the sub-grid stress and RE term associated with vorticity in some cases (e.g. especially for
 $i=2,j=1$). At larger scales, however, the sub-grid term makes a strong contribution, similar in size to that from the pressure Hessian with the RE playing a smaller role. The viscous contribution is small at all scales and for all components.
Second moment of the contributions to the eigenframe rotation rate conditioned on the difference in the eigenvalues. Panels (a,c,e) correspond to  $\ell _F/\eta = 7.0$ and (b,d,f) to
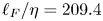 $\ell _F/\eta = 209.4$.

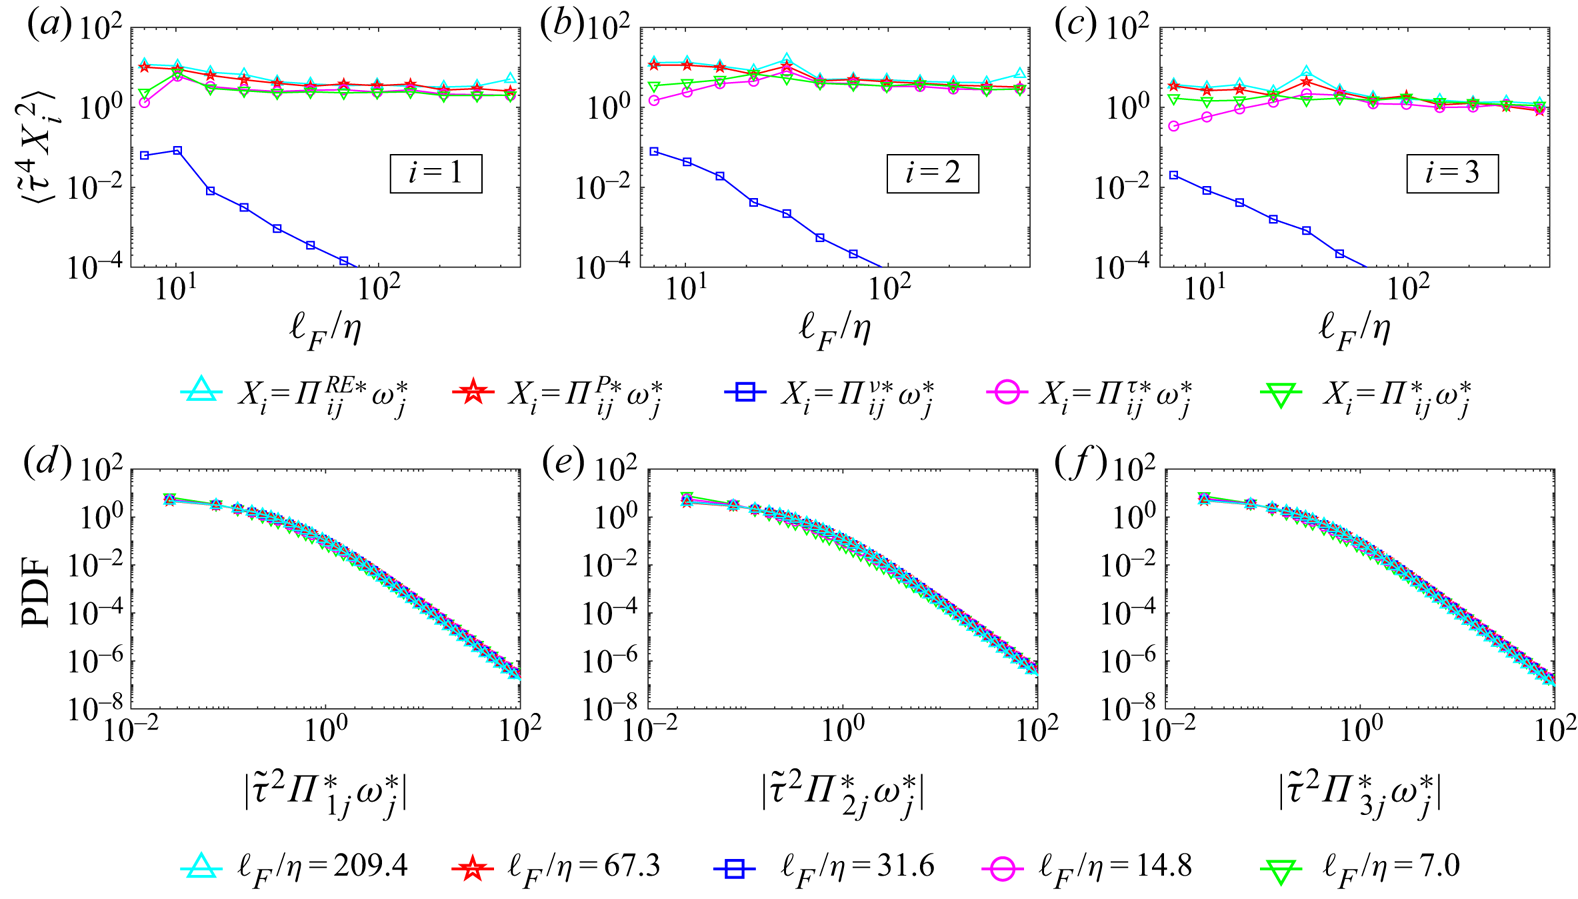
The rotation rate of the eigenframe plays an important role in the vorticity dynamics through the vortex tilting mechanism, described by the term  $\varPi _{ij}^{*}\omega _j^{*}$ in (2.12). The second moment of
 $\varPi _{ij}^{*}\omega _j^{*}$ and the various contributions to it are shown in figure 7(a–c) together with the PDFs of
 $|\varPi _{ij}^{*}\omega _j^{*}|$ in figure 7(d–f). The RE and pressure Hessian contributions to
 $\langle (\varPi _{ij}^{*}\omega _j^{*})^2\rangle$ are the largest and are similar in size, showing that the local (i.e. that captured by the RE model) and non-local contributions to
 $\langle (\varPi _{ij}^{*}\omega _j^{*})^2\rangle$ are similar. The reason why the RE term makes a significant contribution to the vorticity tilting that is similar to that of the pressure Hessian, despite the fact that the former gives a much smaller contribution to the eigenframe rotation rate, could be related to the weak preferential alignment between the vorticity and the pressure Hessian (Carbone et al. Reference Carbone, Iovieno and Bragg2020). The viscous contribution is small over the range of
 $\ell _F$ considered, with
 $\langle (\tilde {\tau }\varPi _{ij}^{\nu *}\omega _j^{*})^2\rangle$ decreasing as
 $\ell _F^{-\xi }$, with
 $\xi$ between 2 and 3. The vorticity tilting about axis
 $\boldsymbol {v}_2$ is slightly larger than the tilting about the other two axes, in contrast to the reduced eigenframe rotation rate about axis
 $\boldsymbol {v}_2$ shown in figure 5. However, the difference between the components of
 $\langle (\varPi _{ij}^{*}\omega _j^{*})^2\rangle$ is smaller than the difference between the components of
 $\langle (\varPi _{ij}^{*})^2\rangle$ shown in figure 5.
(a–c) Second moment of the RE, pressure, viscous and sub-grid contributions to the vorticity tilting term, together with the second moment of the total vorticity tilting term. (d–f) The PDF of the vorticity tilting term in (2.12).

The PDFs of  $|\varPi _{ij}^{*}\omega _j^{*}|$ are shown in figure 7(d–f), revealing wide power-law tails and large values of vorticity tilting. Quite remarkably, the PDFs are almost insensitive to the filtering scale
 $\ell _F$, such that very strong vorticity tilting resulting in highly non-Gaussian behaviour is a feature that persists beyond just the dissipation range. This intermittent behaviour, however, is probably kinematic rather than purely dynamical in origin. In particular, (2.10c) shows that
 $\varPi _{ij}^{*}$ depends on
 $(\lambda _j-\lambda _i)^{-1}$, such that small values of
 $\tilde {\tau }(\lambda _j-\lambda _i)$, which occur with high probability, can lead to large values of
 $\tilde {\tau }^2\varPi _{ij}^{*} \omega _j^{*}$.
A peculiar situation to consider is when two eigenvalues intersect ( $\lambda _i = \lambda _j$), which may result in a very large rotation rate of the eigenvectors. Indeed, in that situation, the directions of two of the strain-rate eigenvectors associated with the coincident eigenvalues are not well defined. All vectors belonging to the plane orthogonal to the eigenvector associated with the other (distinct) eigenvalues are strain-rate eigenvectors. Therefore, the orientation of those eigenvalues can be chosen on the plane orthogonal to the eigenvector associated with the other (distinct) eigenvalues and there is some arbitrariness in the projection of the equations for the gradient into the eigenframe. In the simple RE system, the eigenvalues cannot intersect and the components of the vorticity in the strain-rate eigenframe cannot change sign. This is due to the several conservation laws in the RE system, in particular the determinant of the commutator between the symmetric and anti-symmetric parts of the velocity gradient is a first integral of the RE system (Vieillefosse Reference Vieillefosse1982). The pressure Hessian and viscous stress are key to weakening those constraints and reducing the number of first integrals thus avoiding finite-time singularities. Although our results in figure 5(d–f) show significant probability for
 $(\lambda _i-\lambda _j)\to 0$, we cannot provide conclusive evidence that eigenvalues can intersect. For this, we would need to track the non-ordered eigenvalues of fluid particles in the Lagrangian frame and look for evidence that their ordering changes along the trajectory. This interesting problem is left for future investigations.
4.4. Characterizing the pressure Hessian
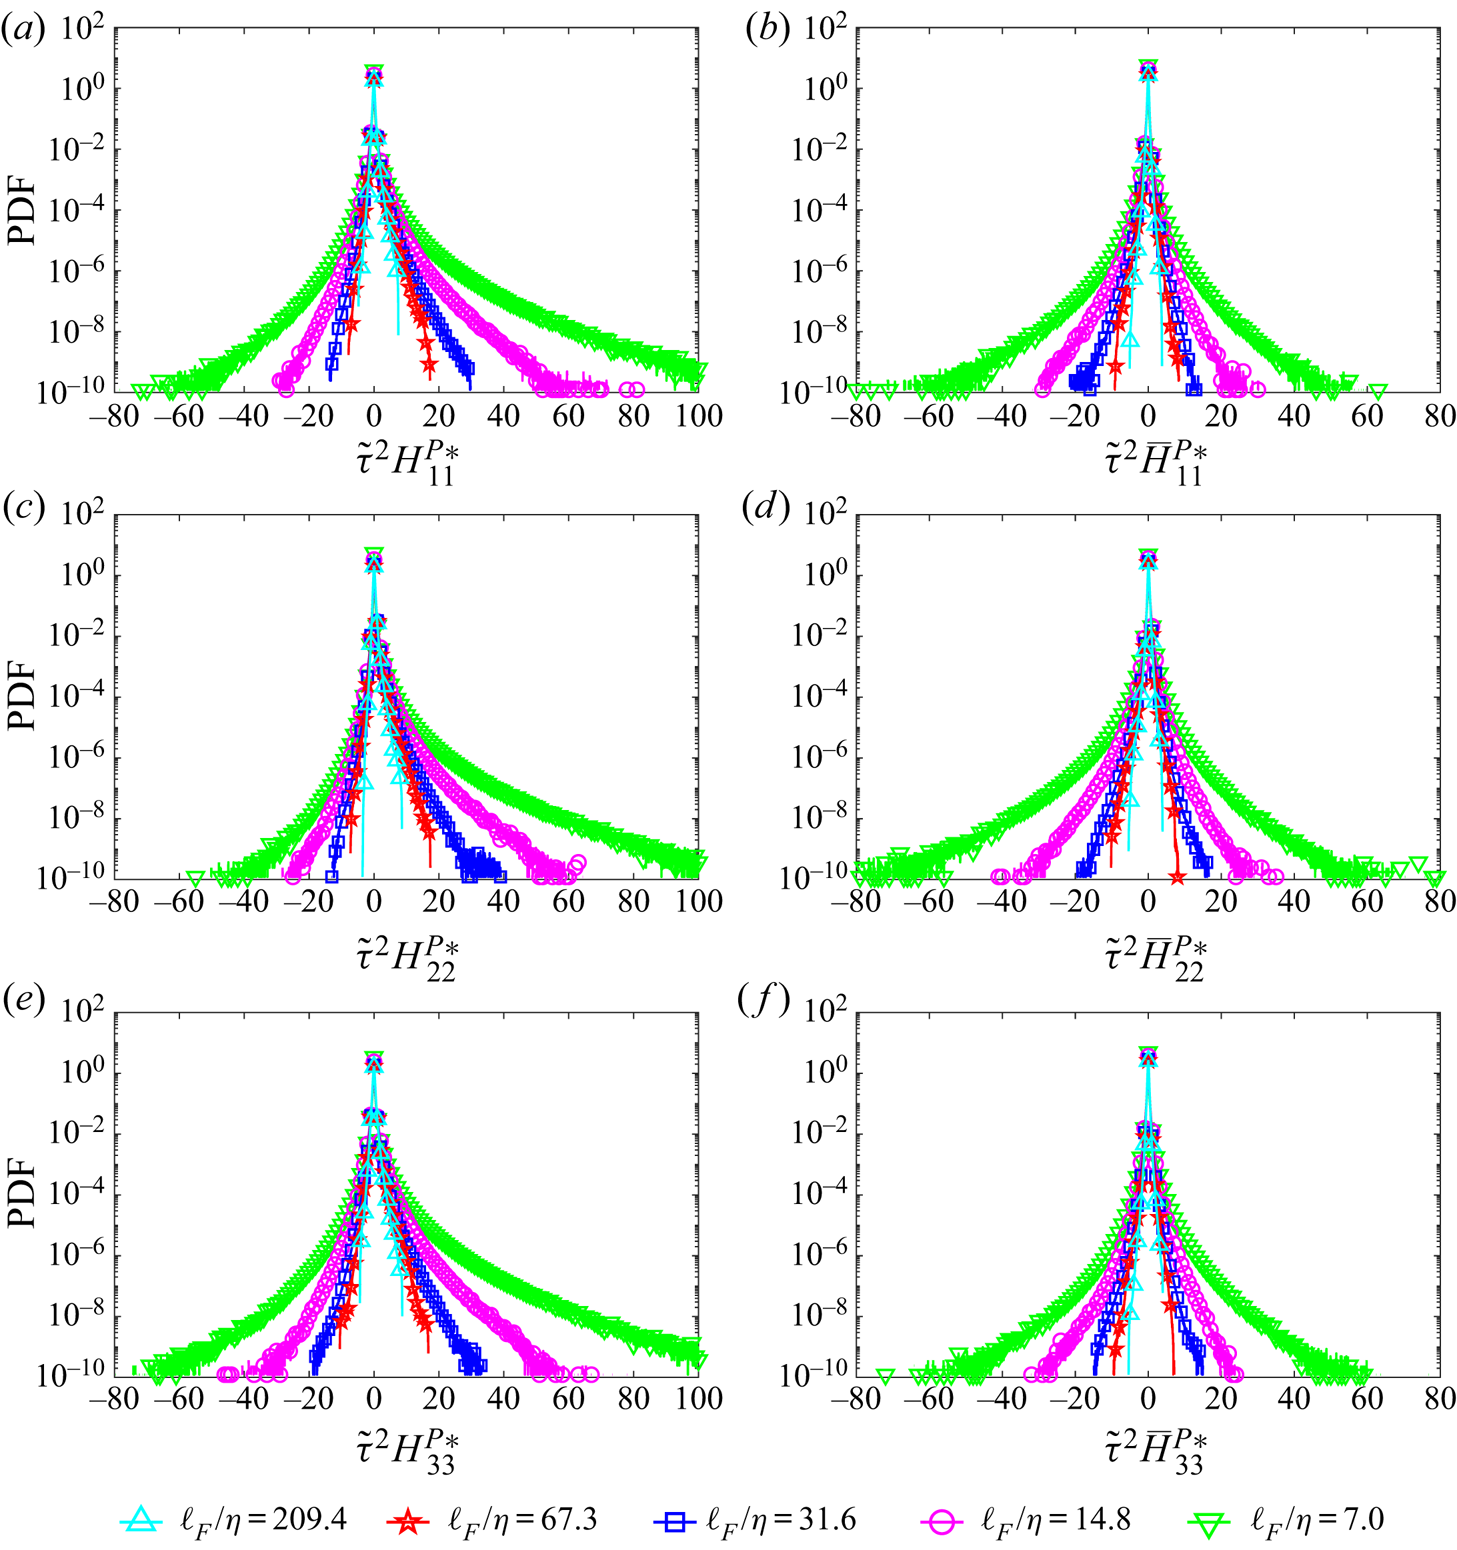
In figure 8(a,c,e) we show the PDFs of the diagonal components of the pressure Hessian in the eigenframe, filtered at various scales. The PDFs show wide tails for the smallest filtering lengths  $\ell _F$, consistent with the observation of highly intermittent acceleration statistics in turbulence (Ayyalasomayajula, Warhaft & Collins Reference Ayyalasomayajula, Warhaft and Collins2008), but the extreme events become much rarer as
 $\ell _F$ is increased, with the PDFs approaching a Gaussian shape at the largest scales. The PDFs are also strongly positively skewed, with the skewness decreasing as
 $\ell _F$ is increased. The local/isotropic part of the unfiltered pressure Hessian is proportional to the second unfiltered invariant
 \begin{equation} Q=\|\boldsymbol{\omega}\|^2/4 - \|\boldsymbol{S}\|^2/2, \end{equation}
and since the PDF of  $Q$ is positively skewed (Meneveau Reference Meneveau2011), so also will be the PDF of the local part of the pressure Hessian. The dependence of the non-local contribution to the pressure Hessian on the local properties of
 $Q$ is more complicated. However, we note that during large events where
 $Q\gg \tau _{\eta }^2$, the local part of the pressure Hessian is expected to dominate over the non-local part (see below), since extreme events in
 $Q$ are spatially localized. For the filtered fields, there is an additional contribution to the isotropic part of the filtered pressure Hessian since
 $\textrm{Tr}(\widetilde{{\boldsymbol{H}^P}}+\widetilde{{\boldsymbol{A}}}^2 + {\boldsymbol{H}}^\tau)=0$.
The PDF of the diagonal components of the pressure Hessian in the eigenframe normalized using scale-dependent time scale  $\tilde {\tau }$. Panels (a,c,e) show results for the full pressure Hessian, and (b,d,f) are for the anisotropic part of the pressure Hessian.

4.4.1. Characterizing the anisotropic pressure Hessian
The anisotropic pressure Hessian is defined as
 \begin{equation} \overline{H}_{ij}^{{{{P}*}}} \equiv H_{ij}^{P*} - \tfrac{1}{3}H_{kk}^{P*}\delta_{ij} \end{equation}
and the PDFs of the diagonal components  $\overline{H}_{i(i)}^{{{{P}*}}}$ are shown in figure 8(b,d,f), for various
 $\ell _F$. Comparing these results to those in figure 8(a,c,e) reveals that the strong positive skewness of the PDF of the full pressure Hessian arises from the dominating contribution of the local pressure Hessian during large events. Indeed, the PDF of
 $\overline{H}_{22}^{{{{P}*}}}$ is negatively skewed, indicating that the strongest fluctuations in
 $\overline{H}_{22}^{{{{P}*}}}$ tend to help the growth of
 $\lambda _2$ (since
 $H_{i(i)}^{P *}$ appears with a minus sign in (2.10b)) and hence also vortex stretching. This is in contrast with the average negative value of
 $-H_{22}^{P*}$ observed in figure 1.
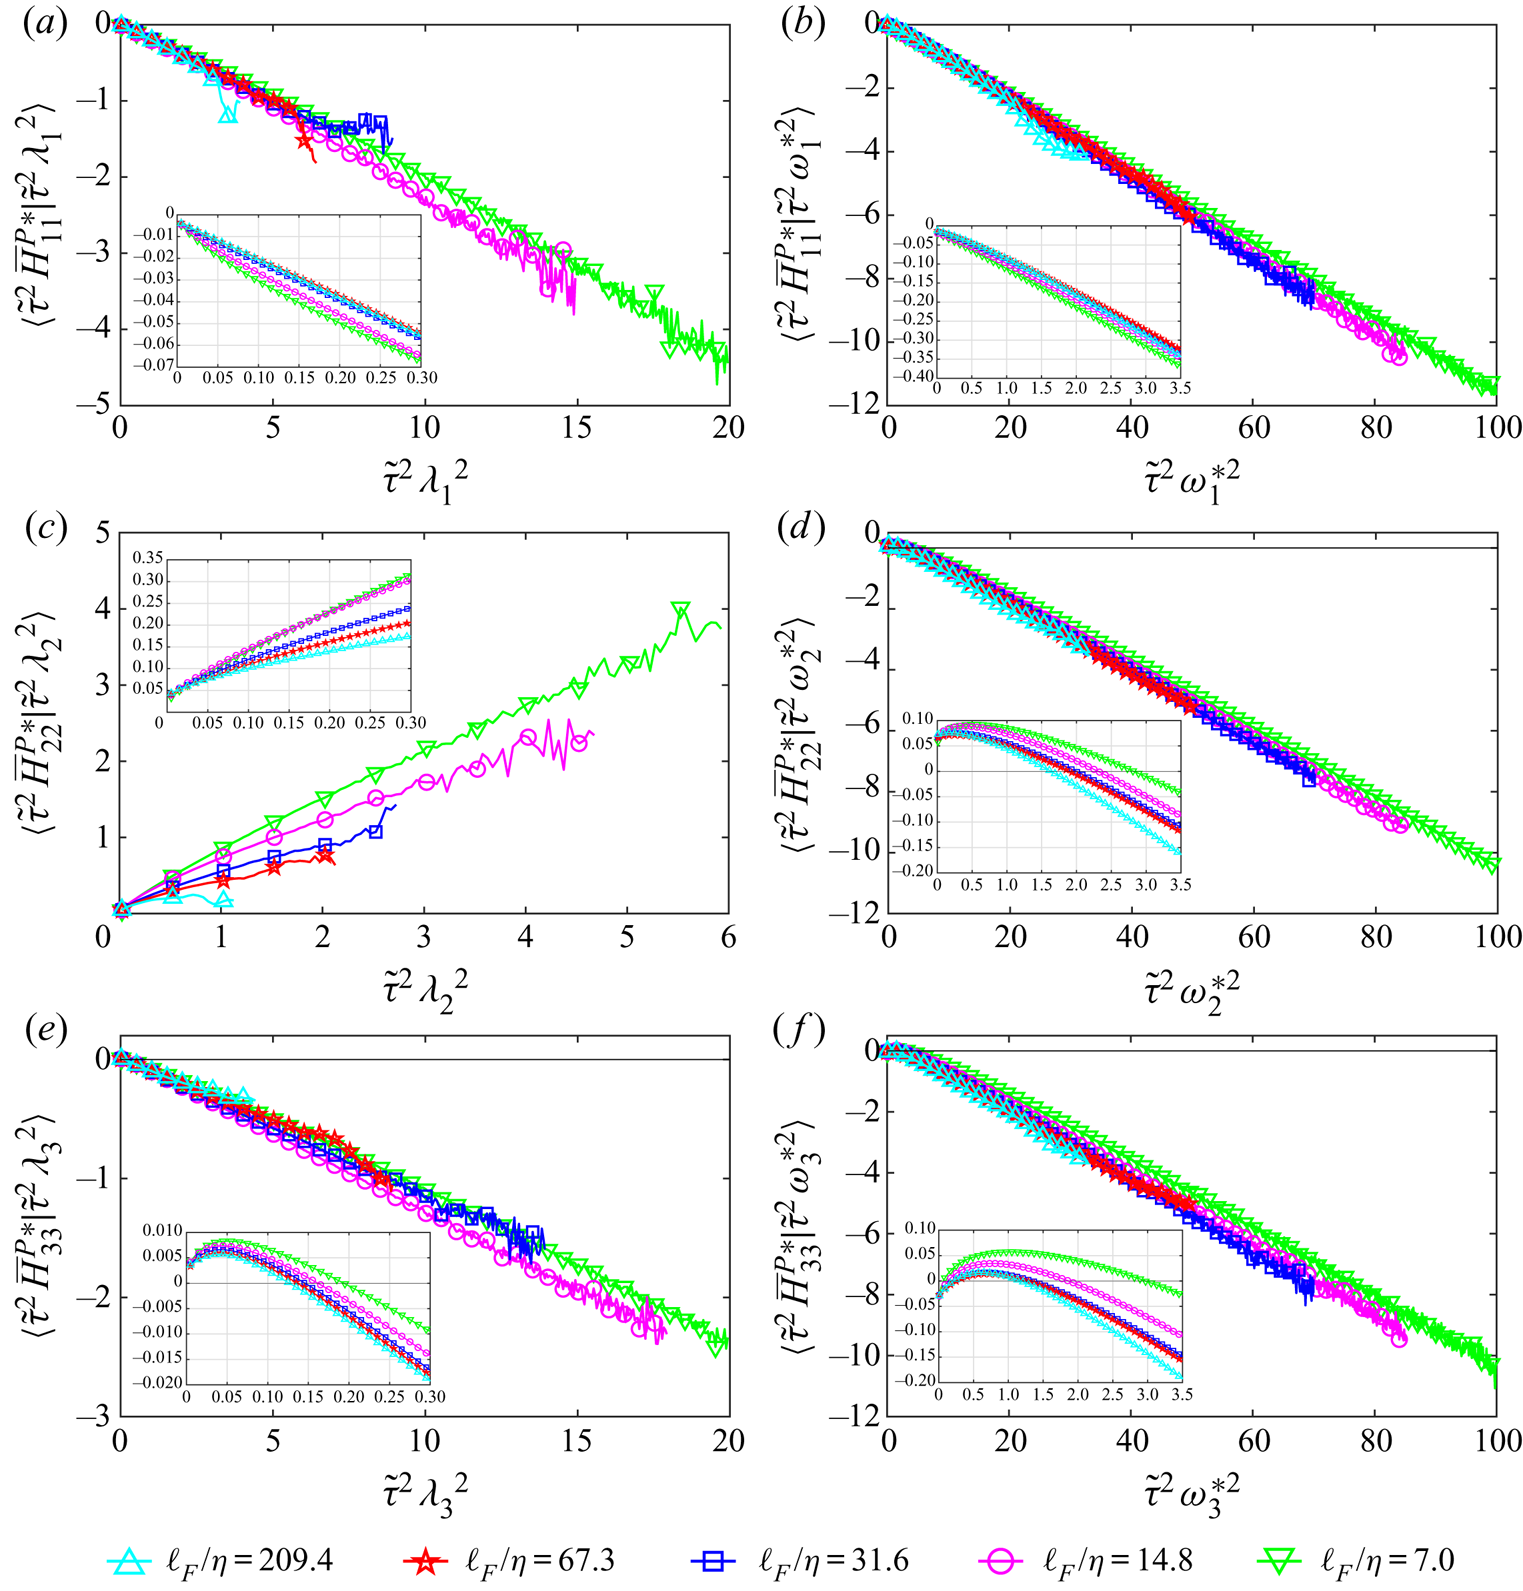
In order to understand more fully the relationship between  ${\overline{H}_{i(i)}^{{{{P}*}}}}$ and the local properties of the flow, in figure 9(a,c,e), we consider the results for
 $\langle \overline{H}_{i(i)}^{{{{P}*}}}|\lambda _i^2\rangle$ as a function of the filtering scale. For
 $i=1$, this quantity is always negative, and since the pressure Hessian appears with a negative sign in front of it in the eigenvalue equation (2.10b), this indicates that on average
 $\overline{H}_{11}^{{{{P}*}}}$ acts to amplify
 $\lambda _1$, for all values of
 $\lambda _1^2$. For
 $\tilde {\tau }\lambda _1\leq O(1)$,
 $\langle \overline{H}_{11}^{{{{P}*}}}|\lambda _1^2\rangle$ becomes increasingly negative with increasing
 $\lambda _1^2$, varying almost linearly with
 $\lambda _1^2$. The contribution to
 $\lambda _2$, namely
 $\langle \overline{H}_{22}^{{{{P}*}}}|\lambda _2^2\rangle$, is always positive and therefore on average
 $\overline{H}_{22}^{{{{P}*}}}$ hinders the growth of positive
 $\lambda _2$ for all values of
 $\lambda _2^2$. Furthermore, for
 $\tilde {\tau }|\lambda _2| \leq O(1)$,
 $\langle \overline{H}_{22}^{{{{P}*}}}|\lambda _2^2\rangle$ increases almost linearly with increasing
 $\lambda _2^2$ except for the larger filter scales, for which a nonlinear behaviour is apparent even for
 $\tilde {\tau }|\lambda _2|\ll 1$. The behaviour of
 $\langle \overline{H}_{33}^{{{{P}*}}}|\lambda _3^2 \rangle$ is quite peculiar, showing that on average
 $\overline{H}_{33}^{{{{P}*}}}$ amplifies
 $\lambda _3$ (increases
 $|\lambda _3|$) for very small
 $\tilde {\tau }\lambda _3$, but then hinders its growth outside of this regime. The range of
 $\tilde {\tau }\lambda _3$ over which
 $\overline{H}_{33}^{{{{P}*}}}$ amplifies
 $\lambda _3$ on average decreases with increasing filter scale.
Average of the diagonal components of the anisotropic pressure Hessian in the eigenframe conditioned on (a,c,e) the corresponding eigenvalues squared, and (b,d,f) the corresponding vorticity components squared. Insets highlight the results for small values of  $\tilde {\tau }^2 {\lambda _i}^2$ and
 $\tilde {\tau }^2 {\omega _i^{*}}^2$.

Over the entire range of  $\tilde {\tau }\lambda _i$ shown, the effect of filtering appears quite weak (it is more apparent for
 $i=2$ since in that case the results extend over a smaller region of
 $\tilde {\tau }\lambda _i$ owing to the smaller fluctuations of
 $\lambda _2$ compares with
 $\lambda _1$ or
 $\lambda _3$). Nevertheless, the insets to figure 9(a,c,e) highlight that for
 $(\tilde {\tau }\lambda _i)^2\leq 0.3$, filtering reduces the magnitude of both
 $\langle \tilde {\tau }^2\overline{H}_{11}^{{{{P}*}}}|\lambda _1^2\rangle$ and
 $\langle \tilde {\tau }^2\overline{H}_{22}^{{{{P}*}}}|\lambda _3^2\rangle$, whereas the magnitude of
 $\langle \tilde {\tau }^2\overline{H}_{33}^{{{{P}*}}}|\lambda _3^2\rangle$ is reduced by filtering in the regime where it is positive, but increased in the region where it is negative.
In figure 9(b,d,f), we consider the results for  $\langle \overline{H}_{i(i)}^{{{{P}*}}}|\omega _i^{*2}\rangle$. For
 $\tilde {\tau }^2\omega _i^{*2}\gtrsim 3$,
 $\langle \overline{H}_{i(i)}^{{{{P}*}}}|\omega _i^{*2}\rangle$ is negative, leading to the amplification of
 $\lambda _1$ and positive
 $\lambda _2$, but the suppression of
 $|\lambda _3|$. In this regime,
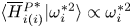 $\langle \overline{H}_{i(i)}^{{{{P}*}}}|\omega _i^{*2}\rangle \propto \omega _i^{*2}$ is a good approximation. For
 $\tilde {\tau }^2\omega _i^{*2}<3$, however,
 $\langle \overline{H}_{i(i)}^{{{{P}*}}}|\omega _i^{*2}\rangle$ changes sign for
 $i=2,3$ and has a highly nonlinear behaviour, similar to that of
 $\langle \overline{H}_{33}^{{{{P}*}}}|\lambda _3^2\rangle$. Taken altogether, the results in figure 9 indicate that closures such as the tetrad model (Chertkov et al. Reference Chertkov, Pumir and Shraiman1999; Naso & Pumir Reference Naso and Pumir2005) and enhanced Gaussian closure (Wilczek & Meneveau Reference Wilczek and Meneveau2014) which predict that the anisotropic pressure Hessian depends on the square of the local velocity gradient are able to capture several important features, but not all, especially in the regime of small gradients.
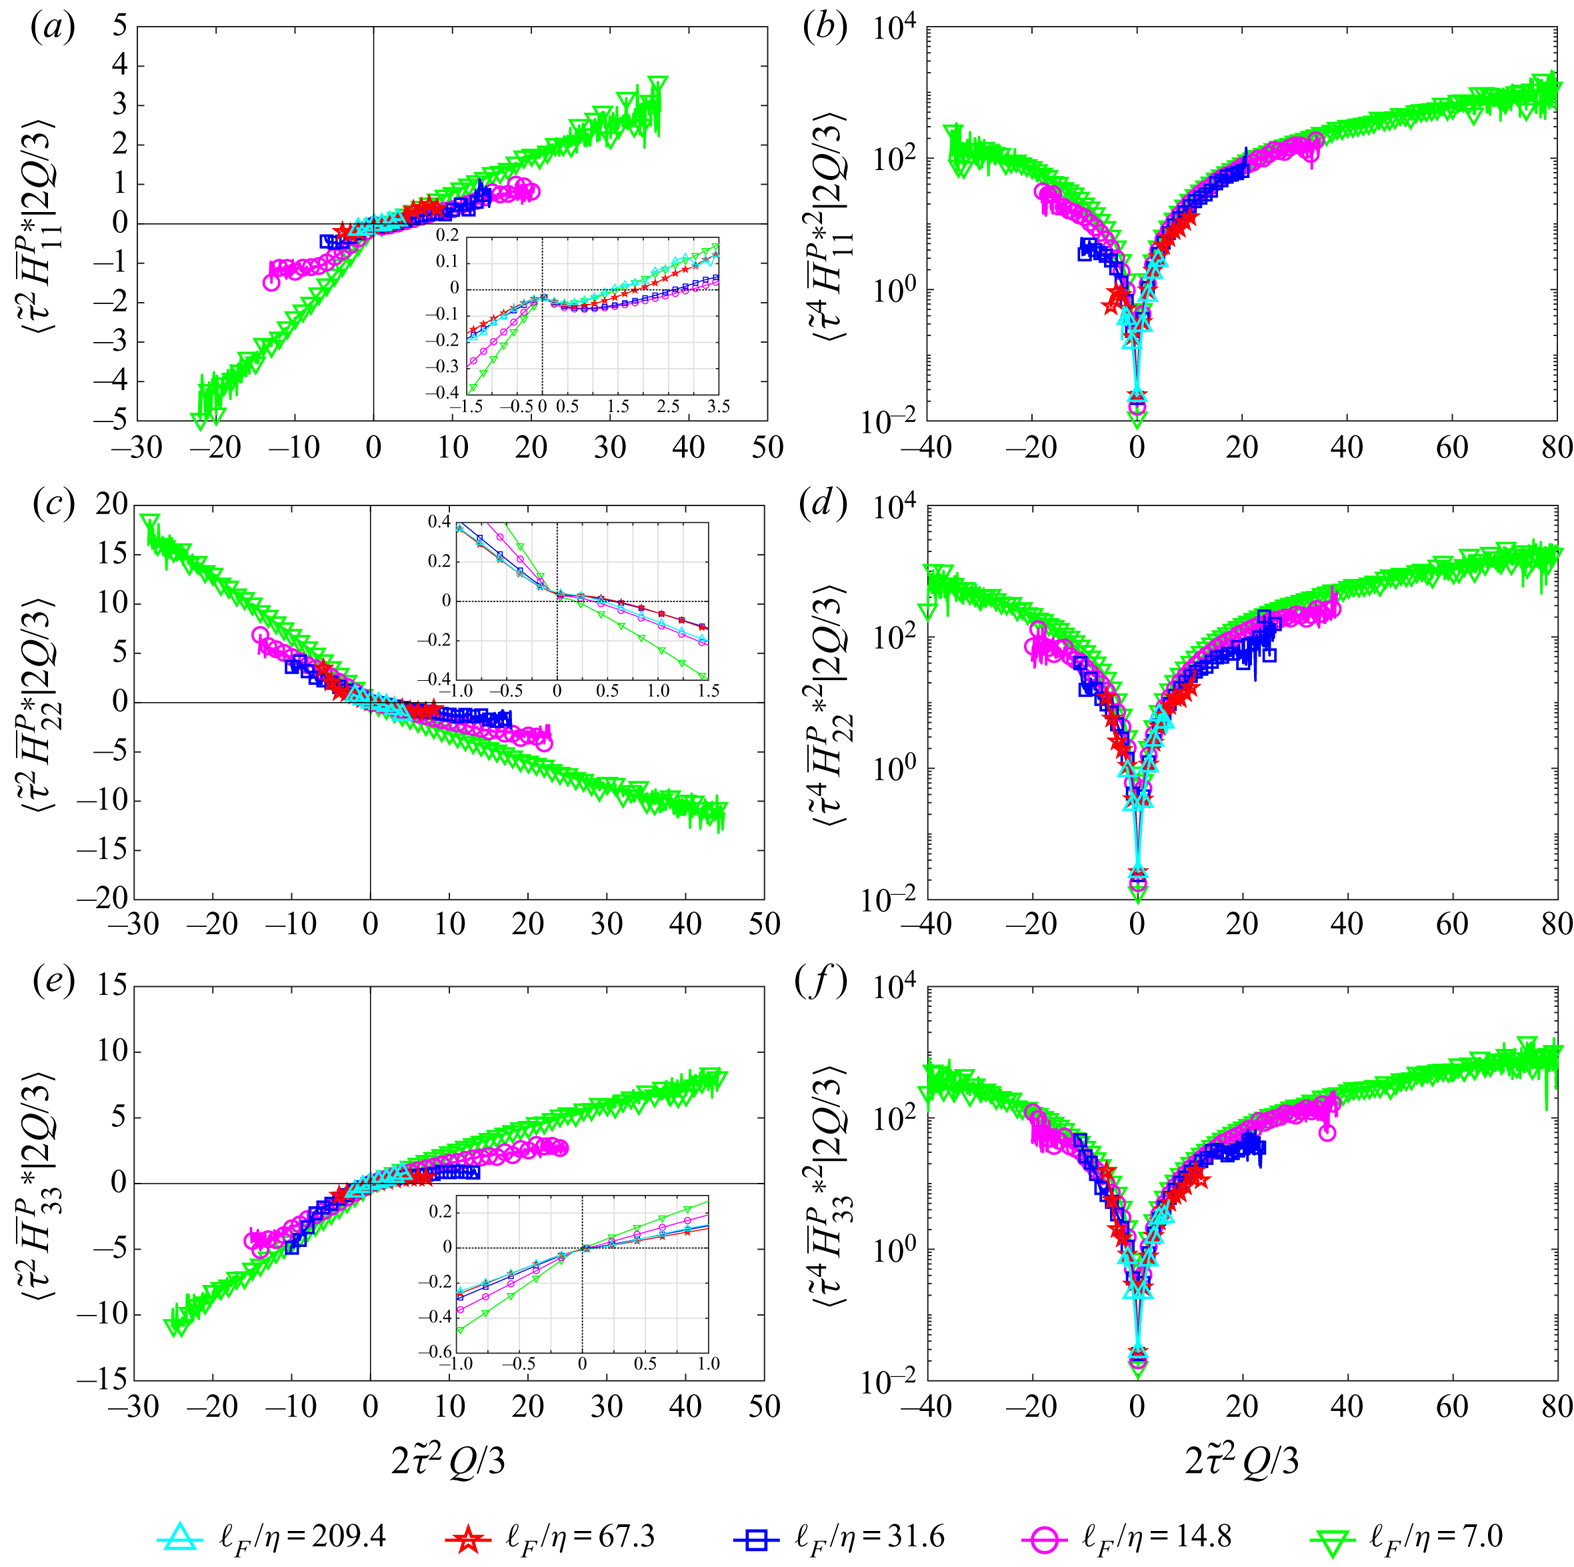
In figure 10, we show results for the first and second moments of  $\overline{H}_{i(i)}^{{{{P}*}}}$ conditioned on the isotropic part of the pressure Hessian,
 $H_{kk}^{P*}/3 = 2Q/3$ (with little abuse of notation in the filtered case, in which Q denotes
 $-\widetilde{{\boldsymbol{A}}^2}/2$). The results show that
 $\langle \overline{H}_{i(i)}^{{{{P}*}}}|2Q/3\rangle$ varies almost linearly with
 $Q$, but with different slopes for
 $Q>0$ and
 $Q<0$. This provides some support for closure models that assume a linear relationship between the anisotropic pressure Hessian and
 $Q$ (Chevillard & Meneveau Reference Chevillard and Meneveau2006; Chevillard et al. Reference Chevillard, Meneveau, Biferale and Toschi2008; Wilczek & Meneveau Reference Wilczek and Meneveau2014). However, whether such models correctly describe the change in slope around
 $Q=0$ should be considered in future work. Also, the DNS results indicate that the average of the norm squared of the anisotropic pressure Hessian conditioned on the invariant
 $Q$ approximately scales as
 $|Q|$ (Chevillard et al. Reference Chevillard, Meneveau, Biferale and Toschi2008), while it scales as
 $Q^2$, by construction, in models that assume a linear relationship between the anisotropic pressure Hessian and
 $Q$.
(a,c,e) Average and (b,d,f) second moment of the diagonal components of the anisotropic pressure Hessian conditioned on the isotropic part of the filtered pressure Hessian (which is equal to  $2/3$ times the second principal invariant of the velocity gradient
 $Q$), for various filtering lengths
 $\ell _F/\eta$. Insets in (a,c,e) highlight the results for small values of
 $2\tilde {\tau }^2 Q/3$.

The second invariant  $Q$ is a measure of the relative importance of strain and vorticity at a given point in the flow. The results in figure 10(a,c,e) indicate that on average
 $\overline{H}_{11}^{{{{P}*}}}$ aids the growth of
 $\lambda _1$ in strain-dominated regions, but counteracts the growth of
 $\lambda _1$ in vorticity-dominated regions. The average and the variance of the contribution from
 $\overline{H}_{11}^{{{{P}*}}}$ is small compared to the contributions from the other diagonal components, in contrast to what was observed earlier for the full component
 $H_{11}^{P*}$. This differing behaviour is due to the contribution of the isotropic pressure Hessian that is proportional to
 $Q$. In vorticity-dominated regions, the average contribution from
 $\overline{H}_{22}^{{{{P}*}}}$ becomes increasingly negative with increasing
 $Q$, and it therefore helps the growth of positive
 $\lambda _2$. This opposes the local part of the pressure Hessian that acts to reduce positive
 $\lambda _2$ events in vorticity-dominated regions. The third diagonal component
 $\overline{H}_{33}^{{{{P}*}}}$ counteracts the growth of
 $|\lambda _3|$ in strain-dominated regions, which is critical to stabilize the dynamics. This feature is absent in the RE model where
 $\overline{H}_{ij}^{{{{P}*}}}=0$, which is one reason that system blows up.
The results in figure 10(b,d,f) for  $\langle \overline{H}_{i(i)}^{{{{{P}*}}}^{2}}|2Q/3\rangle$, together with the insets of figure 10(a,c,e), show that the effect of
 $\overline{H}_{i(i)}^{{{{P}*}}}$ on the eigenframe dynamics does not vanish when
 $Q\to 0$, which was also observed in Chevillard et al. (Reference Chevillard, Meneveau, Biferale and Toschi2008), and is something that is not captured by closure models such as the tetrad model (Chertkov et al. Reference Chertkov, Pumir and Shraiman1999), the Lagrangian linear diffusion model (Jeong & Girimaji Reference Jeong and Girimaji2003) or the recent fluid deformation approximation (Chevillard & Meneveau Reference Chevillard and Meneveau2006). Moreover, the peculiar behaviour of the anisotropic pressure Hessian components observed in figure 9 for small
 $\tilde {\tau }\lambda _i$ and
 $\tilde {\tau }\omega _i$ translates into a non-trivial and non-monotonic behaviour of the pressure Hessian components at small
 $Q$, as shown in the insets of figure 10.
4.4.2. Preferential states of the pressure Hessian
We now turn to characterizing the state of the anisotropic pressure Hessian  ${\boldsymbol {\overline {H}}^{{{{P}}}}}$ by means of its eigenvalues
 $\bar {\phi }_i$, which are associated with its eigenvectors
 $\boldsymbol {w}_i$. The eigenvalues of the full pressure Hessian are denoted by
 $\phi _i$. The shape of the anisotropic part of the pressure Hessian can be quantified by means of the dimensionless quantity
 \begin{equation} s^* = -\sqrt{6}\frac{\textrm{Tr}[(\overline{\boldsymbol{H}}^{{{{P}}}})^3]} {\left(\textrm{Tr}[(\overline{\boldsymbol{H}}^{{{{P}}}})^2]\right)^{3/2}} = -\frac{3\sqrt{6} \quad \bar{\phi}_1\bar{\phi}_2\bar{\phi}_3} {(\bar{\phi}_1^2+\bar{\phi}_2^2+\bar{\phi}_3^2)^{3/2}}. \end{equation}
The variable  $s^*$ has been proposed in Lund & Rogers (Reference Lund and Rogers1994), and since only
 $\bar {\phi }_2$ is not sign definite, the sign of
 $s^*$ is determined by the sign of
 $\bar {\phi }_2$, and the PDF of
 $s^*$ can be used to quantify the probability of the tensor being found in axisymmetric states. The PDF of
 $s^*$ is shown in figure 11(a), and the results show that
 $s^*$ is preferentially positive, indicating that
 $\bar {\phi }_2$ is also preferentially positive. As
 $\ell _F$ is increased, the PDF tends to the constant value of
 $1/2$, corresponding to a uniform random variable (Lund & Rogers Reference Lund and Rogers1994). The preference for positive values of
 $s^*$ indicates that the anisotropic pressure Hessian exhibits a preference to stretch fluid elements along the direction
 $\boldsymbol {w}_3$ (since
 $-\boldsymbol {H}^P$ appears in (2.4)), and to compress them in the plane spanned by
 $\boldsymbol {w}_1$ and
 $\boldsymbol {w}_2$, that is orthogonal to
 $\boldsymbol {w}_3$. In figure 11(b) we show the corresponding results for the strain-rate tensor, for which
 $s^* = -\sqrt {6}\textrm {Tr}[\boldsymbol {S}^3]/ (\textrm {Tr}[\boldsymbol {S}^2])^{3/2}$. The results for this quantity in figure 11(b) show that the preference for
 $\boldsymbol {S}$ to be in a state of bi-axial extension is much greater than that for
 $\boldsymbol {\overline {H}}^{{{{P}}}}$, though in both cases, this preference for bi-axial extension generally becomes weaker as
 $\ell _F$ is increased.
The PDF of  $s^*$ for (a) the anisotropic pressure Hessian, and (b) the strain rate. Dashed lines indicate the probability distribution for a random uncorrelated field.

In order to gain further insight into the state of the full pressure Hessian  $\boldsymbol {{H}}^P$, we aim to characterize the full space of the independent dimensionless quantities that can be formed using the invariants of
 $\boldsymbol {{H}}^P$. Since
 $\boldsymbol {{H}}^P$ is symmetric with three real, independent eigenvalues, two dimensionless quantities can be defined. In the context of the Reynolds stresses, the Lumley triangle provides an insightful way to characterize its anisotropic properties (Lumley Reference Lumley1979; Pope Reference Pope2000). However, this cannot be applied to
 $\boldsymbol {{H}}^P$ since it is not positive definite. As an alternative, we seek to construct an invariant triangle, analogous to the Lumley triangle, by employing the invariants of the normalized quantity
 \begin{equation} b_{ij} = \frac{H_{ij}^P-H_{kk}^P\delta_{ij}/3}{\sqrt{H^P_{mn}H^P_{mn}}}, \end{equation}
which simply corresponds to the normalized components of the anisotropic pressure Hessian. The first two invariants of  $\boldsymbol {b}$ are
 $\textrm {Tr}(\boldsymbol {b})=0$ and
 \begin{equation} b^2 \equiv \textrm{Tr}(\boldsymbol{b}^2) = 1-\left(\frac{H_{kk}^P}{\sqrt{3H_{ij}^PH_{ij}^P}}\right)^2. \end{equation}
Therefore  $b^2$ is bounded,
 $b^2\in [0,1]$. Moreover, the second invariant of
 $\boldsymbol {b}$ is related to the quantity
 $D^*$ through
 $b^2 = 1-(D^*)^2$, where
 \begin{equation} D^* = -\frac{\textrm{Tr}[(\boldsymbol{H}^P)]}{\sqrt{3\textrm{Tr}[(\boldsymbol{H}^P)]^2)}} = -\frac{\phi_1+\phi_2+\phi_3}{ \sqrt{3}\left( \phi_1^2+\phi_2^2+\phi_3^2\right)^{1/2} }. \end{equation}
The parameter  $D^*$ was proposed in Lund & Rogers (Reference Lund and Rogers1994) to quantify the relative magnitude of the isotropic dilatation/compression of a tensor. The constraint on the third invariant is obtained through the discriminant of the characteristic equation of
 $\boldsymbol {b}$. Since the eigenvalues of
 $\boldsymbol {b}$ are real, it follows that
 \begin{equation} \varDelta = \tfrac{1}{2}(\textrm{Tr}(\boldsymbol{b}^2))^3 - 3(\textrm{Tr}(\boldsymbol{b}^3))^2 \ge 0, \end{equation}
and hence  $| {\sqrt {6} \textrm {Tr}(\boldsymbol {b}^3)} | \le (\textrm {Tr}(\boldsymbol {b}^2))^{3/2}$. The zero discriminant case corresponds to
 $(\textrm {Tr}(\boldsymbol {b}^2))^3 = 6(\textrm {Tr}(\boldsymbol {b}^3))^2$ for which two eigenvalues of
 $\boldsymbol {b}$ coincide, implying that two eigenvalues of
 $\boldsymbol {H}^P$ coincide as well, since the eigenvalues of
 $\boldsymbol {H}^P$ are just shifted and scaled with respect to the eigenvalues of
 $\boldsymbol {b}$. When
 $\boldsymbol {H}^P$ is traceless, i.e. the pressure Hessian is purely non-local, the eigenvalues of
 $\boldsymbol {b}$ and
 $\boldsymbol {H}^P$ are proportional. In that purely anisotropic case, we have
 $\textrm {Tr}(\boldsymbol {b}^2)=1$ and
 $\sqrt {6}\textrm {Tr}(\boldsymbol {b}^3)=-s^*$. These relations suggest employing the following as coordinates on the invariant triangle
 \begin{equation} \zeta = -\sqrt{6}\textrm{Tr}(\boldsymbol{b}^3), \quad \chi =\left(\textrm{Tr}(\boldsymbol{b}^2)\right)^{3/2}. \end{equation}
With the coordinates defined in (4.10a,b), a triangle is obtained that has straight sides (the original triangle proposed by Lumley had two curved sides), since  $0\le \chi \le 1$ and
 $|\zeta |\le \chi$.
The following states can be observed on the triangle. The  $|\zeta | = \chi$ sides correspond to axisymmetric states (
 $s^*=1$ on the right and
 $s^*=-1$ on the left), and the side
 $\chi =1$ corresponds to purely anisotropic (traceless) state. The point
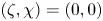 $(\zeta ,\chi )=(0,0)$ corresponds to the isotropic state, while the points
 $(-1,1)$ and
 $(1,1)$ indicate purely anisotropic states with
 $s^*=-1$ and
 $s^*=+1$, respectively. Moreover, the one-component state,
 $\phi _1=\phi _2 = 0$ and
 $\phi _3= \textrm{Tr}({\boldsymbol{H}^P}){:} \phi_3=\textrm{Tr}({\boldsymbol{H}^P})$, results in
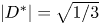 $|D^*|=\sqrt {1/3}$, that is
 $\chi =|\zeta |\simeq 0.54$. The two-component axisymmetric state,
 $\phi _3= 0$ and
 $\phi _2=\phi _1= \textrm{Tr}({\boldsymbol{H}^P})/2{:} \phi_2=\phi_1=\textrm{Tr}({\boldsymbol{H}^P})/2$, results in
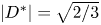 $|D^*|=\sqrt {2/3}$, that is
 $\chi =|\zeta |\simeq 0.19$.
The degree of isotropy is quantified by  $\chi$, anisotropy is maximum on the segment
 $\chi =1$ and decreases towards
 $\chi =0$ according to (4.7). The state of the intermediate eigenvalue of
 $\boldsymbol {b}$, that is its distance from the other two eigenvalues, is measured by the deviation from
 $\zeta =0$, since
 $\zeta = s^*\chi$. If the tensor considered (here
 $\boldsymbol {H}^P$) is always traceless, then the support of the proposed triangle reduces to a segment and the joint PDF of
 $\zeta$ and
 $\chi$ reduces to the PDF of
 $s^*$ (with
 $\chi =1$ fixed). Note that this triangle may be used to quantify the anisotropy of any symmetric second-order tensor, and does not require positive definiteness of the tensor. It therefore represents a generalization of the Lumley triangle.
In figure 12, we show results for this invariant triangle of the pressure Hessian for various filtering lengths. The colour bar range has been truncated to highlight the interesting trends across scales. These results are for a sharp spectral filter and our comparison with results obtained through a Gaussian filtering kernel (not shown) indicates that the results are not very sensitive to the choice of the filtering kernel. The results for the smallest filtering scales highlight a high-probability region near the two-component axisymmetric configuration at  $\chi =\zeta =0.19$, and another near the purely anisotropic state close to the edge
 $\chi =1$. The probability for the pressure Hessian to be in the purely isotropic configuration
 $\zeta =\chi =0$ is low, and there is also a low-probability region around the centre of the triangle, especially for
 $\zeta <0$, corresponding to
 $s^* <0$ and states of bi-axial stretching of the fluid element (since
 $-\boldsymbol {H}^P$ is in (2.4)). As the filtering length is increased, the constant-probability lines tend to become parallel to the
 $\zeta$ axis, associated with the PDF of
 $s^*$ approaching a uniform distribution as
 $\ell _F$ is increased. Most interestingly, the probability of observing the purely isotropic state increases significantly as
 $\ell _F$ increases. Indeed, the peak of the PDF located near
 $\zeta =\chi \simeq 0.19$ for the smallest filtering scale, shifts towards
 $\zeta =\chi =0$ as
 $\ell _F$ is increased. In one sense then, this indicates that the importance of the anisotropic contribution to the pressure Hessian relative to the isotropic contribution reduces as the scale of the flow is increased. However, this is not the whole story since the results also indicate that at all scales there is a significant probability to be close to the purely anisotropic state near the edge
 $\chi =1$. Invariant triangle results for filtering scales larger than
 $\ell _F = 67.3 \eta$ (not shown) did not reveal significant change in preferential states with scale. Hence, the preferential states of the pressure Hessian changes as we move from the viscous to inertial range and appears to be relatively constant in the inertial range. This is reminiscent of the transition occurring at intermediate scales between viscous and inertial range reported in previous works (Chertkov et al. Reference Chertkov, Pumir and Shraiman1999; Cerutti, Meneveau & Knio Reference Cerutti, Meneveau and Knio2000; Danish & Meneveau Reference Danish and Meneveau2018).
Joint PDF of the dimensionless invariants  $\zeta$ and
 $\chi$ of the pressure Hessian (defined in (4.10a,b)) at filtering lengths (a)
 $\ell _F/\eta = 7.0$, (b)
 $\ell _F/\eta = 14.8$, (c)
 $\ell _F/\eta = 31.6$ and (d)
 $\ell _F/\eta = 67.3$. Square markers correspond to two-component axisymmetric configurations, and diamond markers correspond to one-component configurations. The colours correspond to the values of the PDF, and the lines are isocontours of PDF shown in increments of 0.05 between 0 and 2. Note that PDF values greater/smaller than the largest/smallest value in the colour bar are clipped to the colour corresponding to largest/smallest value in the colour bar.

The specific statistical behaviour of the pressure Hessian is challenging to capture for most velocity gradient models. Indeed, as shown by Chevillard et al. (Reference Chevillard, Meneveau, Biferale and Toschi2008) in the framework of RFD, even if the overall predictions of the gradient models are in good qualitative agreement with the results from DNS, the details of the pressure Hessian statistics can be quite unrealistic. For example, the probability current in the  $R,Q$ plane generated by the anisotropic pressure Hessian and the alignment between the Hessian and strain-rate eigenframe are not well predicted by the RFD closure (Chevillard et al. Reference Chevillard, Meneveau, Biferale and Toschi2008). Despite this, the outcome of the model is still close to the results from DNS. It is expected that detailed statistics of the pressure Hessian, such as its preferential state as quantified by the generalized Lumley triangle shown in figure 12, can be predicted more accurately by closures based on tensor representation of the pressure Hessian in terms of a large number of basis elements (Pennisi & Trovato Reference Pennisi and Trovato1987; Leppin & Wilczek Reference Leppin and Wilczek2020). This allows for more degrees of freedom to model the complexity of the Hessian but it also requires more constraints on the coefficients and usually the Betchov relations (Betchov Reference Betchov1956) are employed (Johnson & Meneveau Reference Johnson and Meneveau2016; Leppin & Wilczek Reference Leppin and Wilczek2020). On the other hand, closures for the pressure Hessian based on the deformation tensor alone (Chevillard & Meneveau Reference Chevillard and Meneveau2006) impose by construction that the Hessian and Cauchy–Green tensor share the same eigenvectors and are in the same shape (quantified by
 $s^*$). This has strong dynamical impact on the energy and angular momentum balances of the fluid elements (Vieillefosse Reference Vieillefosse1984).
4.5. Characterization of the viscous stress
In figure 13(a,c,e) we show results for  $\left \langle H _{i(i)}^{\nu *}|\lambda _i\right \rangle$, the average of the diagonal components of the viscous strain-rate term in the eigenframe, conditioned on the corresponding eigenvalue. (Recall that in our notation,
 $H_{ij}^{\nu *}=\nu \boldsymbol {v}_i\boldsymbol {\cdot }(\nabla ^2\boldsymbol {S})\boldsymbol {\cdot } \boldsymbol {v}_{j}$ is the component of the Laplacian of the strain-rate tensor and not the Laplacian of the strain-rate eigenvalue.) The results show that this quantity has the opposite sign to
 $\lambda _i$, for each
 $i$. This is in agreement with the results for
 $\left \langle H _{i(i)}^{\nu *}\right \rangle$ in figure 1, that revealed a damping effect of the viscous term on the eigenvalue evolution, and indicates a dependence of
 $\left \langle H _{i(i)}^{\nu *}|\lambda _i\right \rangle$ on odd powers of
 $\lambda _i$. This is consistent with the idea that under time reversal
 $t\to -t$,
 $\nabla ^2\boldsymbol {A}\to - \nabla ^2\boldsymbol {A}$ and
 $\boldsymbol {A}\to -\boldsymbol {A}$, and therefore a representation of
 $\nabla ^2\boldsymbol {A}$ in terms of
 $\boldsymbol {A}$ should satisfy
 $\nabla ^2\boldsymbol {A}(\boldsymbol {A},\ldots ) = -\nabla ^2\boldsymbol {A}(-\boldsymbol {A},\ldots )$. The results also indicate that
 $\left \langle H _{i(i)}^{\nu *}|\lambda _i\right \rangle$ depends nonlinearly on
 $\lambda _i$, but approach a more linear dependence as
 $\ell _F$ is increased. This would seem to imply that the nonlinear dependence at small
 $\ell _F$ is mainly due to intermittency of the velocity gradient.
(a,c,e) Average of the diagonal components of the filtered viscous stress in the eigenframe conditioned on the corresponding eigenvalues (see (2.10b)), for various filtering lengths  $\ell _F/\eta$. (b,d,f) Average of the anti-symmetric part of the viscous stress components in the eigenframe conditioned on the corresponding vorticity component (see (2.12)).

In figure 13(b,d,f) we show results for  $\left \langle \varOmega _i^{\nu *}|\omega _i^{*}\right \rangle$, the average of the Laplacian of the vorticity conditioned on the corresponding component of vorticity. Similar to the strain-rate case, we find that
 $\left \langle \varOmega _i^{\nu *}|\omega _i^{*}\right \rangle$ has the opposite sign to
 $\omega _i^{*}$, with the curves showing a well-defined trend in terms of the first few odd powers of the vorticity components
 \begin{equation} \left\langle \varOmega_i^{\nu*}|\omega_i^{*}\right\rangle \simeq a_1\omega_i^{*} + a_3\omega_i^{* 3}. \end{equation}
This power-law trend partially corroborates linear closures of the form  $\nu \nabla ^2\boldsymbol {A}\sim -\boldsymbol {A}/T$ (Martın, Dopazo & Vali no Reference Martın, Dopazo and Vali no1998; Wilczek & Meneveau Reference Wilczek and Meneveau2014), where
 $T$ is a certain time scale, but also shows that higher-order terms should be incorporated into the closure in order for it to accurately capture the behaviour when
 $\tilde {\tau }\omega _i^{*}$ is not small. The additional model parameters that derive from including a cubic term may be fixed by homogeneity constraints. The linear approximation of the gradient Laplacian with the gradient itself can also be improved by introducing a proportionality coefficient that depends on the (short-time) deformation tensor, thus allowing for realistic prediction of the viscous Laplacian in the RFD model (Chevillard et al. Reference Chevillard, Meneveau, Biferale and Toschi2008). The first-order term in (4.11) gives a non-zero slope at
 $\omega _i=0$, while the higher-order terms cause departures from the linear trend. As
 $\ell _F$ is increased, deviations of
 $\left \langle \varOmega _i^{\nu *}|\omega _i^{*}\right \rangle$ from the linear behaviour become less evident, and the linear closure works quite well. The power-law trend in (4.11) is accurately reproduced by the Lagrangian linear diffusion model (Jeong & Girimaji Reference Jeong and Girimaji2003).
The dependence of  $\left \langle H _{i(i)}^{\nu *}|\lambda _i\right \rangle$ on odd powers of
 $\lambda _i$ and the dependence of
 $\left \langle \varOmega _i^{\nu *}|\omega _i^{*}\right \rangle$ on odd powers of
 $\omega _i^{*}$ is reflected by the correlation between the Laplacian of the strain/vorticity and the strain/vorticity itself, which is shown in figure 14, as a function of the filtering length. Here, the correlation coefficients are defined as
 \begin{equation} \psi( \boldsymbol{H}^{\nu}, \boldsymbol{S} )\equiv \frac{ \left\langle H_{ij}^{\nu*}S_{ij}^{*}\right\rangle } { \sqrt{ \left\langle H_{ij}^{\nu*}H_{ij}^{\nu*}\right\rangle\left\langle S_{ij}^{*} S_{ij}^{*}\right\rangle } }, \quad \psi( \boldsymbol{\varOmega}^{\nu}, \boldsymbol{\omega}) \equiv \frac{ \left\langle\varOmega_{i}^{\nu*}\omega_{i}^{*}\right\rangle } { \sqrt{ \left\langle\varOmega_{i}^{\nu*}\varOmega_{i}^{\nu*}\right\rangle\left\langle\omega_{i}^{*}\omega_{i}^{*}\right\rangle } }. \end{equation}
Since  $\varOmega _i^{\nu *}$ decreases on average with
 $\omega _i^{*}$, as observed above, the correlation coefficient is always negative. Also, since
 $\varOmega _i^{\nu *}$ has a relatively strong linear dependence on
 $\omega _i^{*}$ when
 $\tilde {\tau }\omega _i^{*}$ is not too large, the correlation coefficient is quite large (and negative), especially in the inertial range, indicating strong negative proportionality between
 $\nabla ^2\boldsymbol {\omega }$ and
 $\boldsymbol {\omega }$. Most striking is that the results show
 $\psi ( \boldsymbol {H}^{\nu }, \boldsymbol {S} )=\psi ( \boldsymbol {\varOmega }^{\nu }, \boldsymbol {\omega })$, such that the correlation between the symmetric and anti-symmetric parts of the velocity gradient and their Laplacian is the same. Betchov (Reference Betchov1956) proved the relation
 $\left \langle \boldsymbol {S:S}\right \rangle =\left \langle \boldsymbol {\omega }\boldsymbol {\cdot }\boldsymbol {\omega }\right \rangle /2$ for an incompressible and statistically homogeneous flow, and following the same approach it is easily derived that
 \begin{equation} \left\langle\nabla^2A_{ij}A_{ji}\right\rangle = \left\langle\partial_j(\nabla^2u_i\partial_iu_j)\right\rangle = 0. \end{equation}
Therefore, splitting the velocity gradient into symmetric and anti-symmetric parts we have  $\left \langle S _{ij}\nabla ^2S_{ij}\right \rangle = \left \langle W _{ij}\nabla ^2W_{ij}\right \rangle$ and finally
 \begin{equation} \left\langle\boldsymbol{S :}\nabla^2\boldsymbol{S}\right\rangle = \left\langle\boldsymbol{\omega}\boldsymbol{\cdot} \nabla^2\boldsymbol{\omega}\right\rangle/2. \end{equation}
Analogously, it can be derived that  $\left \langle \nabla ^2\boldsymbol {S :} \nabla ^2 \boldsymbol {S}\right \rangle = \left \langle \nabla ^2\boldsymbol {\omega }\boldsymbol {\cdot }\nabla ^2\boldsymbol {\omega }\right \rangle /2$. As a consequence, the correlations coefficients in (4.12a,b) are the same for incompressible, homogeneous flows.
Correlation coefficient between the filtered strain rate and the symmetric part of the viscous stress, and between the filtered vorticity and the anti-symmetric part of the viscous stress. The correlation coefficient  $\psi$ is shown as a function of the filtering length
 $\ell _F/\eta$.

4.6. Characterization of the sub-grid stress
Knowledge of the statistical behaviour of the sub-grid stress is required in order to develop models for the filtered velocity gradient. Including this term in the spirit of modelling approaches for pressure Hessian and viscous stresses naturally extends the existing models to predict larger scale behaviour. To this end, the sub-grid stress is characterized by means of the correlation between its components and the other dynamical terms which contribute to the filtered gradient evolution equations. This can provide insight for closure models in terms of how the sub-grid stress might be related to the filtered quantities in the flow.
We introduce the general correlation coefficient
 \begin{equation} \psi(X,Y) \equiv \frac{ \left\langle XY\right\rangle-\left\langle X\right\rangle\left\langle Y\right\rangle } { \sqrt{ \left(\left\langle X^2\right\rangle-\left\langle X\right\rangle^2\right)\left(\left\langle Y^2\right\rangle-\left\langle Y\right\rangle^2\right) } }, \end{equation}
where  $X,Y$ are scalar quantities. In figure 15(a) we show results for
 $\psi (X,Y)$ for the case where
 $X,Y$ are components of the pressure Hessian and symmetric part of the sub-grid contribution in the eigenframe, both of which contribute to the strain-rate dynamics, according to (2.10b). The results show that
 $-H_{ij}^{\tau *}$ and
 $-H_{ij}^{P*}$ are negatively correlated (here and throughout this discussion we include in front of the terms the sign with which they appear in the dynamical equations), although the correlation is not that strong. A positive correlation is observed only between
 $-H_{33}^{P*}$ and
 $-H_{33}^{\tau *}$ at the smallest scales, implying that in the dissipation range they both tend to hinder the growth of
 $\lambda _3$. At larger scales where the correlations are all negative,
 $-H_{ij}^{\tau *}$ and
 $-H_{ij}^{P*}$ have opposite effects on the eigenvalue dynamics and on the angular velocity of the eigenframe.
Correlation coefficient,  $\psi (X,Y)$ between (a) the sub-grid stress and pressure Hessian and between (b) the sub-grid stress and the symmetric part of the viscous stress, plotted as a function of the filtering length
 $\ell _F/\eta$.

The correlation coefficient between the viscous ( $H_{ij}^{\nu *}$) and sub-grid (
 $-H_{ij}^{\tau *}$) terms in (2.10b) as a function of the filtering length is shown in figure 15(b). At the smallest scales, the correlations between the diagonal components
 $H_{i(i)}^{\nu *}$ and
 $-H_{i(i)}^{\tau *}$ are positive and the sub-grid stress tends to help the viscous damping effect on
 $\lambda _i$. At larger scales, the correlation between
 $H_{11}^{\nu *}$ and
 $-H_{11}^{\tau *}$ becomes negative so that they have opposite effects on the dynamics of
 $\lambda _1$. The correlations between the off-diagonal components of
 $H_{ij}^{\nu *}$ and
 $-H_{ij}^{\tau *}$ that contribute to the eigenframe rotation rate are almost independent of
 $\ell _F$, and the terms
 $H_{21}^{\nu *}$ and
 $-H_{21}^{\tau *}$ are almost entirely uncorrelated. In general, the scale dependence of the correlations between the diagonal and off-diagonal components of
 $H_{ij}^{\nu *}$ and
 $-H_{ij}^{\tau *}$ is quite different, in contrast to the behaviour of the correlations between
 $-H_{ij}^{P*}$ and
 $-H_{ij}^{\tau *}$, for which the diagonal and off-diagonal terms behave similarly. The transition of the normalized correlation coefficient for
 $\psi ( -H_{11}^{\tau *}, H_{11}^{\nu *} )$ reported in figure 15(b) from the dissipation to inertial range is reminiscent of the transitions reported in Danish & Meneveau (Reference Danish and Meneveau2018).
Figure 16 shows the correlation between  $-H_{i(i)}^{\tau *}\lambda _{(i)}$ and both the strain self-amplification term (
 $-\lambda _i^3$) and
 $H_{i(i)}^{\nu *}\lambda _{(i)}$, terms which appear in the equation governing
 $\lambda _{i}^2$ evolution. Concerning the correlation between
 $-H_{i(i)}^{\tau *}\lambda _{(i)}$ and
 $-\lambda _i^3$, the correlations are positive for
 $i=2$, and negative for
 $i=1,3$ at all scales (although the data may indicate that the
 $i=1$ component becomes positive for
 $\ell _F/\eta \to 0$). Therefore, the sub-grid stress tends to oppose the growth of
 $\lambda _1$ and positive
 $\lambda _2$, although the correlation is weak. The correlation is strongest for
 $i=3$, and the negativity of the correlation indicates that the sub-grid stress acts to stabilize the dynamics by opposing the growth of
 $|\lambda _3|$. Interestingly, the correlations between
 $-H_{i(i)}^{\tau *}\lambda _{(i)}$ and
 $H_{i(i)}^{\nu *}\lambda _{(i)}$ are similar in magnitude to those between
 $-H_{i(i)}^{\tau *}\lambda _{(i)}$ and
 $-\lambda _i^3$. The correlation between
 $-H_{i(i)}^{\tau *}\lambda _{(i)}$ and
 $H_{i(i)}^{\nu *}\lambda _{(i)}$ is positive for
 $i=3$, indicating that the sub-grid stress also acts to help the viscous stress in reducing
 $|\lambda _3|$.
Correlation coefficient,  $\psi (X,Y)$, between the sub-grid contribution
 $-H_{i(i)}^{\tau *} \lambda _{(i)}$ and the strain self-amplification term
 $-\lambda _i^3$, and between the sub-grid contribution
 $-H_{i(i)}^{\tau *} \lambda _{(i)}$ and viscous stress contribution
 $-H_{i(i)}^{\nu *} \lambda _{(i)}$, plotted as a function of the filtering length
 $\ell _F/\eta$.

Figure 17 shows the correlation between  $-\varOmega _i^{\tau *} \omega _{(i)}^{*}$ and both
 $\lambda _i{\omega _{(i)}^{*}}^2$ and
 $\varOmega _i^{\nu *} \omega _{(i)}^{*}$, terms which appear in the enstrophy equation (4.2). The correlations between
 $-\varOmega _i^{\tau *} \omega _{(i)}^{*}$ and
 $\lambda _i{\omega _{(i)}^{*}}^2$ are negative for all
 $i$ and at all scales, showing that the sub-grid stress acts on average to counteract the amplification of
 $\omega _1^{*}$ and the reduction of
 $\omega _3^{*}$, and also to hinder vortex stretching along the direction
 $\boldsymbol {v}_2$. The correlation between
 $-\varOmega _i^{\tau *} \omega _{(i)}^{*}$ and
 $\varOmega _i^{\nu *} \omega _{(i)}^{*}$ is positive for
 $i=2$, showing that the sub-grid stress acts together with the viscous stress to hinder the growth of
 $\omega _2^{* 2}$, at all scales, though the correlation is weak. The correlation is also positive for
 $i=1$, showing that the sub-grid and viscous terms act together to reduce
 $\omega _1^{* 2}$, and in this case, the correlation is quite strong, reaching values around
 $0.6$ in the inertial range. In contrast to the behaviour for
 $i=1,2$, the sub-grid stress opposes the viscous effect on
 $\omega _3^{* 2}$ at all scales, just as it also opposes the vortex compression that occurs for the
 $i=3$ component.
Correlation coefficient,  $\psi (X,Y)$ between the sub-grid contribution
 $-\varOmega _i^{\tau *} \omega _{(i)}^{*}$ and the vortex-stretching term
 $\lambda _{(i)} {\omega _i^{*}}^2$, and between the sub-grid contribution
 $-\varOmega _i^{\tau *} \omega _{(i)}^{*}$ and the viscous stress contribution
 $-\varOmega _i^{\nu *} \omega _{(i)}^{*}$.

5. Summary and outlook
In this paper, we have explored the properties of the dynamical equations governing the filtered velocity gradient tensor written in the eigenframe of the strain-rate tensor. We now summarize the main results and for simplicity we refer to the most extensional, intermediate and most compressional strain-rate eigenvalues as first, second and third eigenvalues respectively. The strain-rate eigendirections and vorticity principal components are also labelled accordingly.
The velocity gradient dynamics is governed by local and non-local/unclosed terms. The local part of the dynamics consists of strain self-amplification, which tends to amplify the third eigenvalue, centrifugal forces due to spinning of the fluid element, which counteracts amplification of the third eigenvalue, and vortex stretching, which tends to shrink the vorticity component along the third eigendirection. When non-local terms are neglected, the strain self-amplification dominates over the vorticity contribution, resulting in a finite-time singularity for almost all initial conditions, driven mainly by self-amplification of the third eigenvalue. Real turbulence does not display this singular behaviour and therefore, it is crucial to characterize the effects non-local/unclosed terms, which include anisotropic pressure Hessian, viscous and sub-grid stress. Our results show that the pressure Hessian, viscous and sub-grid stress have an average stabilizing effect on the third eigenvalue, at all scales. The mean contributions to the rate of change of vorticity principal components are dominated by vortex stretching and vorticity tilting at the smallest scales, while the sub-grid stress contribution makes an important contribution at large scales. The vorticity tilting with respect to the strain eigenframe does not alter the overall enstrophy balance, but it damps the first vorticity principal component and amplifies the third, thus counteracting vortex stretching. This is similar to its behaviour in the RE system. The average effect of viscous term is to reduce the magnitude of all the components of enstrophy. Also, it is interesting that the average effects of the sub-grid stress and vortex stretching terms are opposite for all components and at all scales. Conditioning the strain-rate eigenvalues and vorticity principal components on the principal invariants of the filtered velocity gradient reveals that the first, and more importantly third, vorticity principal components tend to be small along the right Vieillefosse tail, where the local part of the gradient dynamics tends to be singular. This misalignment between vorticity and the third eigendirection supports ‘reduction of nonlinearity’ models that assume that the vorticity is effective in stabilizing the gradient dynamics.
The onset of singularity in the RE system is related to its multiple first integrals of motion, which imply that the angular velocity goes rapidly to zero as the finite-time singularity is approached. Our results show that this eigenframe angular velocity can take on large values in turbulence and plays a major role in the vorticity dynamics. These striking large values persist even at large filtering scales, a significant cause of which is kinematic, being related to the large probability of having very small differences between the eigenvalues. In particular, the differences in the eigenvalues act as a moment of inertia in the eigenframe rotation-rate equation, and so small differences in the eigenvalues allows for large rotation rates. The non-local anisotropic pressure Hessian is the dominating contribution to the eigenframe rotation rate, being much larger than the contribution from the local spinning of the fluid due to vorticity. The sub-grid stress also makes an important contribution outside the dissipation range. Most importantly, for large gradients, the local and non-local torques applied on the strain-rate eigenframe grow faster than the eigenvalues differences, thus sustaining the eigenframe rotation rate.
Models for the velocity gradient represent non-local/unclosed terms in terms of local quantities, therefore we study the averages of unclosed contributions conditioned on local gradients. The diagonal principal components of the anisotropic pressure Hessian exhibit an almost linear trend when conditioned on the local velocity gradient, characterized by the square of the strain-rate eigenvalues and vorticity principal components. This supports models such as the enhanced Gaussian closure and recent fluid deformation approximation, in which the pressure Hessian is proportional to the square of the local velocity gradient. However, the results also show highly nonlinear behaviour for relatively small values (compared to the eddy turnover time scale based on the filtering scale) of the strain eigenvalues and vorticity, a feature that is very challenging to replicate in models. Concerning the viscous stresses, the conditional averages of the viscous Laplacian with respect to the local gradient show that the symmetric part of the viscous stress behaves as an odd function of strain eigenvalue. The anti-symmetric part of the viscous stress shows a similar dependence on the vorticity principal components. While velocity gradient models, such as the enhanced Gaussian closure and the recent fluid deformation approximation, describe these odd functions with a linear behaviour, our results showed that cubic terms should also be included. This is confirmed by the correlation coefficient between the filtered velocity gradient and its Laplacian which is negative, but not very close to  $-1$, especially at small scales.
Knowledge of the sub-grid stress statistics is required in order to develop models for the filtered velocity gradient. To this end, the sub-grid stress has been characterized by means of its component-wise correlation with the other terms in the strain-rate eigenframe equations for the filtered velocity gradient. The symmetric part of the sub-grid stress is preferentially negatively correlated with the pressure Hessian and positively correlated with the symmetric viscous stress (except the first diagonal component for sharp spectral filtering). The sub-grid stress also tends to be negatively correlated with all principal components of vortex stretching. These correlation coefficients are sensitive to the specific choice of filtering kernel, as comparisons between sharp and Gaussian filtering show. For the Gaussian filter, the correlation between pressure Hessian and sub-grid stress can take relatively large values, which is promising for modelling, since the same reasoning and modelling approaches used for the pressure Hessian can apply to the sub-grid stress as well.
In order to characterize the state of the pressure Hessian, we developed a generalization of the classical Lumley triangle that does not require positive definiteness of the tensor. The results using this triangle revealed a preference for the intermediate eigenvalue of the pressure Hessian to be positive, but the preference is much weaker than for the strain rate. Moreover, the pressure Hessian filtered at small scales is rarely in the isotropic configuration, while the most probable states are complete anisotropy and two-dimensional axisymmetric expansion. Therefore, the pressure Hessian preferentially exerts a two-dimensional axisymmetric compression on the fluid element along two of its eigendirections. As the filtering scale is increased, the probability of two-dimensional axisymmetric expansion reduces and the peak in probability that occurred there at small scales shifts towards the isotropic state. However, there still exists a significant probability for configurations where the non-local contribution dominates the pressure Hessian. Finally, the generalized Lumley triangle results for pressure Hessian are not very sensitive to the specific choice of the filtering kernel.
Taken together, the results presented provide a comprehensive statistical description of the filtered velocity gradient dynamics from the perspective of the strain-rate eigenframe. Lagrangian models for the velocity gradient tensor can be tested against the data, but predicting the non-trivial behaviour of the non-local terms highlighted throughout the paper represents a challenge for those models. The new results on the preferential state and scale dependence of pressure Hessian, viscous and sub-grid stress constitute a reference for modelling those unclosed parts of the equations and they can enhance our understanding of the nonlinear and non-local evolution of the filtered velocity gradient in turbulence.
Acknowledgements
This work used the Extreme Science and Engineering Discovery Environment (XSEDE) under allocation CTS170009, which is supported by National Science Foundation (NSF) grant number ACI-1548562 (Towns et al. Reference Towns, Cockerill, Dahan, Foster, Gaither, Grimshaw, Hazlewood, Lathrop, Lifka and Peterson2014). Specifically, Stampede2 cluster operated by Texas Advanced Computing Center (TACC) was used to obtain the results in this work. The Comet cluster operated by the San Diego Supercomputer Center (SDSC) and Duke Computing Cluster (DCC) operated by Duke University Research Computing was used to obtain some of the preliminary results for this study. The authors gratefully acknowledge discussions and input from M. Momenifar on the issue discussed in appendix B.
Declaration of interests
The authors report no conflict of interest.
Appendix A. Derivation of filtered Navier–Stokes equations in the strain-rate eigenframe
In this appendix, we summarize the derivation of (2.6) and (2.8) in the filtered strain-rate eigenframe. For notation simplicity the tilde denoting filtering quantities is suppressed in the following. The eigenvectors of the filtered strain-rate tensor  $\{\boldsymbol {v}_i\}$, which are orthogonal and normalized to unit length, form a basis of the three-dimensional space. The basis
 $\{\boldsymbol {v}_i\}$ varies in space and time and will be referred to as the strain-rate eigenframe. The basis
 $\{\boldsymbol {v}_i\}$ and the standard basis
 $\{\boldsymbol {e}_j\}$ are related by the rotation matrix
 $V_{ji}$, the
 $i$th column of which contains the components of the
 $i$th strain-rate eigenvector with respect to the standard basis
 \begin{equation} V_{ji} \equiv \boldsymbol{e}_j^{\top} \boldsymbol{\cdot} \boldsymbol{v}_i, \end{equation}
and  $\boldsymbol {v}_i=V_{ji}\boldsymbol {e}_j$. The matrix
 $V_{ji}$ is orthonormal since
 $V_{ki} V_{kj} = \delta _{ij}$, where
 $\delta _{ij}$ is the Kronecker delta. Only right-oriented orthonormal bases are considered, with
 $\det \boldsymbol {V}=1 \ \forall \, \boldsymbol {x},t$.
The filtered strain rate in its principal basis is
 \begin{equation} \boldsymbol{S} = S_{ij}\boldsymbol{e}_i\boldsymbol{e}_j^{\top} = V_{ik}S_{ij}V_{jm}\boldsymbol{v}_k\boldsymbol{v}_m^{\top} = S^{*}_{km}\boldsymbol{v}_k\boldsymbol{v}_m^{\top}, \end{equation}
where repeated indices imply summation and  $S^{*}_{ij}$ is a diagonal matrix containing the eigenvalues
 $\lambda _i$ on its diagonal. The strain-rate eigenframe, formed by the principal basis, undergoes a rigid body rotation, since the eigenvectors
 $\{\boldsymbol {v}_i\}$ remain orthonormal and right oriented for all times. Therefore, the angular velocity
 $\boldsymbol {\varpi }$ is the same for all the eigenvectors
 \begin{equation} D_t \boldsymbol{v}_i = \boldsymbol{\varpi}\boldsymbol{\times} \boldsymbol{v}_i. \end{equation}
Furthermore, the angular velocity of the principal basis is associated with the anti-symmetric tensor
 \begin{equation} \boldsymbol{\varPi} = \varPi_{ij} \boldsymbol{e}_i\boldsymbol{e}_j^{\top} = \epsilon_{ikj} \varpi_k \boldsymbol{e}_i\boldsymbol{e}_j^{\top}, \end{equation}
whose components in the principal basis are
 \begin{equation} \varPi_{ij}^{*} = \epsilon_{ikj}\varpi_k^{*}. \end{equation}
The factor  $1/2$ is not in this definition because
 $\boldsymbol {\varpi }$ is not a curl but the actual angular velocity of the strain eigenframe. The dynamical equation for the strain-rate eigenvectors (A 3) in the eigenframe can be rewritten using (A 5)
 \begin{equation} D_t\boldsymbol{v}_i = \varPi_{kj} V_{ji} V_{km} \boldsymbol{v}_m = \varPi_{mi}^{*} \boldsymbol{v}_m. \end{equation}
The time derivative of the strain rate can be now expressed in the strain-rate eigenframe
 \begin{equation} D_t\boldsymbol{S} = D_t\left( S^{*}_{ij}\boldsymbol{v}_i\boldsymbol{v}_j^{\top} \right) = D_t S^{*}_{ij} \boldsymbol{v}_i\boldsymbol{v}_j^{\top} + S^{*}_{ij} \boldsymbol{v}_k \varPi_{ki}^{*}\boldsymbol{v}_j^{\top} + S^{*}_{ij} \boldsymbol{v}_i \varPi_{kj}^{*} \boldsymbol{v}_k^{\top}, \end{equation}
that is, adjusting the indices,
 \begin{equation} D_t\boldsymbol{S} = \left( D_t S^{*}_{ij} + \varPi_{ik}^{*} S^{*}_{kj} - S^{*}_{ik} \varPi_{kj}^{*} \right)\boldsymbol{v}_i\boldsymbol{v}_j^{\top}. \end{equation}
The term due to the rotation of the eigenframe is the commutator between the anti-symmetric tensor associated with the rotation of the strain-rate eigenbasis and the strain itself
 \begin{equation} [\boldsymbol{\varPi},\boldsymbol{S}] = \boldsymbol{\varPi} \boldsymbol{\cdot} \boldsymbol{S} - \boldsymbol{S} \boldsymbol{\cdot} \boldsymbol{\varPi} = \left(\varPi_{ik}^{*} S^{*}_{kj} - S^{*}_{ik} \varPi_{kj}^{*}\right)\boldsymbol{v}_i\boldsymbol{v}_j^{\top}. \end{equation}
The equation for the filtered strain rate in its eigenframe is obtained by using (A 7) into (2.6) and then projecting (2.6) along  $\boldsymbol {v}_i\boldsymbol {v}_j^{\top }$.
 \begin{gather} S_{ii}^{*} = 0, \end{gather}
 \begin{gather}D_t S_{ij}^{*} + \varPi_{ik}^{*} S^{*}_{kj} - S^{*}_{ik} \varPi_{kj}^{*} = -S^{*}_{ik}S^{*}_{jk} + \tfrac{1}{4}\left(\omega^2\delta_{ij}-\omega_i^{*}\omega_j^{*}\right) - H_{ij}^{P*} + H_{ij}^{\nu*} - H_{ij}^{\tau*}, \end{gather}
where  $H_{ij}^{P *}$,
 $H_{ij}^{\nu *}$ and
 $H_{ij}^{\tau *}$, defined in the main text (2.11a–c), are the components of the pressure, viscous and sub-grid symmetric contributions in the strain-rate eigenbasis. Equations (2.10) follows by splitting (A 10) into its diagonal and off-diagonal parts and noting that the commutator (A 9) has zeros along its diagonal.
Similarly, the vorticity time derivative is expressed in the eigenframe using (A 6)
 \begin{equation} D_t \boldsymbol{\omega} = D_t \left(\omega_i^{*}\boldsymbol{v}_i\right) = \left(D_t \omega_i^{*} + \varPi_{ij}\omega_j^{*}\right)\boldsymbol{v}_i, \end{equation}
and the vorticity equation in the strain eigenframe (2.12) follows by projecting the vorticity equation (2.8) along  $\boldsymbol {v}_i$ and using (A 11).
Appendix B. Preserving incompressibility and positive definiteness in de-aliased computation of the pressure Hessian
In this appendix, we discuss an issue that arises when computing the pressure Hessian  $\boldsymbol {H}^P$, which, if not handled correctly, leads to a violation of the incompressibility constraint, which, for the unfiltered fields, reads
 \begin{equation} \textrm{Tr}(\boldsymbol{H}^P + \boldsymbol{A}\boldsymbol{\cdot}\boldsymbol{A})=0. \end{equation}
This issue was is part discussed in Cheng & Cantwell (Reference Cheng and Cantwell1996). However, there are additional complications not discussed in that paper which, to the best of our knowledge, have been overlooked in previous work. We discuss the issues in one spatial dimension for simplicity; however, the conclusions are easily extended to three dimensions by separation of variables.
In a spectral representation, aliasing errors arise when one attempts to represent a field that has active Fourier modes with wavenumbers larger than the maximum wavenumber that is resolved by the discrete numerical grid (Canuto et al. Reference Canuto, Hussaini, Quarteroni and Zang1988). In the NSE, the nonlinear term naturally tends to violate this constraint, since even if the initial field is resolved by the grid, the nonlinear term can excite Fourier modes with wavenumbers larger than what the grid can resolve. The maximum wavenumber that can be represented on the grid is the Nyquist wavenumber  $N_{Nyq}=N/2$ (here
 $N$ is the number of grid points and the grid resolution is
 $\Delta x = 2{\rm \pi} /N$) and wavenumbers exceeding the Nyquist wavenumber,
 $|k|>N_{Nyq}$, are aliased to wavenumbers
 $\text {mod}(k, N/2)\in (-N/2,N/2)$. The convective nonlinear term requires the computation of products of the velocity field with itself and, since the velocity field is represented as the superposition of
 $N$ Fourier modes, then the nonlinear convective term involves
 $2N$ active Fourier modes, which cannot be represented on the grid. In order to remove the aliasing error, the Fourier transform of the velocity field is set to zero at wavenumbers
 $|k|\ge N/3$ and it is easily shown that the resulting nonlinear convective term is not aliased at wavenumbers
 $|k|< N/3$ (Orszag Reference Orszag1971). However, the nonlinear convective term still involves aliased wavenumbers in the range
 $N/3 <|k|\le N/2$, and these are removed once the convolution sum is transformed back to Fourier space by setting to zero the amplitudes associated with
 $|k|\ge N/3$. The algorithm sketched above, the
 $2/3$ rule, is very well known, and is the basis of the majority of pseudo-spectral codes.
Having summarized the de-aliasing procedure for the  $2/3$ rule, we may now present the issue that arises when computing the pressure Hessian. Using the Fourier transform of the velocity field, namely
 $\hat {u}_i=\mathcal {F}[u_i]$, the de-aliased pressure Hessian is computed as
 \begin{gather} {C_{pq}} = \mathcal{F}^{-1}\left[\hat{u}_pB_{1/3}\right] \mathcal{F}^{-1}\left[\hat{u}_qB_{1/3}\right], \end{gather}
 \begin{gather}H_{ij}^P = \mathcal{F}^{-1}\left[k_ik_j \frac{k_pk_q}{k^2}\mathcal{F}\left[{C_{pq}}\right]B_{1/3} \right], \end{gather}
where  $\mathcal {F}$ indicates the Fourier transform and
 $B_{1/3}$ is the box function,
 $B_{1/3}(k)=1$ for
 $|k|<N/3$ and zero otherwise. The velocity gradient
 $A_{ij}$ is constructed from
 $\hat{u}_i$ as
 \begin{equation} {A_{ij}} = \mathcal{F}^{-1}\left[k_j \hat{u}_i B_{1/3} \right]. \end{equation}
However, computing  $H_{ij}^P$ and
 $A_{ij}$ in this way violates (B 1), and our data indicate that it may be significantly violated. This issue was pointed out in Cheng & Cantwell (Reference Cheng and Cantwell1996), who noted that the violation arises because when computed in this way,
 $\boldsymbol {A}\boldsymbol {\cdot }\boldsymbol {A}$ effectively contains information at higher wavenumbers than does
 $\boldsymbol {H}^P$. They did not, however, provide a method to address the issue, but simply noted that their results were affected by it.
One way to ensure that (B 1) is satisfied is to apply an additional truncation step when computing  $\boldsymbol {A}\boldsymbol {\cdot }\boldsymbol {A}$, namely
 \begin{equation} A_{ij}A_{lm} = \mathcal{F}^{-1}\left[\mathcal{F}\left[{A_{ij}A_{lm}}\right] B_{1/3} \right], \end{equation}
with  $A_{ij}$ on the right-hand side constructed using (B 3). Using (B 2) and (B 4) satisfies (B 1). However, (B 4) violates the fundamental constraint
 $A_{ij}A_{ij}\geq 0$. This is because the additional truncation in Fourier space described by (B 4) corresponds to the convolution of
 $\boldsymbol {AA}$ with the sinc function in physical space (Beylkin Reference Beylkin1995), and this function takes on negative values. Our data indicate that violations of
 $A_{ij}A_{ij}\geq 0$ through the use of (B 4) can be significant, and therefore this method should be rejected.
In order to satisfy  $A_{ij}A_{ij}\geq 0$ and (B 1), we truncate the Fourier transform of the velocity field at
 $|k|\le N/4$ so that quadratic products such as
 $A_{ij}A_{lm}$ are resolved on the grid, and no additional truncation or de-aliasing is required. Therefore, in our paper, the pressure Hessian is computed using
 \begin{gather} C_{pq} = \mathcal{F}^{-1}\left[\hat{u}_pB_{1/4}\right] \mathcal{F}^{-1}\left[\hat{u}_qB_{1/4}\right], \end{gather}
 \begin{gather}H_{ij}^P = \mathcal{F}^{-1}\left[k_ik_j \frac{k_pk_q}{k^2}\mathcal{F}\left[C_{pq}\right]\right], \end{gather}
together with
 \begin{equation} A_{ij}A_{lm} = -\mathcal{F}^{-1}\left[k_j \hat{u}_i B_{1/4} \right] \mathcal{F}^{-1}\left[k_m \hat{u}_l B_{1/4} \right], \end{equation}
where  $B_{1/4}$ is the box function,
 $B_{1/4}(k)=1$ for
 $|k|\le N/4$ and zero otherwise. Moreover, for consistency, all quantities were computed from the
 $N/4$ truncated velocity field. A consequence of this is that the smallest filtering scale that can be considered in our analysis is
 $\ell _F=2{\rm \pi} /(N/4)\approx 7\eta$.
Appendix C. Results using Gaussian filter
In this paper, we have used the sharp spectral filter for studying the multiscale dynamics of the velocity gradients in turbulence from a strain-rate eigenframe perspective. It is instructive and interesting to see how the results are affected by a different filtering operator. To this end, we present in this appendix a few results computed by employing a Gaussian filter. In particular, we choose the following form of the filtering kernel in Fourier space:
 \begin{equation} \hat{G}(\boldsymbol{k}) = \exp(-k^2 \ell_f^2/12), \end{equation}
where  $k=\|\boldsymbol {k}\|$ denotes wave vector magnitude and
 $\ell _f$ denotes the filter width. Filtering consists of a multiplication in Fourier space, and the filtered field
 $\tilde {\boldsymbol {u}}(\boldsymbol {x},t)$ is computed as (Pope Reference Pope2000)
 \begin{equation} \tilde{\boldsymbol{u}}(\boldsymbol{x},t) = \mathcal{F}^{-1}[ \hat{G}(\boldsymbol{k}) \mathcal{F}[\boldsymbol{u}](\boldsymbol{k},t) ], \end{equation}
where  $\mathcal {F}[\cdot ]$ denotes Fourier transformation. In physical space, this filtering corresponds to convolution of the unfiltered field
 $\boldsymbol {u}$ with a Gaussian kernel. We set
 $\ell _{f} = \ell _{F}$, where
 $\ell _{F}$ is defined in § 3 as the physical space filtering scale corresponding to a spectral cutoff wave number
 $k_{F}$. For consistency with the method employed for the sharp spectral filter described in appendix B, all quantities were computed from the
 $N/4$ truncated velocity field.
Most of the low-order statistics depend weakly on the specific choice of the filtering, while the statistics of the sub-grid stress can depend on the specific choice of the filtering, since the filtering enters the definition of that term itself. The results for the average contributions to the rate of change of the strain-rate eigenvalues with Gaussian filtering, shown in figure 18, display a weak dependence on filtering for all quantities except the sub-grid stress, as compared to figure 1. The average stabilizing effect of  $H_{33}^{\tau *}$ is still observed and also the tendency of
 $H_{22}^{\tau *}$ to hinder the growth of positive intermediate eigenvalues, on average. However, the term
 $H_{11}^{\tau *}$, which for the sharp filtering is on average very small compared to the other terms in the equation, becomes comparable to
 $H_{22}^{\tau *}$.
Gaussian filter results of (a) average and (b) variance of the terms in (2.10b), normalized by the time scale  $\tilde {\tau }$, and plotted as a function of the filtering scale
 $\ell _f/\eta$. Different colours distinguish the various terms, while different line types and symbols refer to different components of those terms.

The results for the average contributions to the rate of change of the eigenframe vorticity components squared computed with Gaussian filtering are shown in figure 19. Again, all average contributions are only weakly sensitive to change from sharp spectral to Gaussian filtering, except sub-grid stress contributions. As an example, in contrast to the sharp spectral filter results, the term  $\varOmega _3^{\tau *}\omega _3^{*}$ becomes on average very small compared to other
 $\varOmega _{i}^{\tau *} \omega _{(i)}^{*}$ terms across all scales.
Gaussian filter results of (a) average and (b) variance of the terms in (4.2), normalized by the time scale  $\tilde {\tau }$, and plotted as a function of the filtering scale
 $\ell _f/\eta$. Different colours distinguish the various terms, while different line types and symbols refer to different components of those terms.

Since the sub-grid stress is expected to be the most sensitive to the properties of the filtering kernel, we now analyse its correlations with pressure Hessian and viscous stress for Gaussian filtering. The correlation between the symmetric part of the sub-grid stress and filtered pressure Hessian for Gaussian filtering is shown in figure 20(a). Consistently with the results for sharp filtering in figure 15(a), the two quantities are negatively correlated, indicating that sub-grid stress and pressure Hessian tend to act on the strain eigenframe components of the velocity gradient in opposite ways. Also, the intermediate principal components  $H_{22}^{\tau *}$ and
 $H_{22}^{P*}$ remain the most correlated. However, the correlation coefficients are quantitatively affected by the shape of the kernel and, in particular, the correlation between the principal components of
 $\boldsymbol {H}^{\tau }$ and
 $\boldsymbol {H}^{P}$ is larger for Gaussian filtering than for sharp filtering. These relatively large correlations have positive implications for modelling, since the same reasoning and modelling approach used for pressure Hessian can apply to the sub-grid stress as well. A modelling strategy is, for example, in terms of tensor function representation (Pennisi & Trovato Reference Pennisi and Trovato1987).
Gaussian filter results of correlation coefficient,  $\psi (X,Y)$ between (a) the sub-grid stress and pressure Hessian and between (b) the sub-grid stress and the symmetric part of the viscous stress, plotted as a function of the filtering length
 $\ell _f/\eta$.

The correlation between sub-grid and filtered viscous stresses for Gaussian filtering is shown in figure 20(b). While the qualitative trends are consistent with the results obtained with sharp filtering in figure 15(b), the correlation between  $H_{11}^{\tau *}$ and
 $H_{11}^{\nu *}$ is positive for Gaussian filtering and slightly negative when a sharp filter is employed. This is in agreement with the changes observed for the average of
 $H_{11}^{\tau *}$ in figure 18 with respect to the results obtained with sharp filtering, shown in figure 1. Moreover, the components
 $H_{21}^{\tau *}$ and
 $H_{21}^{\nu *}$, which are almost uncorrelated for sharp filtering, are weakly correlated when a Gaussian kernel is employed. Despite these differences, the broad qualitative trends of the correlations across the scales with sharp and Gaussian filtering remain similar.
Appendix D. Reynolds number effect for contributions to eigenvalue and vorticity component dynamics
In this appendix, we present the results for contributions to eigenvalue and vorticity component dynamics using a sharp spectral filter for a smaller Taylor Reynolds number of  $Re_{\lambda } = 224$. The simulation parameters can be found in Ireland et al. (Reference Ireland, Bragg and Collins2016a,Reference Ireland, Bragg and Collinsb). Figures 21 and 22 are very similar to results presented in figures 1 and 2 respectively that correspond to the higher
 $Re_{\lambda }$, indicating a weak dependence on the Reynolds number, at least for the range considered. These results also show that the average contributions to the time derivative of the ordered strain-rate eigenvalues and eigenframe vorticity components are well converged and robust statistics, since the same trends and values are obtained for those quantities from completely independent simulations.
(a) Average and (b) variance of the terms in (2.10b), normalized by the time scale  $\tilde {\tau }$, and plotted as a function of the filtering scale
 $\ell _F/\eta$ for
 $Re_{\lambda } = 224$. Different colours distinguish the various terms, while different line types and symbols refer to different components of those terms.

(a) Average and (b) variance of the terms in (4.2), normalized by the time scale  $\tilde {\tau }$, and plotted as a function of the filtering scale
 $\ell _F/\eta$ for
 $Re_{\lambda } = 224$. Different colours distinguish the various terms, while different line types and symbols refer to different components of those terms.