Due to the risk from consuming high fat in diet, consumer preference for low-fat cheese has increased significantly during recent years. However, reduction of fat causes some quality defects including textural, functional and sensory problems in cheese (Fife et al. Reference Fife, McMahon and Oberg1996; Rudan & Barbano, Reference Rudan and Barbano1998; Sipahioglu et al. Reference Sipahioglu, Alvarez and Solano-Lopez1999). Since fat provides a lubricating effect in cheeses during heating (Zisu & Shah, Reference Zisu and Shah2005), some quality problems appear by reducing fat content of cheese. Low- or reduced-fat cheeses have bland, firm, rubbery in texture, defects in color and bitterness and off-flavours (Rodriguez, Reference Rodriguez1998; Sipahioglu et al. Reference Sipahioglu, Alvarez and Solano-Lopez1999). To eliminate the negative effects of removing fat in low-fat cheese production, three main approaches have been followed, including (1) modification in cheese making procedure, (2) use of adjunct starter culture and (3) use of fat replacers (Drake & Swanson, Reference Drake and Swanson1995; Mistry, Reference Mistry2001). Fat replacers, which are water-dispersible, improve the sensory and functional properties of low-fat cheeses by bulking effect associated with moisture retention and give a sense of lubricity and creaminess (Romeih et al. Reference Romeih, Michaelidou, Biliaderis and Zerfiridis2002).
The objective of the study was to evaluate the quality of low-fat Kashar cheese, which is a pasta-filata type and second most popular cheese in Turkey, made with three different fat replacers: Simplesse® D-100, Avicel Plus® CM 2159 and β-glucan. The cheeses made with fat replacers were compared with full-fat and low-fat counterparts as control during 90 d of ripening.
Materials and Methods
Materials
Raw cows' milk was obtained from Cukurova University Research and Application Farm (Adana, Turkey). Freeze-dried mixtures of Lactobacillus delbrueckii subsp. bulgaricus and Streptococcus thermophilus were used as a starter culture with coded Ezal TM081 (Rhodia Food, Sassenage, France). Calf rennet (Ecoren 200, Maysa, Istanbul, Turkey) was used as coagulant. Fat replacers employed were: Simplesse® D-100 (CP Kelco, Co., Denmark), a microparticulated whey protein concentrate; Avicel Plus® CM 2159 (FMC Bio Polymer, Belgium), a microcrystalline mixture of cellulose, sodium carboxymethylcellulose, sucrose, carrageenan; β-glucan, trade name Nutrim (Cereal Products & Food Science Research Unit, NCAUR, ARS, USDA, Peoria, IL, USA), an hydrocolloidal composite. β-Glucan consisted of 15·5 g protein, 1·9 g crude fat, 1·5 g ash, 0·12 g crude fiber, 5·5 g soluble β-glucan, 67·4 g starch and 7·9 g water/100 g (Konuklar et al. Reference Konuklar, Inglett, Felker and Carriere2004).
Cheese making
Three-cheese making trials were carried out for Kashar production using 150 kg raw cows' milk. The cheese milk was divided into five parts; one part (30 kg) was used for full-fat (FF) cheese production as control and the rest (120 kg) was skimmed using a cream separator (Elecrem, France) and the level of fat was reduced to 7 g/kg milk. One part (30 kg) of the milk is used for low-fat (LF) cheese production without fat replacer as control. Then, the other three batches (each is 30 kg) were used for production of low-fat Kashar cheese manufacture using 10 g Simplesse® D-100/kg milk (SL), 10 g Avicel Plus® CM 2159/kg milk (AP) and 4 g β-glucan/kg milk (BG). The fat replacers were added to the cheesemilk, according to the manufacturers' recommendations, at 30°C and mixed, using a high speed blender (IKA, Werke, Germany) for 5 min. Then, all batches were pasteurized in a double-walled stainless-steel vat at 68°C for 10 min and then cooled to 33±1°C. The starter culture (10 g/kg milk) and 0·2 g CaCl2 (food grade)/kg milk were added and the milk was held for about 30 min. When the pH of milk was 6·3, calf rennet was added to coagulate the milk within 45 min. The curd was cut into 1 cm cubes and rested for 10 min. The curd was cooked with increasing temperature from 33 to 40°C gradually (1 deg C per 5 min). A 1/3 portion of whey was removed and the curd was rested for acidification until pH 5·4 (pre-fermentation). The remaining whey was drained and the curd was fermented at ambient temperature until pH 5·1 (actual fermentation). The curd was scalded at 75°C in brine containing 50 g NaCl/l water and put into cylindrical moulds (23 cm diam and 12 cm height). The cheese blocks with weight of ca.4 kg were allowed to form a rind at 15°C for 2 d and the blocks were vacuum packed after slicing into 250 g pieces and were ripened at +4°C for 90 d.
Chemical composition
Cheeses were analysed for chemical composition and pH at 90 d using the method described by Hayaloglu et al. (Reference Hayaloglu, Guven, Fox and McSweeney2005).
Proteolysis
Water–soluble nitrogen (WSN), 12% trichloroacetic acid–soluble nitrogen (TCA–SN) and 5% phosphotungstic acid–osoluble nitrogen (PTA–SN) fractions and total concentration of free amino acids (FAA) in the WSN fractions of the cheeses were determined by the methods described by Hayaloglu et al. (Reference Hayaloglu, Guven, Fox and McSweeney2005).
Lipolysis
The total concentration of free fatty acids (FFA) in the cheeses was determined by titrating the acidity in the cheese fat with 0·05 m–ethanolic KOH (Hayaloglu et al. Reference Hayaloglu, Guven, Fox and McSweeney2005).
Meltability
Meltability of the cheeses was determined after 1, 30, 60 or 90 d ripening according to the method of Poduval & Mistry (Reference Poduval and Mistry1999) with minor modifications: For this purpose, 10 g grated cheese was placed in a test tube (30×250 mm) and packed to form a plug at the bottom of the tube. After marking the cheese height, the tube was covered using aluminium foil and several holes were opened to allow hot gas escape during heating. The test tube was placed vertically in a refrigerator at 4°C for 30 min and then horizontally in an oven heated at 105°C for 60 min. The tube was left to cool for 30 min at room temperature (21°C) on a smooth surface. The distance, the cheese flowed, was measured as meltability in mm.
Texture profile analysis
The textural characteristics of Kashar cheese were analysed at 1, 45 or 90 d ripening for hardness, springiness, cohesiveness and gumminess. Texture profile analysis (TPA) was carried out using the method of Kahyaoglu et al. (Reference Kahyaoglu, Kaya and Kaya2005). TPA tests were performed using a TA.XT2 Texture Analyzer (Texture Technologies Corp., Scarsdale, NY/Stable Microsystems, Godalming, UK) in duplicate. Data collection and calculation were done using the Texture Expert Exceed Version 2V3 (Stable Micro Systems, 1998).
Sensory evaluation
The cheeses were evaluated by seven trained panelists at 90 d ripening for appearance (scale 0–5), texture (scale 0–5), flavour (scale 0–5) and overall acceptability (scale 0–5) according to the procedure described by Koca & Metin (Reference Koca and Metin2004). Water and bread were also provided to the panelists to rinse their mouths between samples.
Statistical analysis
A randomized complete block design which incorporated the five treatments (full-fat control, low-fat control and fat replacer added low-fat variants) and three blocks (trials) was used for analysis of the response variables. Analysis of variance of the randomized complete block design was carried out using a general linear model of SAS® (1995) where the effect of treatment and replicates were estimated for all response variables. Duncan's multiple comparison test was used as a guide for pair comparisons of the treatment means. Differences between treatments that are described subsequently as being significant were determined at least P<0·05.
Results and Discussion
Chemical composition and cheese yield
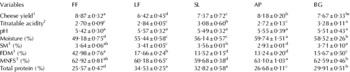
Reduction of fat level in cheese or the use of fat replacers in the manufacture of Kashar cheese significantly influenced gross composition and yield (Table 1). Reduction of fat resulted in a proportional increase in the protein content, which was highest in SL-cheese, since Simplesse® D-100 is a protein-based fat replacer. Moisture content of the low-fat cheeses was higher than FF-cheese; the highest moisture contents were observed in AP and BG cheeses. The water-binding capacity of fat replacers affected the moisture and moisture-in-non-fat substance (MNFS) contents resulting in a higher level of moisture in the cheeses made with fat replacers compared with the FF- or LF-control cheeses. Similar explanations have appeared in previous reports for various cheeses (Katsiari & Voutsinas, Reference Katsiari and Voutsinas1994; Drake et al. Reference Drake, Boylston and Swanson1996; Rudan et al. Reference Rudan, Barbano and Kindstedt1998; Sipahioglu et al. Reference Sipahioglu, Alvarez and Solano-Lopez1999; Romeih et al. Reference Romeih, Michaelidou, Biliaderis and Zerfiridis2002; Zalazar et al. Reference Zalazar, Zalazar, Bernal, Bertola, Bevilacqua and Zaritzky2002; Kavas et al. Reference Kavas, Oysun, Kinik and Uysal2004; Koca & Metin, Reference Koca and Metin2004). Reducing the fat content of cheese milk affected salt-in-moisture (SM) contents of the cheese. AP cheese had significantly lower levels of SM than the other cheeses, probably due to its higher moisture content. Similar observations were made by Rudan et al. (Reference Rudan, Barbano, Yun and Kindstedt1999) and Romeih et al. (Reference Romeih, Michaelidou, Biliaderis and Zerfiridis2002) ; however, Katsiari & Voutsinas (Reference Katsiari and Voutsinas1994) found that no significant effect of fat reduction on the SM contents in Feta cheese. Values for cheese yield are shown in Table 1 and these values are strictly related to the level of fat in cheese milk used. Indeed, the highest and lowest cheese yield was obtained in FF and LF cheeses, respectively. Addition of fat replacer have somewhat increased the cheese yield. When compared with low-fat cheeses, a significant increase in yield for the AP cheese compared with SL- or BG-cheeses was probably attributed to its higher moisture. This result is in agreement with the previous reports (Drake et al. Reference Drake, Boylston and Swanson1996; Sipahioglu et al. Reference Sipahioglu, Alvarez and Solano-Lopez1999; Romeih et al. Reference Romeih, Michaelidou, Biliaderis and Zerfiridis2002).
Cheese yield, chemical composition and pH of Kashar cheeses without fat replacers (FF, Full-fat cheese; LF, Low-fat cheese) or with fat replacers (SL, Low-fat cheese with Simplesse® D-100; AP, Low-fat cheese with Avicel Plus 2159; BG, Low-fat cheese with β-glucan hydrocolloidal composite) at 90 d of ripening
Values are the means±sd for n=three replicate trials

1 Expressed as kg cheese obtained from 100 kg milk
2 Expressed as g lactic acid/100 g cheese
3 SM, Salt-in-moisture; FDM, Fat-in-dry matter; MNFS, Moisture-in-non-fat substance
a,b,c,d Values in the same row having a different letters differ significantly (P<0·05)
Sensory evaluation
Significant differences were noted between full- and low-fat cheeses and addition of fat replacer significantly influenced the sensory attributes of the cheeses (Table 2). The fat replacer added cheeses received significantly lower scores for appearance in comparison with full-fat cheese. Lower scores for appearance in low-fat cheeses than full-fat counterpart may be related to transparent surface due to the lack of fat. Similar observations were made by Rudan et al. (Reference Rudan, Barbano, Yun and Kindstedt1999) for Mozzarella and Koca & Metin (Reference Koca and Metin2004) for fresh Kashar cheeses. Yellowish color is a characteristic for Kashar cheese; however, fat reduction caused a greenish tint in the samples. Full-fat cheese received high scores for texture, while texture scores were lower in LF cheese. Fat replacers improved texture of the cheeses and the SL and AP cheeses received scores relatively closer to full-fat cheese. Significant differences were noted among cheeses in flavour scores and the lowest scores were obtained in BG cheese (P<0·01). Use of β-glucan in Kashar cheese negatively influenced the scores for flavour in the cheese probably due to starchy and bitter or grassy taste of β-glucan which is oat-based hydrocolloidal suspension. Similar results were observed by Konuklar et al. (Reference Konuklar, Inglett, Felker and Carriere2004) for Cheddar and Volikakis et al. (Reference Volikakis, Biliaderis, Vamvakas and Zerfiridis2004) for white-brined cheeses. The other fat replacer added cheeses (SL or AP) received scores closer to full-fat cheese. Also, overall acceptability of BG cheese was significantly lower than in any of the other cheeses (P<0·01). The FF cheese was awarded as the best cheese and overall acceptability scores of SL or AP cheeses higher than LF or BG cheeses.
Sensory properties during ripening of Kashar cheese made with or without fat replacers at 90 d of ripeningFootnote 1
Values are the means±sd for n=three replicate trials

1 See Table 1 for details of replacers and cheese types
a,b,c Values in the same row having a different letters differ significantly (P<0·05)
Meltability
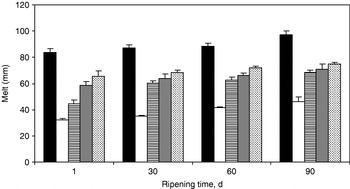
The meltability value was highest in FF cheese during ripening, reflecting that the meltability in Kashar cheese decreased as the fat level decreased (Fig. 1). Similar results were observed for Mozzarella (Tunick et al. Reference Tunick, Malin, Smith, Shien, Sullivan, Mackey and Holsinger1993; Rudan et al. Reference Rudan, Barbano, Yun and Kindstedt1999) and fresh Kashar (Koca & Metin, Reference Koca and Metin2004) cheeses. Reduction of fat resulted in a decrease in meltability (P<0·01); this is not surprising because fat plays a lubricant role between protein matrixes. Absence of fat in cheese may prevent flow of proteins and retard movement of cheese when it was heated (McMahon et al. Reference McMahon, Alleyne, Fife and Oberg1996; Koca & Metin, Reference Koca and Metin2004). Addition of fat replacers to cheese milk improved the meltability of low-fat Kashar cheeses; higher values of meltability were measured in fat replacer added cheeses than LF cheese (Fig. 1). Cheese made using β-glucan had the highest meltability values, suggesting that starch present in β-glucan composite played a lubrication role allowing protein strands to flow easily. The meltability of all cheeses continuously increased by age as observed by other researchers (Tunick et al. Reference Tunick, Malin, Smith, Shien, Sullivan, Mackey and Holsinger1993; Fife et al. Reference Fife, McMahon and Oberg1996; Rudan et al. Reference Rudan, Barbano, Yun and Kindstedt1999). This trend can be linked to degradation of αs1-casein due to proteolysis in cheese matrix (Lawrence et al. Reference Lawrence, Creamer and Gilles1987; Fox et al. Reference Fox, Guinee, Cogan and McSweeney2000).
Mean values with ±SD of melting of Kashar cheeses made with full-fat milk (solid bar), low-fat containing without fat replacer (open bar), low-fat milk containing Simplesse® D-100 (horizontally striped bar), Avicel Plus CM 2159 (gray bar), and β-glucan (punctuated bar).

Texture profiles
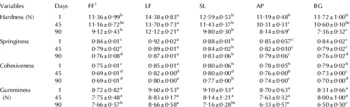
The TPA profiles of the samples indicated that the fat contents of cheese have a crucial role in development of texture; that is, the reduction of fat in cheese has inversely influenced the cheese texture (Katsiari & Voutsinas, Reference Katsiari and Voutsinas1994; Bryant et al. Reference Bryant, Ustunol and Steffe1995; Rudan et al. Reference Rudan, Barbano, Yun and Kindstedt1999; Volikakis et al. Reference Volikakis, Biliaderis, Vamvakas and Zerfiridis2004; Kahyaoglu et al. Reference Kahyaoglu, Kaya and Kaya2005). Fat globules are entrapped in the protein matrix and provide smoothness and softer texture (Romeih et al. Reference Romeih, Michaelidou, Biliaderis and Zerfiridis2002). Fat replacers used in this study were water-soluble compounds and when they added to cheese milk, water is bound in cheese due to their polar nature. Water plays a plasticizer role between the protein molecules, making the cheese softer (Drake & Swanson, Reference Drake and Swanson1995). Hardness, which is a measure of the amount of force required to compress the sample, continuously decreased as ripening progressed (Table 3), probably due to breakdown of αs1-casein into lower molecular weight peptides in cheese and hydration of the protein matrix. These decreases were also observed by other researchers (Lawrence et al. Reference Lawrence, Creamer and Gilles1987; Fenelon & Guinee, Reference Fenelon and Guinee2000; Zisu & Shah, Reference Zisu and Shah2005). The low-fat cheese without fat replacer had the highest hardness values during ripening (P<0·01). This can be attributed to its higher protein and lower moisture contents than those of other low-fat cheeses with fat replacers. Hardness values in FF cheese were significantly lower than low-fat cheese. All cheeses had similar hardness values at 1 d ripening. During ripening, AP and BG cheeses exhibited a similar trend being less hard that SL cheese 45 or 90 d. The relationship between AP and BG samples may be linked to their MNFS contents which were identical (see Table 1). Avicel Plus® CM 2159 and β-glucan are microcrystalline cellulose and the Avicel plus® CM 2159 forms a three-dimensional matrix in water at any temperature. In addition, the structure of β-glucan is (1→3) (1→4) – β-D-glucan with cellulose-like portions linked through (1→3) glycosidic bonds, which make it more soluble. However, Simplesse® D100 is a microparticulated whey protein concentrate. Consequently, the hardness values in AP and BG cheeses were not higher than SL cheese. In general, reduction of fat from cheese caused a harder texture (an increase in the hardness value) in cheese, while use of fat replacer caused a decrease in the hardness value as in various types of cheese such as Feta or White-brined (Sipahioglu et al. Reference Sipahioglu, Alvarez and Solano-Lopez1999; Romeih et al. Reference Romeih, Michaelidou, Biliaderis and Zerfiridis2002; Volikakis et al. Reference Volikakis, Biliaderis, Vamvakas and Zerfiridis2004), fresh Kashar (Koca & Metin, Reference Koca and Metin2004) and Cheddar (Drake et al. Reference Drake, Boylston and Swanson1996; Fenelon & Guinee, Reference Fenelon and Guinee1997; Konuklar et al. Reference Konuklar, Inglett, Felker and Carriere2004).
Textural parameters during ripening of Kashar cheese made with or without fat replacersFootnote 1
Values are the means±sd for n=three replicate trials

1 See Table 1 for details of replacers and cheese types
a,b,c,d Values in the same row having a different letters differ significantly (P<0·05)
Springiness or elasticity is the degree of recovery of a deformed piece of cheese after the deforming force is removed (Fox et al. Reference Fox, Guinee, Cogan and McSweeney2000). Springiness in Kashar cheeses decreased with age and the highest springiness value was obtained in LF cheese throughout ripening. Reduction of fat in cheese increased the springiness values in Kashar cheese as in Mozzarella cheese (Tunick et al. Reference Tunick, Malin, Smith, Shien, Sullivan, Mackey and Holsinger1993). At all ripening times the differences in springiness values between FF and LF control cheeses were significant (P<0·01). Use of AP and BG in low-fat Kashar cheese improved the texture of cheeses. These are microcrystalline cellulose-based fat replacers and can bind some water among casein network. SL cheese showed a different trend during ripening and its springiness values were higher than the AP or BG cheeses. Simplesse® D100 might form a gel with proteins and differences in the springiness values could be explained by the different behaviour of each fat replacer during cheesemaking. The values for springiness in Kashar cheese correlated well with the hardness values. Similar correlation was found by Kahyaoglu et al. (Reference Kahyaoglu, Kaya and Kaya2005) for Gaziantep cheese.
Cohesiveness is the extent to which a cheese can be deformed before it ruptures or ratio of area on second compression to that on first compression (Fox et al. Reference Fox, Guinee, Cogan and McSweeney2000). Cohesiveness values in Kashar cheeses decreased during ripening, suggesting a role of softening somewhat due to proteolysis. Reduction of fat significantly increased the cohesiveness values in the cheeses; the highest and lowest cohesiveness values were observed in LF and FF cheeses, respectively (Table 3). Values are related to protein contents; the higher protein content of cheese, the higher is the cohesiveness value. These results were also observed by others (Bryant et al. Reference Bryant, Ustunol and Steffe1995; Rudan et al. Reference Rudan, Barbano, Yun and Kindstedt1999; Stevens & Shah, Reference Stevens and Shah2002; Kahyaoglu et al. Reference Kahyaoglu, Kaya and Kaya2005). Addition of fat replacers made a positive contribution to the cohesiveness values of cheese. BG cheese had the lowest cohesiveness values within fat replacer added cheeses at d 45 or 90 and the BG cheese had similar cohesiveness values to FF cheese. However, Konuklar et al. (Reference Konuklar, Inglett, Felker and Carriere2004) observed that the use of β-glucan in the manufacture of low-fat Cheddar cheese had no significant effect on cohesiveness values.
Gumminess is defined as the energy required to disintegrate a piece of cheese to a state ready for swallowing (Kahyaoglu et al. Reference Kahyaoglu, Kaya and Kaya2005). Removing fat from cheese resulted in an increase in gumminess values. Highest gumminess values were obtained in LF cheese and these values decreased throughout ripening (Table 3). Significant differences were seen at 90 d ripening (P<0·05). The low-fat cheese with AP or BG had significantly lower gumminess values than full-fat cheese at 90 d. In a study performed by Volikakis et al. (Reference Volikakis, Biliaderis, Vamvakas and Zerfiridis2004) on white-brined cheese, fat replacer added cheeses had lower gumminess values than full-fat white brined cheese.
Proteolysis
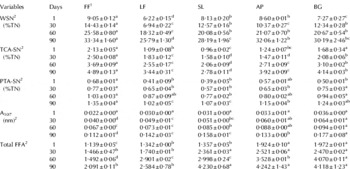
The levels of WSN (%TN) and TCA-SN (%TN) fractions of the cheeses continuously increased in all samples during ripening and significant differences were observed among cheese samples at all sampling time (Table 4). The WSN (%TN) and TCA-SN (%TN) contents in the FF cheese was significantly higher than in any other cheeses. This can be explained by the level of MNFS (Fenelon & Guinee, Reference Fenelon and Guinee2000), since the higher level of moisture in cheese may contribute to the activity of microorganisms and enzymes including residual rennet (Romeih et al. Reference Romeih, Michaelidou, Biliaderis and Zerfiridis2002; Volikakis et al. Reference Volikakis, Biliaderis, Vamvakas and Zerfiridis2004). Significant differences in WSN (%TN) values were noted among the cheeses and the LF-cheese had the lowest WSN (%TN) values throughout ripening. The highest and lowest TCA-SN (%TN) values within low-fat with fat replacer cheeses were observed in BG or SL cheeses, respectively. Volikakis et al. (Reference Volikakis, Biliaderis, Vamvakas and Zerfiridis2004) pointed out that the levels of TCA-SN (%TN) had increased with the increasing levels of β-glucan in white-brined cheese. Rudan et al. (Reference Rudan, Barbano, Yun and Kindstedt1999) and Katsiari & Voutsinas (Reference Katsiari and Voutsinas1994) reported that the lowest proteolysis was observed in low-fat Mozzeralla and Feta cheeses, respectively. These results are in agreement with the results obtained in the present study. However, Romeih et al. (Reference Romeih, Michaelidou, Biliaderis and Zerfiridis2002) found that the low-fat white-brined cheese made with different fat mimetic had higher levels of WSN (%TN) and TCA-SN (%TN) during ripening. The PTA-SN (%TN) values were higher in FF or BG cheeses during ripening and other cheeses (LF, SL and AP) had identical levels of PTA-SN (%TN) during ripening. The parallel changes occurred during ripening in the PTA-SN (%TN) and A507 values (Table 2). Similar discussions were made by Hayaloglu et al. (Reference Hayaloglu, Guven, Fox and McSweeney2005) for Turkish White-brined cheese and Pavia et al. (Reference Pavia, Trujillo, Guamis and Ferragut2000) for Manchego cheese.
Indices of proteolysis (WSN, TCA-SN, PTA-SN or A507) and lipolysis (total FFA) during ripening of Kashar cheese made with or without fat replacersFootnote 1
Values are the means±sd for n=three replicate trials

a,b,c,d Values in the same row having a different letters differ significantly (P<0·05)
1 See Table 1 for details of replacers and cheese types
2 WSN, Water-soluble nitrogen; TCA-SN, 12% trichloroacetic acid-soluble nitrogen; PTA-SN, 5% phosphotungstic acid-soluble nitrogen; A507, absorbance at 507 nm; FFA, free fatty acid which expressed as % oleic acid/g of cheese fat
Total FFA
The extent of lipolysis in Kashar cheese samples increased during ripening (Table 4), suggesting an extensive lipolysis in cheese fat. Significant differences between samples were observed at each sampling time. Fat reduction in the cheese milk increased the total FFA concentration in fat replacer Kashar cheese, reflecting their higher moisture contents than full-fat cheese. Similar relationship between fat replacer and full-fat or low-fat cheeses was observed in low-fat Feta (Katsiari & Voutsinas, Reference Katsiari and Voutsinas1994) and low-fat white-brined (Romeih et al. Reference Romeih, Michaelidou, Biliaderis and Zerfiridis2002; Kavas et al. Reference Kavas, Oysun, Kinik and Uysal2004) cheeses. When comparing fat replacer added cheeses, the concentration of total FFA was higher in BG cheese during 60 d ripening; however, no significant differences were noted between fat replacer added cheeses at 90 d.
Fat reduction in Kashar cheese increased moisture and protein contents and hardness value of cheese. The yield and extent of proteolysis and lipolysis increased in low-fat cheeses by addition of fat replacer in comparison with their low-fat counterpart. Reducing the fat content in Kashar cheese production increased the hardness, springiness, cohesiveness and gumminess and decreased the meltability values. The β-glucan added cheese showed better melting within fat replacer added group, but β-glucan addition negatively influenced the appearance, flavour and texture points of the cheese. The results showed that Avicel Plus® CM 2159 proved a greater improvement in the quality of low-fat Kashar cheese rather than Simplesse® D-100 or β-glucan.
This work was supported by a grant from Cukurova University Academic Research Projects Unit (Project No. ZF.2003.BAP.3).