


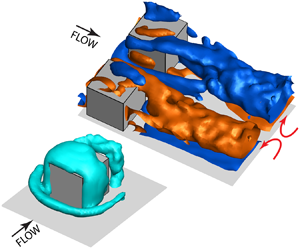



1. Introduction
Turbulent boundary layers over rough surfaces are abundant in the natural environment and in a variety of engineering applications. Numerous studies have already investigated the effects of roughness shape, arrangement, density and dimensions on the mean velocity profiles and turbulence statistics in the boundary layer. The frequently discussed similarity hypothesis assumes that the flow structure in the outer region is independent of the particular roughness geometry, and resembles that of a smooth-wall turbulent boundary layer with proper scaling (Townsend Reference Townsend1976; Raupach, Antonia & Rajagopalan Reference Raupach, Antonia and Rajagopalan1991). According to Jiménez (Reference Jiménez2004), this hypothesis is valid when the rough-wall turbulent boundary layer is ‘well characterized’, which requires that both  $k^+=kU_{\tau }/\nu$ and
 $\delta /k$ have large values, typically
 $k^+>50$ and
 $\delta /k>40$. Here,
 $k$ is the roughness scale,
 $U_{\tau }$ is the friction velocity,
 $\nu$ is the kinematic viscosity and
 $\delta$ is the boundary layer thickness. Closer to the wall, in the so-called roughness sublayer, the flow is directly affected by the roughness elements, hence it exhibits significant spatial heterogeneity. The thickness of this layer typically extends from the wall up to 2k–5
 $k$. Numerous studies have examined the validity of the similarity hypothesis and range of the well-characterized conditions, too many to summarize here. Some have supported it (e.g. Bakken et al. Reference Bakken, Krogstad, Ashrafian and Andersson2005; Flack, Schultz & Connelly Reference Flack, Schultz and Connelly2007; Squire et al. Reference Squire, Morrill-Winter, Hutchins, Schultz, Klewicki and Marusic2016), but others have shown that the criteria are not universal and depend on the roughness geometry, e.g. for cubic and two-dimensional (2-D) roughness (Krogstad & Antonia Reference Krogstad and Antonia1999; Lee, Sung & Krogstad Reference Lee, Sung and Krogstad2011; Volino, Schultz & Flack Reference Volino, Schultz and Flack2011; Choi et al. Reference Choi, Hwang, Lee and Lee2020). Knowledge of the specific flow structures generated, as the roughness elements interact with the boundary layer, is necessary for understanding how momentum and turbulence are generated and transported away from the near-wall region. Yet, many of the questions related to the interaction between roughness and the boundary layer have still not been answered satisfactorily. Therefore, improved understanding, modelling and control of the roughness impact require detailed investigations of the inner part of the roughness sublayer, namely the flow around individual roughness elements. Such understanding might lead to improved predictions of e.g. drag and noise in engineering applications (Devenport et al. Reference Devenport, Alexander, Glegg and Wang2018; Wu, Christensen & Pantano Reference Wu, Christensen and Pantano2020), as well as heat and mass transfer in urban and vegetation canopies in the atmospheric boundary layer.
Performing fully resolved measurements or simulations in a boundary layer while maintaining both high  $k^+$ and
 $\delta /k$ is a challenging task (Hong, Katz & Schultz Reference Hong, Katz and Schultz2011; Piomelli Reference Piomelli2019). Nevertheless, recent numerical investigations have provided valuable insights into the flow structures in the roughness sublayer. Since the present study focuses on cubic roughness elements, the following summary of numerical studies is limited to those involving this geometry. More general reviews of this topic can be found in e.g. Krogstad & Antonia (Reference Krogstad and Antonia1999), Jiménez (Reference Jiménez2004) and Marusic et al. (Reference Marusic, McKeon, Monkewitz, Nagib, Smits and Sreenivasan2010). Direct numerical simulation (DNS) has been employed to study the flow over an array of relatively large cubes (
 $\delta /k=8$) by Coceal et al. (Reference Coceal, Dobre, Thomas and Belcher2007) and Leonardi & Castro (Reference Leonardi and Castro2010). Direct numerical simulation studies have also been conducted at
 ${\textit{Re}}_{\tau }\sim 450$ (
 ${\textit{Re}}_{\tau }=\delta U_\tau /\nu$, where
 ${\textit{Re}}_{\tau }$ is the friction Reynolds number) in developing boundary layers over periodically aligned and staggered cubic roughness elements of varying height, spatial arrangement and
 $\delta /k$ ranging from approximately 16 to 285 (Lee et al. Reference Lee, Sung and Krogstad2011; Ahn, Lee & Sung Reference Ahn, Lee and Sung2013; Choi et al. Reference Choi, Hwang, Lee and Lee2020). They show that the cubic roughness significantly modifies the near-wall high- and low-momentum streamwise streaks. Yang et al. (Reference Yang, Xu, Huang and Ge2019) use large eddy simulation (LES) and DNS to characterize the flow over sparsely distributed staggered and aligned roughness cubes with
 $\delta /k =3.5$ and
 ${\textit{Re}}_{\tau }=350$. They show that secondary flow structures generated by the cubes have a significant effect on the drag coefficients. Yang & Wang (Reference Yang and Wang2013) use LES to study the noise generated by arrays of hemispherical, cuboid and cylindrical roughness elements with
 $\delta /k =8$ and
 ${\textit{Re}}_{\tau }=1307$. Their results show the important role of flow separation and reattachment associated with shapes with sharp frontal edges, e.g. cubes, in the generation of noise.
There are limited experimental data on the flow in the inner part of rough wall boundary layers, especially in regions located below the roughness height. Light reflection from the wall and the complex three-dimensional (3-D) motions with high velocity gradient introduce major difficulties. Most of the available data are based on point or planar measurements. For example, using 3-component laser Doppler velocimetry, George (Reference George2005) provides data for the velocity profile and turbulence below the top of circular cylindrical roughness for  $\delta /k$ in the 25 to 100 range and
 ${\textit{Re}}_{\tau }=2400$. Particle image velocimetry (PIV) has been widely used in recent years (Westerweel, Elsinga & Adrian Reference Westerweel, Elsinga and Adrian2013). For example, Hong et al. (Reference Hong, Katz and Schultz2011, Reference Hong, Katz, Meneveau and Schultz2012) have studied the near-wall flow over pyramidal roughness with
 $\delta /k=50$ and
 ${\textit{Re}}_{\tau }>3500$ in a refractive index-matched facility. The formation of U-shaped vortices wrapping around the roughness elements with their quasi-streamwise legs extending downstream has been conjectured based on interpretation of the 2-D data in multiple planes. These observations have been subsequently confirmed by 3-D measurements using digital holographic microscopy (Talapatra & Katz Reference Talapatra and Katz2012, Reference Talapatra and Katz2013). Understanding how the legs of these vortices interact and their effect on the wall-normal momentum transport has been one of the initial motivations of the present work. Stereoscopic PIV has been used to investigate the impact of secondary flow structures in the roughness sublayer induced by random roughness (
 $\delta /k\sim 22$,
 ${\textit{Re}}_{\tau }\sim 5000$) on the flow structure and turbulence (Mejia-Alvarez & Christensen Reference Mejia-Alvarez and Christensen2013; Barros & Christensen Reference Barros and Christensen2014). The PIV-based statistics of mean velocity, turbulent kinetic energy, Reynolds stresses and spatial correlations for the roughness sublayer above and between tightly packed cubic roughness elements have also been reported in Reynolds & Castro (Reference Reynolds and Castro2008), Takimoto et al. (Reference Takimoto, Sato, Barlow, Moriwaki, Inagaki, Onomura and Kanda2011) and Blackman et al. (Reference Blackman, Perret, Calmet and Rivet2017).
The flow around isolated large cubes has been widely used as a canonical configuration for investigating 3-D separated flows and for benchmarking numerical predictions. A number of experimental and computational studies have revealed the constituent flow structures, including the horseshoe vortex wrapped around the cube, the arch-type vortex in the recirculation region behind the cube and the separated flows on the surfaces (Martinuzzi & Tropea Reference Martinuzzi and Tropea1993; Hussein & Martinuzzi Reference Hussein and Martinuzzi1996; Yakhot, Liu & Nikitin Reference Yakhot, Liu and Nikitin2006; Lim, Thomas & Castro Reference Lim, Thomas and Castro2009; Diaz-Daniel, Laizet & Vassilicos Reference Diaz-Daniel, Laizet and Vassilicos2017). These studies have shown that turbulence level of the incoming flow,  $\delta /k$, and the Reynolds number affect the flow structure surrounding the cube and its wake region (Castro & Robins Reference Castro and Robins1977; Hearst, Gomit & Ganapathisubramani Reference Hearst, Gomit and Ganapathisubramani2016; Diaz-Daniel et al. Reference Diaz-Daniel, Laizet and Vassilicos2017). Essentially, all of this work involves large cube relative to the boundary layer thickness, namely
 $\delta /k<10$, hence it should be categorized as the flow over obstacles, which is typically relevant for the atmospheric boundary layer. The measurements typically involve one-dimensional (1-D) and 2-D techniques as well as surface flow visualizations aimed at interpreting the complex 3-D flow structures (Castro & Robins Reference Castro and Robins1977; Martinuzzi & Tropea Reference Martinuzzi and Tropea1993; Sousa Reference Sousa2002). Recently, time-resolved 3-D tomographic imaging combined with shake-the-box particle tracking has been applied to measure the time-resolved and mean flow structures around a discrete cube with the size equal to the boundary layer thickness (Schröder et al. Reference Schröder, Willert, Schanz, Geisler, Jahn, Gallas and Leclaire2020).
To the best of our knowledge, there are no 3-D experimental data on the flow structure around roughness elements in general, and cubic ones in particular, embedded in the inner part of turbulent boundary layers, namely high  $k^+$ and
 $\delta /k$. To understand what kind of flow structures are generated around such elements, and how structures associated with neighbouring elements interact, the present paper focuses on detailed measurements of the turbulent channel flow around an isolated pair of cubic roughness elements with
 $k^+=91$ and
 $\delta /k=25.4$ (i.e.
 ${\textit{Re}}_{\tau \infty }=2300$). This study has been motivated initially by the possibility that U-shaped horseshoe vortices generated by neighbouring elements interact to affect the wall-normal momentum transport (Hong et al. Reference Hong, Katz, Meneveau and Schultz2012; Talapatra & Katz Reference Talapatra and Katz2012). Since the flow induced by neighbouring streamwise vortices is expected to intensify with decreasing distance between them, the present experiments have been performed for varying cube spacings. Owing to the stringent spatial resolution requirements, the measurements are performed using microscopic dual-view tomographic holography (M-DTH) (Gao & Katz Reference Gao and Katz2018). The data presented in this paper focus on the mean flow structure. Among the many findings, the data resolve: (i) the open-type separated flows along the surfaces of the cubes, (ii) the origin and evolution of the vortices around the cube and its near wake, (iii) the interactions among the multiple streamwise-aligned vortical structures, (iv) the impact of the flow structure on the distributions of wall shear stresses, (v) flow blockage and channelling and (vi) the effect of cube spacing on these phenomena. The experimental set-up and measurement techniques are presented in § 2, followed by presentation and discussion of results in § 3, and conclusions in § 4.
2. Experimental set-up and measurement techniques
2.1. Test facility
The experiments have been performed in an index-matched channel flow facility, where the channel walls and the cubes are made of acrylic whose refractive index is matched with that of the fluid, a concentrated aqueous solution of sodium iodide. The specific gravity of the fluid is 1.8, and its kinematic viscosity is  $1.1\times 10^{-6}$ m
 $^2$ s
 $^{-1}$. Detailed descriptions of this facility are documented in several previous publications (Hong et al. Reference Hong, Katz and Schultz2011; Bai & Katz Reference Bai and Katz2014; Joshi, Liu & Katz Reference Joshi, Liu and Katz2014; Zhang et al. Reference Zhang, Wang, Blake and Katz2017). The relevant part of this facility, including the settling chamber, the converging nozzle, the 3.3 m long
 $203.2\ \textrm {mm}\times 50.8\ \textrm {mm}$ cross-section channel and the diffuser are illustrated in figure 1. The channel walls are smooth except for the pair of cubes mounted on the bottom surface 2.6 m downstream of the entrance. During all the present tests, the channel has been operated at the same mean centreline velocity,
 $U_c=2.5$ m s
 $^{-1}$, as that in Zhang et al. (Reference Zhang, Wang, Blake and Katz2017). Based on velocity measurements described in that paper, the mean flow sufficiently far upstream of the cubes is a fully developed turbulent channel flow with
 ${\textit{Re}}_{\tau \infty }=hU_{\tau \infty }/\nu =2300$, corresponding to
 $\delta _{\nu \infty }=11\ \mathrm {\mu }$m, i.e.
 $U_{\tau \infty }=\nu /\delta _{\nu \infty }=0.1$ m s
 $^{-1}$. The pair of cubes are aligned in the spanwise direction and have a nominal height (
 $a$) of 1 mm, corresponding to 91
 $\delta _{\nu \infty }$ or 3.9 % of
 $h$, where
 $h$ is the half-channel height. The experiments have been performed for cubes separated nominally by
 $\lambda =1.0a$, 1.5
 $a$ and 2.5
 $a$. The selected spacing is based on previously reported distance of 0.79
 $a$ between horseshoe legs and the cube sidewall at the cube's trailing edge (Yakhot et al. Reference Yakhot, Liu and Nikitin2006). Hence, the present widest gap (2.5
 $a$) would leave a space of approximately 1.0
 $a$ between vortices, not accounting for channelling effects, presumably resulting in a relatively weak interaction between legs. In contrast, the smallest gap is expected to force the two legs close to each other, hence induce significantly stronger interactions. Furthermore, the selected spacings also fall into the range where DNSs by Leonardi & Castro (Reference Leonardi and Castro2010) show that varying the spacing should cause significant variations in near-wall flow structure and distribution of skin friction. Each pair of cubes is machined as part of a 110 mm diameter disk that is flush mounted in the channel window. Parallel alignment of the cubes has been verified by comparing the alignment of the cube surface to the flow direction, by the nearly zero lateral flow crossing the
 $z=0$ plane and by the symmetric distribution of wall shear stresses with respect to this plane (discussed later in § 3). Precision measurements of the cube shapes have shown that because of machining errors, the actual dimensions of the cube and spacing differ slightly from the nominal values. Hence, they are listed in table 1 as
 $a_{ij}$, where
 $i$ refers to the cube spacing, and
 $j$ to the direction, with
 $x$,
 $y$ and
 $z$ corresponding to the streamwise, wall-normal and spanwise directions, respectively. In the rest of the paper, all the dimensions are normalized by the respective cube scales in the corresponding directions, so all the cubes appear to have the same size in comparative plots. Appropriately concentrated particle seeding is required for resolving the flow structure at scales that are much smaller than that of the cube. Hence, as illustrated in the top-left inset of figure 1 and following Sheng, Malkiel & Katz (Reference Sheng, Malkiel and Katz2008), Talapatra & Katz (Reference Talapatra and Katz2013) and Ling et al. (Reference Ling, Srinivasan, Golovin, McKinley, Tuteja and Katz2016), the 2
 $\mathrm {\mu }$m tracer particles have been injected locally at a very low speed (0.03
 $U_c$) from a series of 100
 $\mathrm {\mu }$m injection ports located 330 port diameters upstream of the cubes. This low injection speed and large distance to the sample volume have been chosen to have negligible effects on the flow and turbulence in the sample volume based on prior experience under similar conditions. In Sheng et al. (Reference Sheng, Malkiel and Katz2008) and Sheng, Malkiel & Katz (Reference Sheng, Malkiel and Katz2009), it is shown for a smooth wall channel flow that the velocity profile and all Reynolds stress components agree very well with DNS data, and Talapatra & Katz (Reference Talapatra and Katz2012, Reference Talapatra and Katz2013) show agreement between mean velocity profiles measured using digital holographic microscopy with similar local seeding and data obtained using 2-D PIV with global seeding for a rough-wall boundary layer.
The experimental set-up, including the channel, the pair of cubes with varying spacing mounted on the bottom wall and the local particle injection system. Adapted with permission from Gao & Katz (Reference Gao and Katz2018) © The Optical Society.

Precise dimensions ( $a_{ij}$) of and spacing (
 $\lambda _{i}$) between the cubes.

2.2. Measurement techniques and data processing
In general, to perform volumetric 3-D velocity measurements, one has the option of using either tomographic PIV together with shake-the-box particle tracking (Schröder et al. Reference Schröder, Willert, Schanz, Geisler, Jahn, Gallas and Leclaire2020), or M-DTH (Gao & Katz Reference Gao and Katz2018). The optical set-up for tomographic PIV typically involves four cameras aligned in different directions, a relatively large field of view (FOV) and moderate to low magnification. The latter is needed for maintaining a depth of field that covers the entire width of the sample volume. In contrast, holographic microscopy is particularly suitable for high resolution measurements near boundaries, where the sample volume can be observed at magnifications ranging between 4X to 20X. The shallow depth of focus of the microscope objectives is compensated by recording and reconstructing the hologram to obtain a 3-D particle field (Katz & Sheng Reference Katz and Sheng2010). Hence, this method is particularly suitable for the present application, where the entire FOV is a few cubic millimetres, and the required spatial resolution is tens of microns.
The dual beam microscopic digital holography system used for the detailed velocity measurements is illustrated in figure 2, and described in detail in Gao & Katz (Reference Gao and Katz2018). Owing to the inherent depth-of-focus problem of conventional single-view holographic tracking (Katz & Sheng Reference Katz and Sheng2010), preliminary tests performed during early phases of the present project have shown that single-view imaging is not accurate enough for resolving fine details of the 3-D flow around the cube. Hence, we have developed and implemented the M-DTH system (Gao & Katz Reference Gao and Katz2018). The optical set-up consists of two inclined in-line holography systems. Data processing consists of the following steps: (i) precision mapping of the two sample volumes onto each other using a 3-D self-calibration procedure. Based on analysis of noisy synthetic data and experimental particle fields, the mapping uncertainty can be maintained at approximately 1  $\mathrm {\mu }$m; (ii) reconstruction of the two instantaneous 3-D intensity fields, each containing elongated particle traces aligned in the corresponding axial directions of the in-line holography beams; (iii) mapping of the intensity field of one view into the next; (iv) truncating the elongated particle traces by multiplying the two 3-D fields, which reduces the length of the traces to approximately twice the particle diameter as opposed to 5–20 times without truncation; (v) particle detection and matching of the truncated traces in the two exposures based on a series of criteria, following procedures described in Sheng et al. (Reference Sheng, Malkiel and Katz2008) and Talapatra & Katz (Reference Talapatra and Katz2013). These criteria include results of 3-D cross-correlations in local sub-volumes, particle shapes, continuity, constraints on velocity and acceleration, etc.; (vi) measuring the particle displacement and using first-order singular value decomposition (SVD) (Sheng et al. Reference Sheng, Malkiel and Katz2008) for mapping the unstructured velocity distribution onto a regular grid.
The M-DTH set-up consisting of two inclined microscopic inline holography systems, with the sample volume located in the region where the beams intersect. The three FOVs are shown on the bottom right. Adapted with permission from Gao & Katz (Reference Gao and Katz2018) © The Optical Society.

To accelerate the extensive data processing, a series of in-house GPU-based codes have been developed, tested and implemented to perform all the processing steps. The fourteen times speed-up achieved by the GPU processing has made the application of M-DTH a feasible tool for processing large amount of data in a timely manner. The present codes, which process a 3-D velocity field in approximately 20 minutes, could be further streamlined to achieve faster rates. Owing to the small FOVs involved, even small (micron scale) distortions introduced by the optical components and the channel windows need to be accounted for. Consequently, a procedure that utilizes the self-calibration results has been developed to determine the 3-D aberration function, i.e. the distortions along the axis of the laser beam, assuming that the in-plane aberrations are negligible. This spatially varying aberration function has been subsequently evaluated based on the known, independently measured, location of the bottom and cube surfaces. Results have shown that the location of these surfaces can be determined to be well within 1  $\mathrm {\mu }$m. This procedure has enables us to position the velocity vectors properly relative to bottom and cube walls.
In the optical set-up illustrated in figure 2, the beam of a double-head Nd:YAG laser (New Wave Solo PIV) is spatially filtered, collimated and split to illuminate the sample volume from two angles. One beam is perpendicular to the channel wall, and the other is nominally inclined at 36 $^{\circ }$ to the wall-normal direction. The region where the two beams overlap is the sample volume, which is shown magnified in the top-right corner. The sample volume size is
 $4.2\ \textrm {mm}\times 2.8\ \textrm {mm}\times 1.5\ \textrm {mm}$ (
 $382\delta _{\nu \infty }\times 255\delta _{\nu \infty }\times 136\delta _{\nu \infty }$) in the streamwise (
 $x$), spanwise (
 $z$) and wall-normal (
 $y$) directions, respectively. The origin of the coordinate system is located on the wall, between front surfaces of the cubes. To cover the entire region of interest, the data have been acquired using three different FOVs for each cube spacing, as illustrated in the bottom-right corner of figure 2. The first, FOV 1, focuses on the space between and behind the cubes; FOV 2 is centred around one of the cubes; and FOV 3 extends up to three cube heights upstream of the cubes. The in-line holograms are recorded at a magnification of 8X using infinity-corrected long-range microscope objectives (MO1 and MO2). The planes of focus, which are indicated by the dashed lines, are located slightly below the sample volume. The holograms are recorded by two identical interline-transfer, CCD cameras (Imperx B6640), which have
 $6600\text{ pixel} \times 4400$ pixel arrays with a pixel size of 5.5
 $\mathrm {\mu }$m, resulting in overall image resolution of 0.69
 $\mathrm {\mu }$m per pixel. The hologram pairs are acquired at a rate of 1.5 Hz with 25
 $\mathrm {\mu }$s delay between exposures.
On average, 1900 hologram pairs have been processed for each spacing and FOV. During segmentation of the 3-D truncated particle traces, the selected threshold of signal-to-noise ratio for identifying a particle in the multiplied intensity fields has been set to 11. This level is approximately 38 % more stringent than that reported in Gao & Katz (Reference Gao and Katz2018). Each hologram typically provides 1700 unstructured vectors. The ensemble-averaged velocity field at each grid point is calculated using first-order SVD to project all the unstructured vectors located within an ellipsoid centred on this point. This projection is weighted based on the exact location of each unstructured vector relative to the grid point, and inherently gives increasing weight with decreasing distance of the unstructured data from the grid point. If not particularly specified, for most of the data presented in this paper, the interpolation volume is a 100  $\mathrm {\mu }$m diameter sphere, and the vector spacing is 60
 $\mathrm {\mu }$m in all directions. The number of unstructured vectors used for determining the velocity at each point is
 $106\pm 49$. The SVD analysis also provides the velocity gradients at each grid point directly (Sheng et al. Reference Sheng, Malkiel and Katz2008; Talapatra & Katz Reference Talapatra and Katz2013). Based on evaluation of the uncertainty in the measurements (see the Appendix), the interpolation volume diameter is increased to 150
 $\mathrm {\mu }$m for calculating the velocity gradients. For both the velocity and its gradients, a median filter of
 $5\times 5\times 5$ points is used for identifying outliers, and replacing them with the average of all the 3-D neighbours. In certain areas, especially near walls, the size and shape of the interpolation volume is adjusted to resolve specific flow features, e.g. separated flows along the cube walls. Here, the semi-axis length in the surface-normal direction is reduced to 10
 $\mathrm {\mu }$m and those in the surface-parallel directions are enlarged to 100
 $\mathrm {\mu }$m, the latter to ensure that the volume contain a sufficient number of unstructured points. In this case, the surface-normal grid spacing is 10
 $\mathrm {\mu }$m, and the surface-parallel one remains 60
 $\mathrm {\mu }$m.
The calculated mean velocity components are denoted as  $U$,
 $V$ and
 $W$ in the
 $x$,
 $y$ and
 $z$ directions, respectively. The mean vorticity components are denoted as
 $\varOmega _x$,
 $\varOmega _y$ and
 $\varOmega _z$, and the wall shear stress tensor components are denoted as
 $\tau _{xy}$,
 $\tau _{yz}$, etc. The methods for evaluating the uncertainty in the present measurements are discussed in the Appendix. The results show that the uncertainty in all the mean velocity components is less than 1 % of the centreline velocity, and that involving velocity gradients, e.g. the vorticity, is approximately 0.18
 $U_c/a$. The uncertainty in the wall shear stresses, which, as noted above, are calculated using different interpolation volumes, is 0.1
 $\rho U^2_{\tau \infty }$.
3. Results
3.1. Flow structures near the surface of the cube
The main vortical structures around one of the cubes for  $\lambda =2.5a$ (widest gap) is visualized by an iso-surface of
 $\varLambda _2$ (Jeong & Hussain Reference Jeong and Hussain1995) in figure 3(a). Corresponding sample vortex lines with the vorticity magnitude colour coded are presented in figure 3(b). They are selected to intersect with the peak vorticity magnitude on the cube mid-
 $x$–
 $y$ plane above and behind the cube as well as with
 $y=0.12a$ far upstream. Distributions of streamlines in wall-normal, spanwise and axial planes coinciding with the middle of the cube are shown in figures 3(c), 3(d) and 3(e), respectively. Contour lines of
 $\varLambda _2$ at the same level as in figure 3(a) are also presented to facilitate a comparison between them. The vortex located upstream of the cube close to the channel wall is part of the horseshoe vortex. It forms as the boundary layer separates and rolls up (figure 3d), presumably owing to the local cube-induced adverse pressure gradient (Simpson Reference Simpson2001). As the horseshoe vortex wraps around the cube, its legs become aligned in the streamwise direction. In the inner side (the one facing the other cube), the swirling motion induced by the horseshoe leg can be seen at
 $z/a_{3z}=-0.75$ in figure 3(e). In the outer side, the leg signature appears as the curved streamlines centred around
 $z/a_{3z}=-3$. Along with these legs, there are a series of other streamwise structures whose origin and interactions among them are discussed later.
Characteristic primary flow structure around one of the cubes for  $\lambda =2.5a$. (a) Iso-surface of
 $\varLambda _2=-$0.1
 $U^2_c/a^2$; and (b) vortex lines colour coded with the vorticity magnitude. (c–e) Selected in-plane streamlines: (c)
 $x$–
 $z$ plane at
 $y/a_{3y}=0.5$, (d)
 $x$–
 $y$ plane at
 $z/a_{3z}=-1.79$ and (e)
 $y$–
 $z$ plane at
 $x/a_{3x}=0.5$. Blue lines: contour of
 $\varLambda _2=-0.1U^2_c/a^2$ showing the intersections with the vortical canopy, arch-like and horseshoe vortices.

A vortex canopy covers the cube and the separated flow regions on its top and side surfaces. The vortex lines indicate that this canopy is dominated by wall-normal vorticity along the inner and outer sides, and by spanwise vorticity above the cube. Consistent with the orientation of the vortex lines, as quantified later, the magnitude of the vorticity associated with the canopy is substantially higher than that of the secondary streamwise structures. The arch-like vortex behind the cube (figure 3a), as referred to by Hussein & Martinuzzi (Reference Hussein and Martinuzzi1996), is located within the separated region there. Its vertical legs and spanwise top are also evident in the sample  $x$–
 $z$ and
 $x$–
 $y$ planes, respectively. Note that the streamlines in figure 3(d) indicate that this separated zone is not a closed ‘bubble’, with the flow passing through its centre exiting above the arch-like vortex. As elucidated later, all the separated zones around the cube are open and involve complex 3-D flow structures. Even for the widest gap, the presence of the neighbouring cube causes significant flow asymmetry. Figure 3(c) demonstrates that the separation regions along the sidewall and behind the cube in the inner side are smaller than those at the outer side. Furthermore, figure 3(e) shows that the flow induced by the horseshoe vortex and other secondary streamwise structures are not symmetric. There is also a net spanwise flow towards the outer side over most of the area surrounding these vortices, which affects the interaction among them further downstream.
The extent of asymmetry induced by the neighbouring cube and its dependence on the spacing are illustrated in figure 4 by a series of  $x$–
 $z$ sections showing the streamlines and distributions of
 $\varOmega _y$. Note that since the cube sizes and locations in these plots are matched, the displayed FOVs differ owing to the slight differences in cube size (table 1), magnification and location of the sample area for the three cases. Several trends are evident. First, at all elevations, the wall-normal vorticity components associated with the canopy and the arch-type vortex are parts of the same pair of continuous vorticial layers. They start near the front surface of the cube, have high peaks outside of the separated regions along its sides and extend well downstream of the arch, where they spread and decay. The magnitude of
 $\varOmega _y$ increases with distance from the channel floor, peaks at
 $y/a_{iy}=0.5\text {--}0.75$ and then decreases near the top of the cube. The trends at low
 $y/a_{iy}$ can be explained by near-wall interactions between the canopy and the secondary streamwise vortices (details follow). Near the top, the wall-normal vorticity transitions to a layer with high spanwise vorticity above the cubes (see figure 5). The flow at the outer side appears to be less affected by the cube spacing. Here, the length and width of the separated regions along the sidewall as well as distribution of
 $\varOmega _y$ appear to be similar for all cases. Near the inner sidewall, the separated region is thinner, and the width of the layer with high
 $\varOmega _y$ decreases with the spacing. Further details on the separated flows over the cube surfaces obtained using thinner interpolation volumes are discussed in the following section and presented in figure 6. The asymmetry is also evident in the relative size of the two legs of the arch-like vortex.
In-plane streamlines in a series of  $x$–
 $z$ planes superimposed on colour contour of
 $\varOmega _ya/U_c$ for (a,d,g,j,m)
 $\lambda =1.0a$; (b,e,h,k,n)
 $\lambda =1.5a$; and (c,f,i,l,o)
 $\lambda =2.5a$. The planes are located at (a–c)
 $y/a=0.025$; (d–f)
 $y/a_{iy}=0.15$; (g–i)
 $y/a_{iy}=0.50$; (j–l)
 $y/a_{iy}=0.75$; (m–o)
 $y/a_{iy}=1.02$. The size of FOV in each column, represented by individual panel size, has been adjusted such that the cubes in each row are aligned and of the same size, to aid comparison among the three cases.

Streamlines in the  $x$–
 $y$ mid-planes superimposed on the colour contour of (a,c,e)
 $\varOmega _za/U_c$ and (b,d, f)
 $U/U_c$. (a,b)
 $\lambda =1.0a$; (c,d)
 $\lambda =1.5a$; and (e, f)
 $\lambda =2.5a$. These mid-planes are located at (a,b)
 $z/a_{1z}=-0.96$; (c,d)
 $z/a_{2z}=-1.27$; (e, f)
 $z/a_{3z}=-1.79$. The size of FOV in each row, represented by individual panel size, has been adjusted such that the cubes in each column are aligned and of the same size, to aid comparison among the three cases.

The streamlines near the wall within the separated regions reveal a series of singular points. The separated flows in front of the cubes visible at  $y/a=0.025$ and
 $y/a_{iy}=0.15$ (figure 4a–f) and in the
 $x$–
 $y$ sample data (figure 5) are associated with the horseshoe vortex rollup. The swirling flows and foci associated with the arch-like vortex behind the cube extend from the channel floor to approximately
 $y/a_{iy}=0.8$ (0.75 is shown), while decreasing in area. A series of saddle points appear on the boundaries and inside the separated regions in front of, behind and on top of the cube. Their locations along with that of the stagnation point on the front surface are listed in table 2. All the positions are presented in their scaled coordinates. The locations of the centres of relevant surfaces are also provided for convenience. As the spacing decreases, the saddle points in front of (
 $S^B_1$) and behind the cube (
 $S^B_2$ and
 $S^B_3$) shift towards the inner side, while those on the top (
 $S^T_1$ and
 $S^T_2$) shift towards the outer side. Here, superscripts
 $B$ and
 $T$ refer to the vicinity of the bottom and the top surface, respectively. These shifts are associated with changes to the mean flow direction. Near the bottom the incoming flow upstream of cube is deflected towards the outer side, presumably by cube-induced blockage, as is particularly evident for the narrowest spacing (figure 4a). It should be noted that saddle points
 $S^B_1$,
 $S^B_2$ and
 $S^B_3$ in the near-wall region have been seen in the DNS results for a single cube by Yakhot et al. (Reference Yakhot, Liu and Nikitin2006). The asymmetry is also noticeable in the near-wall streamlines along the outer perimeter to the sides and behind the cubes, e.g. in the converging streamlines which are associated with interactions of the horseshoe vortices with the outer flow. These patterns along the outer periphery behind a single cube have been reported by Martinuzzi & Tropea (Reference Martinuzzi and Tropea1993), based on experimental surface visualizations, and by Yakhot et al. (Reference Yakhot, Liu and Nikitin2006).
The scaled 3-D coordinates ( $x/a_{ix}$,
 $y/a_{iy}$,
 $z/a_{iz}$) of the front surface stagnation point (ST), the centres of the cube surfaces (
 $C_{s}^{F}$,
 $C_{s}^{I}$,
 $C_{s}^{O}$ and
 $C_{s}^{T}$), the singular points marked in figures 4–6 as well as the streamwise extent of the separation regions in front of (
 $X_{sep}^{F}$) and behind (
 $X_{sep}^{A}$) the cube. The superscripts
 $F$,
 $I$,
 $O$,
 $T$,
 $A$ and
 $B$ refer to the front, inner, outer and top surfaces as well as the arch vortex, and the vicinity of the bottom wall, respectively.

Spanwise vorticity and streamwise velocity distributions in  $x$–
 $y$ cross-sections aligned with the mid-plane of the cube showing the horseshoe vortex, vortical canopy, and the arch-like vortex are presented in figure 5. Several trends are evident: (i) it appears that in this plane, the different gaps between the cubes have limited influence on the spanwise vorticity distribution; (ii) the spanwise vorticity has peaks in the frontal head of the horseshoe vortex, and at the top of the vortical canopy, the latter being consistent with the wall-normal vorticity along the sides of the cube. Further downstream, including in the separated region behind the cube,
 $\varOmega _z$ decreases and appears to be diffused over a broad area, also in accordance with the trends of
 $\varOmega _y$ in top views (figure 4); (iii) upstream, it appears that a substantial fraction of the boundary layer vorticity is entrained into the horseshoe vortex and the much thinner structure in front of it. The height of the latter is 6
 $\delta _{\nu \infty }$, i.e. slightly higher than the viscous sublayer far upstream. While the rollup of a horseshoe vortex ahead of obstacles has been seen before in numerous studies, including those involving large cubes (Hearst et al. Reference Hearst, Gomit and Ganapathisubramani2016; Diaz-Daniel et al. Reference Diaz-Daniel, Laizet and Vassilicos2017), the formation of a second structure farther upstream have mostly been seen under laminar upstream conditions (Diaz-Daniel et al. Reference Diaz-Daniel, Laizet and Vassilicos2017; Schröder et al. Reference Schröder, Willert, Schanz, Geisler, Jahn, Gallas and Leclaire2020). Considering the distance from the wall, laminar-like behaviour should not be surprising; (iv) only a small fraction of the upstream vorticity is located above the streamline leading to the stagnation point on the front surface, hence contributes to the vorticial canopy above the cube. The rapid increase in
 $\varOmega _z$ occurs close to the top front corner of the cube, suggesting that the origin of most of this vorticity, as quantified later, is located along the front surface; and (v) while the reverse flow inside the separated region above the cube can be as high as
 $-$0.15
 $U_c$, owing to blockage effect the velocity at
 $y\sim 1.3a$ is already 0.7
 $U_c$, i.e. the shear strain there is of the order of
 $10^4$ s
 $^{-1}$. This level is comparable to the wall shear strain rate far upstream (
 $U^2_{\tau \infty }/\nu$). In several places, such as under the horseshoe vortex, as well as the bottom parts of the forward face and behind the cube, the fast reverse flow, which can be as high as
 $-$0.2
 $U_c$, generates opposite sign vorticity. The locations of the marked singular points are included in table 2. The height of the stagnation point, ranging from 0.65 to 0.67 cube heights for different spacings, is in good agreement with those reported in Yakhot et al. (Reference Yakhot, Liu and Nikitin2006), Hearst et al. (Reference Hearst, Gomit and Ganapathisubramani2016) and Diaz-Daniel et al. (Reference Diaz-Daniel, Laizet and Vassilicos2017). The heights of the horseshoe head (
 $F^B_1$) and the top of the arch-like vortex (
 $F^A_3$) are similar (differences less than 0.05
 $a$) to those reported based on DNS in Diaz-Daniel et al. (Reference Diaz-Daniel, Laizet and Vassilicos2017).
The flow structure very close to the surfaces of the cube: streamlines in surface-parallel planes and velocity vectors in surface-normal mid-planes superimposed on colour contour of the streamwise velocity; (a–c) 15  $\mathrm {\mu }$m from the outer surface, (d–f) 15
 $\mathrm {\mu }$m from the inner surface and (g–i) 20
 $\mathrm {\mu }$m from the top surface. For (a,d,g)
 $\lambda =1.0a$, (b,e,h)
 $\lambda =1.5a$ and (c,f,i)
 $\lambda =2.5a$. The dash-dot lines correspond to
 $U=0$. The spanwise coordinates of the outer and inner surfaces (
 $z^{O}_i/a_{iz}$ and
 $z^{I}_i/a_{iz}$, respectively) are provided in table 2.

The next discussion focuses on the flow structure very near the cubes’ surfaces. As noted in § 2.2, to resolve these flows, the interpolation ellipsoid is 20  $\mathrm {\mu }$m thick in the surface-normal direction. Figure 6 provides two views for each surface and cube spacing. The wall-parallel views correspond to planes located 15
 $\mathrm {\mu }$m away from sidewalls and 20
 $\mathrm {\mu }$m above the top surface. The wall-normal views show the mid-
 $x$–
 $z$ planes for the sidewalls (i.e.
 $y/a_{iy}=0.5$) and
 $x$–
 $y$ plane crossing the centre of the cubes for the top. Each wall-parallel streamline pattern contains at least one, but in most cases four singular points whose locations are also listed in table 2. The separation lines in the forward parts, where streamlines converge from both sides, have a saddle point in the middle. The latter is labelled as
 $S^O_1$,
 $S^I_1$ and
 $S^T_1$, where the superscripts
 $O$,
 $I$ and
 $T$ refer to the outer, inner and top surfaces, respectively. Attachment lines, where the streamlines diverge, with a saddle point in their centres (
 $S^O_2$,
 $S^I_2$ and
 $S^T_2$) are also evident further downstream. The flow patterns along the outer (figure 6a–c) and inner side (figure 6d–f) appear to be qualitatively similar (except for the narrowest spacing), each featuring a major focus close to the top (
 $F^O_1$,
 $F^I_1$) and a minor one near the bottom (
 $F^O_2$,
 $F^I_2$), in addition to the separation and attachment lines. However, in the inner side, the foci are sources, i.e. the radial velocity component near the centre is positive, and in the outer side, the foci are sinks. The top surfaces have separation lines bounded in both sides by sink-like foci (
 $F^T_1$ and
 $F^T_2$), and what appears to be curved attachment lines that start parallel to sidewalls and end close to the back of the cubes. In all cases and surfaces the separated regions do not form closed ‘bubbles’, i.e. part of the flow circumvents the separation lines and penetrates the separated zones somewhere along the forward side. This observation implies that outlets should also exist somewhere, presumably out of plane. For example, along the inner sides, the flow enters the separated regions from the upstream bottom corner. On the top, the upstream flows penetrate from both sides between the foci and the peripheral attachment line.
To elucidate the complex phenomena involved, figure 7 presents selected 3-D streamlines, with their distance from the relevant surfaces colour coded. Starting from the inner wall (figure 7a,d,g), streamlines originating from the forward surface, turn around the bottom corner and enter the domain located downstream of the separation line. They then turn upward (owing to the flow induced by the streamwise vortices) and subsequently upstream near the middle of the surface, as part of the reverse flow seen in the planar views. These streamlines then spiral away from the wall around the centre of the focus located close to the top of the cube in the planar view, and then leave the separated zones close to the top surface. Other streamlines (not shown) spiral around the bottom focus. Along the outer side (figure 7b,e,h), the trajectories have similar general features although magnitudes and locations differ. One of the selected sample streamlines enters the separated region near the bottom, spirals around the bottom focus away from the wall and then get entrained into the separated zone behind the cube, which is also open. The other enters the vicinity of the surface from the downstream end of the cube, and then circumvent the upper focus before turning downstream. On the top of the cube (figure 7c,f,i), one of the shown streamlines enters the separated region from the side, rotates around the focus, lifts upward upon reaching the front separation line and then turns downstream. The other streamline has a 3-D spiralling trajectory that starts near the focus. These trajectories elucidate the flow phenomena that generate the complex streamline patterns observed in the wall-parallel planes. Subsequent discussions on the evolution of streamwise structures will elucidated some of the causes for these phenomena. Finally, the corresponding surface-normal planes demonstrate the width of the open separated regions, which increase from 20  $\mathrm {\mu }$m to 70
 $\mathrm {\mu }$m with increasing gap for the inner surface but remain at approximately 120
 $\mathrm {\mu }$m for the mid-outer and mid-top planes.
Selected 3-D streamlines, which are entrained into the open-type separation regions for  $\lambda =2.5a$ along the cube's (a,d,g) inner side, (b,e,h) outer side (note the change in orientation) and (c,f,i) top. For (a–c) 3-D perspectives looking at the surface, (d–f) spanwise view and (g–i) top view. The streamlines are colour coded with the distance from the relevant surface.

As mentioned before and demonstrated by selected streamlines presented in figure 8, the separated region behind the cube is also open. The flow enters this region from the lower sides, spirals around the centre of the arch-like vortex while changing its orientation from  $x$–
 $z$ to
 $x$–
 $y$ planes and then leaves at an elevation of about the cube height. Accordingly, the
 $x$–
 $z$ planar views for low elevations (figure 4a–f) show streamlines from both sides of the cube being entrained into the arch legs. Such entrainment does not occur at higher elevations. Similarly, the
 $x$–
 $y$ planes (figure 5a,c,e) show the flow leaving the separated region above the top of the arch. Before concluding this section, it should be noted that occurrence of open separation on all the surfaces is consistent with topologically based kinematic theorems by Hunt et al. (Reference Hunt, Abell, Peterka and Woo1978). They argue that separation regions formed around any 3-D surface-mounted obstacle must be open.
Selected 3-D streamlines, which are entrained into the open-type separation region behind the cube for the  $\lambda =2.5a$. (a) A 3-D perspective, (b) top view and (c) spanwise view. The streamlines are colour coded with the distance from the bottom wall.

3.2. Evolution and impact of streamwise vortices
The next discussion follows the evolution and interactions of streamwise vortices. A series of  $y$–
 $z$ sections showing the distributions of
 $\varOmega _x$ and vectors of (
 $V$,
 $W$) aimed at elucidating the evolution of these structures around and behind the cube are presented in figures 9 and 10, respectively. We have also tried to present the evolution of streamwise structures in terms of swirling strength (not shown), but trends appear to be quite similar to those depicted using the vorticity. As is evident, the cubes are surrounded by multiple vortices, which are labelled for clarity as
 $A$–
 $D$ with superscripts
 $I$ and
 $O$ referring to the inner and outer surfaces, respectively (figure 9l). The counter-rotating legs of the horseshoe vortex that rolls up upstream of the cube (focus
 $F^B_1$ in figure 5a) and persist, at least for a while downstream of it, are labelled as
 $A^{I}$ and
 $A^{O}$. The asymmetry of this legs increases with decreasing cube spacing, with the inner leg being located closer to the side surface and having a higher peak vorticity magnitude than those of the outer leg. Consequently, in the narrowest case, the horseshoe vortex leg associated with the neighbouring cube is also visible in the left-most corner of the plots. Upstream of the front surface, the horseshoe vortices and thin layers with counter-rotating vorticity under them are the only visible structures. As the flow impinges on the front surface, it creates a source-like radial outflow pattern originating from the central stagnation point. The spanwise location of this point is biased towards the inner side and its elevation is approximately 2/3 of the cube's height. Both coordinates are not affected significantly by the spacing (figure 9(d–f) and point ST in table 2). Early signs of counter-rotating secondary vortices, which form between the horseshoe legs and the sidewalls (
 $B^{I}$ and
 $B^{O}$), appear at
 $x/a_{ix}=-0.06$, become distinct downstream the leading edge (figure 9g–i) and reach maximum size at
 $x/a_{ix}=0.24$. With decreasing cube spacing, their peak vorticity magnitude and area (hence presumably their strength) decrease along the inner sides. Additional counter-rotating pairs (
 $C^{I}$/
 $D^{I}$ and
 $C^{O}$/
 $D^{O}$) appear near the top corners immediately downstream of the leading edge (figure 9g–i). The origin and mechanisms affecting the generation and evolution of each of these structures is discussed in the following section.
A series of  $y$–
 $z$ planes showing the distributions of
 $\varOmega _xa/U_c$ superimposed on
 $V$–
 $W$ vectors for (a,d,g,j,m,p,s)
 $\lambda =1.0a$, (b,e,h,k,n,q,t)
 $\lambda =1.5a$ and (c,f,i,l,o,r,u)
 $\lambda =2.5a$. The plane locations are
 $x/a_{ix}=$ (a–c)
 $-$0.24, (d–f)
 $-$0.06, (g–i) 0.04, (j–l) 0.24, (m–o) 0.48, (p–r) 0.90 and (s–u) 1.08. The increment between contour lines is 0.2. The 0-contour line is omitted for clarity. The size of FOV in each column, represented by individual panel size, has been adjusted such that the cubes in each row are aligned and of the same size, to aid comparison among the three cases.

A series of  $y$–
 $z$ planes showing the distributions of
 $\varOmega _xa/U_c$ and in-plane velocity vectors highlighting the evolution of streamwise vortices behind the cubes for (a,d,g,j,m,p)
 $\lambda =1.0a$, (b,e,h,k,n,q)
 $\lambda =1.5a$ and (c,f,i,l,o,r)
 $\lambda =2.5a$. The planes are located at
 $x/a_{ix}=$ (a–c) 1.38, (d–f) 1.74, (g–i) 2.16, (j–l) 2.58 and (m–o) 3.78. Increment between contour lines is 0.1. The 0-contour line is omitted for clarity. (p–r) Corresponding smoothed iso-surfaces of
 $\varOmega _xa/U_c=\pm 0.16$ between and downstream of the cubes. The size of FOV in each column, represented by individual panel size, has been adjusted such that the cubes in each row are aligned and of the same size, to aid comparison among the three cases.

Around  $x/a_{ix}=0.5$, in all cases, the pairs of vortices around the top edges start shifting towards the outer side with the mean lateral flow. In the process, vortex
 $C^{I}$ migrates to the top of the cube (figure 9m–r), and
 $B^{I}$ to the upper inner corner. Furthermore, vortices
 $D^{I}$ and
 $C^{O}$ diffuse (expand and become weaker), and vortex
 $D^{O}$ shifts to the outer top corner and starts merging with
 $B^{O}$ while pushing
 $C^{O}$ away from the surface. The merging process is particularly evident at
 $x/a_{ix}=1.08$, where the combined structure is labelled as
 $E^{O}$. An additional pair of vortices (
 $G^{I}$ and
 $G^{O}$) forms near the bottom wall within the separated region. Subsequent developments behind the cube are illustrated in figure 10 (note the difference in colour scale). While still visible at
 $x/a_{ix}=1.38$, the positive vortices
 $B^{I}$,
 $D^{I}$ and
 $C^{O}$ disappear, and
 $G^{I}$ diminishes by
 $x/a_{ix}$=1.74. The negative vortices, namely
 $C^{I}$ and
 $E^{O}$ (
 $B^{O}$ and
 $D^{O}$) roll around each other and merge to form a larger structure (
 $H$, figure 10d–f), which is centred behind the cube. This vortex entrains part of the positive vorticity originating from the outer leg of the horseshoe vortex (
 $A^{O}$) towards the bottom. The extent of interactions with the inner leg depends on the cube spacing. For
 $\lambda =1.0a$, the inner leg (
 $A^{I}$) is already merged with
 $H$ at
 $x/a_{ix}=2.16$ to create a large streamwise vortex that occupies most of the space behind the cube (figure 10g). At
 $x/a_{ix}$=2.58, the shown FOV covers both cubes (FOV 1 in figure 2) to demonstrate that a mirror image of this process evolves around the neighbouring cube as well with the vortex rotating in the opposite direction. The resulting 3-D wake structure is also depicted in figure 10(p) using iso-surfaces of
 $\varOmega _x$. For
 $\lambda =1.5a$, the merging with
 $A^{I}$ only begins at
 $x/a_{ix}\sim 2.16$ and is almost completed at
 $x/a_{ix}=3.78$ (figures 10(n) and 10(q)). For
 $\lambda =2.5a$ one can still find a distinct inner horseshoe vortex legs at
 $x/a_{ix}=3.78$, although there are signs of interaction with other structures at this location. Note that the direction of the large streamwise vortex behind each cube is the same as that of the inner leg of the horseshoe vortex. The vorticity from the other/outer legs is entrained into narrow near-bottom layers. Interestingly, if the two cubes are replaced with a single obstacle with a similar total width, the near wake would have a pair of horseshoe legs rotating in the opposite direction. Possible reasons for the dominance of one of the vorticity components (negative in figures 9 and 10) might be related to asymmetry in the peak vorticity of the horseshoe legs, with that of the inner one being higher. Specific reasons for this asymmetry, involving realignment and stretching of vortices, is discussed in the following section. Another source of asymmetry involves the stronger positive wall-normal flow between the cubes, which initiates the migration of vortex
 $C^{I}$ around the top corner. Between the large vortices dominating the near wake, the induced flow points away from the wall. As discussed later, this induced flow affects the distributions of wall shear stresses and streamwise velocity between the cubes.
3.3. Origin and evolution of vortical structures
This section identifies the origin of the vortical structures on the various surfaces along with key phenomena affecting their evolution by stretching and turning. The analysis focuses on the role of the mean flow features, deferring discussions on the impact of the turbulent terms, such as gradients of vorticity–velocity correlations, to subsequent papers. As discussed before, the near-surface velocity is resolved using first-order SVD involving an interpolation volume shaped as an oblate ellipsoid with a base diameter of 200  $\mathrm {\mu }$m in the surface-parallel directions, and a surface-normal size of 20
 $\mathrm {\mu }$m. The grid spacing is 10 and 60
 $\mathrm {\mu }$m in the surface-normal and -parallel directions, respectively. The corresponding velocity gradients as well as the vorticity and wall shear stress components are calculated by re-applying SVD with the same oblate interpolation volume but using the structured velocity distributions. Application of SVD here serves as a convenient low-pass filter. The figures correspond to the intermediate spacing (
 $\lambda =1.5a$), but the discussions include comments on the effects of spacing with reference to results presented before.
The following discussion shows that most of the vortical structures discussed before have origins either upstream of the cube or on its front surface. Figure 5 already shows that head of the horseshoe vortex upstream of the cube contains rolled-up boundary layer vorticity. The next question involves the origin of the vortical canopy engulfing the cube. The vorticity distributions along with the streamlines 30  $\mathrm {\mu }$m upstream of the front surface are presented figure 11(a–c). As is evident, the radial flow away from the stagnation point generates
 $\varOmega _y>0$ on the inner half and
 $\varOmega _y<0$ on the outer half of the surface, as well as
 $\varOmega _z>0$ below the stagnation point and
 $\varOmega _z<0$ above it. The vorticity signs and directions are consistent with those of the canopy (figures 4 and 5). In contrast, and as one would expect,
 $\varOmega _x$ is very small. We have also tried to calculate the surface-normal gradients of
 $\varOmega _y$ and
 $\varOmega _z$ to estimate the vorticity diffusion from the wall. While the results give the correct signs of vorticity flux, questions about the uncertainty in the vorticity gradients compared to their magnitude have led to a decision not to present them. Unlike the front of the cube, the side and top surfaces have little impact on the vortical canopy, and in fact, figures 4 and 5 show that the canopy is separated from these surfaces. As for the streamwise vortices, they are not generated by viscous diffusion, but rather by realignment of
 $\varOmega _y$ and
 $\varOmega _z$ along the edges of the front surface. This process is demonstrated in figure 11(d–f), which shows the distributions of vortex straining terms that affect
 $\varOmega _x$ in the vorticity transport equations. Summing
 $\varOmega _y\partial U/\partial y$ (figure 11e),
 $\varOmega _z\partial U/\partial z$ (figure 11f) and the streamwise straining term,
 $\varOmega _x\partial U/\partial x$ (which is negligible here), results in a series of peaks with alternating signs distributed along the edges of the front surface (figure 11d). The signs and location of these peaks are consistent with those of vortices
 $B^{I}$,
 $C^{I}$,
 $D^{I}$,
 $D^{O}$,
 $C^{O}$ and
 $B^{O}$ evident in figure 9(g–l). This agreement confirms that, except for the horseshoe legs, the rest of the streamwise structures originate from the realignment of
 $\varOmega _y$ and
 $\varOmega _z$ at the edges of the front surface. Specifically, the upper pairs (
 $C$ and
 $D$) are results of opposing effects with spatially varying magnitudes of
 $\varOmega _y$ and
 $\varOmega _z$, while both contribute constructively to the near-bottom secondary vortex (
 $B$).
The structure of vorticity at  $x/a_{2x}=-0.03$ for
 $\lambda =1.5a$. (a–c) Colour contours of (a)
 $\varOmega _x$, (b)
 $\varOmega _y$ and (c)
 $\varOmega _z$ superimposed on the in-plane streamlines. (d–f) Colour contours of vortex straining terms affecting the streamwise vorticity: (d)
 $\Omega_x \partial U/\partial x + \Omega_y \partial U/ \partial y + \Omega_z \partial U/ \partial z$, (e)
 $\Omega_y \partial U/ \partial y$ and ( f)
 $\Omega_z \partial U/ \partial z$.

Vortex stretching dominates in the evolution of the vortical canopy. A sample comparison between the stretching term for  $\varOmega _z$ (
 $\varOmega _z\partial W/\partial z$) and the sum of all the spanwise vorticity straining terms (
 $\varOmega _j\partial W/\partial x_j$) in the cube mid-plane is presented in figure 12. There is little difference between them, with both showing that the spanwise stretching peaks at the head of the horseshoe vortex and above the forward part of the cube, both consistent with the location of the
 $\varOmega _z$ maxima (figure 5). In both cases, the spanwise stretching is associated with the flow circumventing an obstacle, namely the bottom of the cube near the horseshoe head (figures 4 and 9a–f), and the separation line above the cube (figures 6(g–i) and 9(g-i)). Further downstream the magnitude of
 $\varOmega _z$ above the cube is reduced by flow contraction that continues up to
 $x/a_{2x}=2.5$. Phenomena affecting the evolution of
 $\varOmega _y$ along the sides are demonstrated in figures 13(a) and 13(b). After being produced on the front surface,
 $\varOmega _y$ is enhanced by vertical stretching as the flow circumvents the forward part of the cube (figure 9g–l) and the separated regions along the side surfaces (figure 6a–f). This stretching occurs along most of the sides (figure 13c), but not at their bottom corners, where the flow contracts vertically under the influence of the axial secondary vortices
 $B^{I}$ and
 $B^{O}$. The resulting reduction in the magnitude of
 $\varOmega _y$ near the bottom corners is evident in figure 4(a–f). With decreasing spacing, the area with vertical stretching weakens along the inner side (not shown), hence the thickness of the canopy along this surface decreases (figure 4g–i). Near the trailing edges and behind the cube,
 $\varOmega _y\partial V/\partial y$ changes sign owing to vertical contraction induced by several effects, most prominently, the flow induced by vortices
 $B^{I}$ and
 $B^{O}$ and other structures that they interact with (figure 9m–r). In the near field behind the cube, the vertical contraction is associated with an upward flow induced by the arch vortex and downward flow behind the cube (figure 9s–u). Note that this discussion focuses on the mean flow effects, but the evolution of vorticity is also affected by turbulent dispersion, which is beyond the present scope.
The  $x$–
 $y$ mid-plane for
 $\lambda =1.5a$, showing colour contours of vortex straining terms affecting
 $\varOmega _z$: (a)
 $\varOmega _x {\partial W}/{\partial x}+\varOmega _y{\partial W}/{\partial y}+\varOmega _z {\partial W}/{\partial z}$ and (b)
 $\varOmega _z {\partial W}/{\partial z}$, both superimposed on contour lines of
 $\varOmega _z$. Incremental difference between lines is
 $\varOmega _za/U_c$=0.5.

The  $x$–
 $z$ mid-plane for
 $\lambda =1.5a$, showing colour contours of vortex straining terms affecting
 $\varOmega _y$: (a)
 $\varOmega _x {\partial V}/{\partial x}+\varOmega _y {\partial V}/{\partial y}+\varOmega _z {\partial V}/{\partial z}$ and (b)
 $\varOmega _y {\partial V}/{\partial y}$ both superimposed on contour lines of
 $\varOmega _y$. Incremental difference between lines is
 $\varOmega _ya/U_c=0.5$; solid lines:
 $\varOmega _y>0$; and dashed lines:
 $\varOmega _y<0$. (c) Contours of
 $\varOmega _y{\partial V}/{\partial y}$ superimposed on in-plane velocity vectors in a
 $y$–
 $z$ plane located at
 $x/a_{2x}=0.24$.

Finally, mechanisms affecting the evolution of horseshoe legs and the secondary structures between them and the sidewall are highlighted in figure 14. The discussion focuses on the  $x$–
 $z$ plane that intersects the centre of the horseshoe legs, i.e. the magnitude of
 $\varOmega _x$ there is maximum (figure 14a). The sum of straining terms affecting
 $\varOmega _x$ (figure 14b), and the distributions of the individual terms (figure 14c–e) demonstrate, as expected, that the legs of the horseshoe vortex originate from realignment of
 $\varOmega _z$ in front of the cube (figure 14e). Subsequently, around the corner and forward part of the sides,
 $\varOmega _x$ is enhanced by axial stretching (figure 14c). The maximum of
 $\varOmega _x$ coincides with these regions, with the inner leg subjected to higher straining, hence have a higher maximum vorticity compared to the outer leg. This latter trend increases with decreasing cube spacing (figure 9j–l). Further downstream, the total straining term along the paths of the legs changes sign, consistent with the reduction in vorticity there, but its magnitude is smaller than that near the leading edge. As discussed before, in the aft part and downstream of the cube, the legs interact with other axial vortices. The outer leg is entrained under the large structure forming behind the cube, which, depending on spacing, entrains the inner leg (figure 10d–i). As for the secondary structures (
 $B^{I}$ and
 $B^{O}$), as discussed before, they are originated from realignment of
 $\varOmega _y$ and
 $\varOmega _z$ at the bottom corners of the front surface (figure 11d–f). Consistent effects are also evident from figures 14(d) and 14(e). Along the sides,
 $\varOmega _z\partial U/\partial z$ continues to contribute constructively to the axial vorticity, but
 $\varOmega _y\partial U/\partial y$ changes sign, and together with streamwise contraction (figure 14c) reduces
 $\varOmega _x$. Overall, straining increases
 $\varOmega _x$ magnitude in the
 $B^{I}$ and
 $B^{O}$ structures in the forward part of the cube, and decreases it in the aft part. These trends are consistent with those observed in figure 9. To elucidate the contribution of
 $\varOmega _z$ in this region, note that a layer with
 $\varOmega _z>0$ forms on both sides of the cube (see line contours in figure 14e) after being fed from the lower part of the front surface (figure 11c) and enhanced by spanwise stretching and realignment of
 $\varOmega _y$.
The structure of streamwise vorticity in the  $x$–
 $z$ plane located at
 $y/a_{2y}=0.18$ for
 $\lambda =1.5a$: (a) colour contour of
 $\varOmega _x$ superimposed on the in-plane streamlines; and (b–e) the corresponding colour contours of vortex straining terms affecting
 $\varOmega _x$: (b)
 $\varOmega _x{\partial U}/{\partial x}+\varOmega _y{\partial U}/{\partial y}+\varOmega _z{\partial U}/{\partial z}$ superimposed on contour line of
 $\varOmega _x$; (c)
 $\varOmega _x{\partial U}/{\partial x}$ superimposed on contour line of
 $\varOmega _x$; (d)
 $\varOmega _y{\partial U}/{\partial y}$ superimposed on contour line of
 $\varOmega _y$; and (e)
 $\varOmega _z{\partial U}/{\partial z}$ superimposed on contour line of
 $\varOmega _z$.

3.4. Wall shear stress distributions
The flow structure around the cubes causes significant variations in the wall shear stress distributions, as depicted in figures 15 and 16. The results are normalized by the wall shear sufficiently far upstream,  $\rho U^2_{\tau \infty }$. Focusing first on the vicinity of the cube (figure 15), the streamwise shear stress,
 $\tau ^+_{xy}$, peaks along the sides of the cube, in the space between the horseshoe legs and vortices
 $B^{I}$ and
 $B^{O}$, which are marked by red and blue lines, respectively. The downward flow induced by these vortices brings high-momentum fluid towards the wall, increasing the wall-normal velocity gradients there. The peak magnitude is 2.4 in the outer side and increases from 2.1 to 2.7 with increasing spacing on the inner side. In front of the cube,
 $\tau ^+_{xy}<0$, and its magnitude peaks under the horseshoe heads, which are marked by black lines. Another region with
 $\tau ^+_{xy}<0$ is located behind the cube, peaking in magnitude under the central part of the arch-like vortex. The extents of the separation regions upstream and downstream of the cube, which are defined by the lines where
 $\tau ^+_{xy}=0$ and marked as
 $X^F_{sep}$ and
 $X^A_{sep}$ in figure 15(b), are listed in table 2. In front of the cube, the length of the separation region is about 1.0
 $a$, close to that measured in Martinuzzi & Tropea (Reference Martinuzzi and Tropea1993), but smaller than the 1.2
 $a$ and 1.4
 $a$ reported by Yakhot et al. (Reference Yakhot, Liu and Nikitin2006) and Diaz-Daniel et al. (Reference Diaz-Daniel, Laizet and Vassilicos2017), respectively, for larger cubes. Behind the cube, the separation region extends to approximately 1.35 cube heights downstream from the back surface. This value is slightly smaller than the 1.4a–1.5
 $a$ range found in Martinuzzi & Tropea (Reference Martinuzzi and Tropea1993), Yakhot et al. (Reference Yakhot, Liu and Nikitin2006), Hearst et al. (Reference Hearst, Gomit and Ganapathisubramani2016), Diaz-Daniel et al. (Reference Diaz-Daniel, Laizet and Vassilicos2017) and Schröder et al. (Reference Schröder, Willert, Schanz, Geisler, Jahn, Gallas and Leclaire2020). This discrepancy might be attributable to the differences in
 $h/a$, presumably owing to the lower momentum, but higher turbulence levels in the region where the present cube is located. The magnitude of
 $\tau ^+_{yz}$ (figure 15d–f) peaks between the region where the horseshoe legs turn downstream and the front corners but remains high under the legs along the sides of the cubes. The peak magnitudes on both sides appear to increase with cube spacing, with the inner values being lower than the outer ones. Behind the cube the distributions of
 $\tau ^+_{yz}$ have local maxima downstream of the foci corresponding to the arch-like vortex near the wall (figure 4a–c). Elevated
 $\tau ^+_{yz}$ can also be seen under the large streamwise vortex forming behind the cube, especially for
 $\lambda =1.0a$, where it develops closer to the back surface (figure 10g–i).
Colour contours and contour lines of the distributions of (a–c)  $\tau ^+_{xy}$, and (d–f)
 $\tau ^+_{yz}$ on the bottom wall. For (a,d)
 $\lambda =1.0a$, (b,e)
 $\lambda =1.5a$ and (c, f)
 $\lambda =2.5a$. Increment between lines is 0.3. Thick lines show the locations of maximum vorticity magnitude for black –
 $\varOmega _z$ in the horseshoe head, red –
 $\varOmega _x$ of the horseshoe legs and blue –
 $\varOmega _x$ of secondary streamwise vortices
 $B^{I}$ and
 $B^{O}$ in figure 9.

Colour contours and contour lines of  $\tau ^+_{xy}$ on the bottom wall: (a–c) upstream, and (d–f) in and downstream of the gap between the cubes. For (a,d)
 $\lambda =1.0a$, (b,e)
 $\lambda =1.5a$ and (c, f)
 $\lambda =2.5a$. Increment between lines is 0.3. Purple line in (d) is the location of maximum magnitude of
 $\varOmega _x$ in the merged large pair of streamwise vortices.

The streamwise shear stress distributions further upstream and downstream of the cubes are plotted in panels (a,b,c) and (d,e, f) of figure 16, respectively, showing data obtained from different fields of view. In some cases, the magnitudes of the peaks differ by approximately 10 %, which, as discussed in the Appendix, is consistent with the uncertainty in the wall shear stress measurements. In general, the shear stress distribution around both cubes appear to be quite similar (within the uncertainty limit), confirming the symmetric alignment of the cubes relative to the flow. As far as 3 $a$ upstream of the cubes,
 $\tau ^+_{xy}$ is already significantly smaller than 1, implying the cube-induced adverse pressure gradients already influence the flow there. This observation is also demonstrated by the mean velocity profiles at
 $x=-3a$ for two spanwise locations and all the spacings, which are presented in figure 17(a). There is already a momentum deficit in the viscous sublayer and the covered range of the log layer compared to the fully developed turbulent channel flow measured in the same facility and location without the roughness cubes (Zhang et al. Reference Zhang, Wang, Blake and Katz2017). The corresponding wall-normal velocity profiles presented in figure 17(b) clearly show that
 $\partial V/\partial y>0$ for all cases, implying that
 $\partial U/\partial x<0$, i.e. the flow is being slowed down by the adverse pressure gradients. The magnitude of
 $\partial W/\partial z$ in this region is negligible. Linear fitting to the local
 $\partial U/\partial x$ and the magnitude of the velocity deficit suggest that the cube effects could extend to about
 $x=-5a$. The magnitude of
 $\partial V/\partial y$ decreases with increasing cube spacing, both at
 $z=0$, i.e. the line of symmetry between cubes, and at the spanwise location of the cube centre. Following the streamwise development of the wall stress along
 $z=0$,
 $\tau ^+_{xy}$ decreases upstream the cube, then increase rapidly between the cubes, and then decreases again further downstream. The variations in stress increase with decreasing spacing, characterized by the minimum (
 $\tau ^+_{xy}\sim 0.2$) at
 $x/a\sim -1$, the maximum at
 $x/a=0.5$ associated with flow channelling and streamwise vortices, and the broad area with
 $\tau ^+_{xy}<0.3$ at
 $x/a>2.3$. The latter is associated with the positive wall-normal flow induced by the large pair of merged streamwise vortices that form behind the cubes (figure 10). It should be noted that the instantaneous realizations (not shown) indicate that the near-wall flow direction in this area becomes negative intermittently.
Profiles of (a)  $U^+$, and (b)
 $V^+$ at
 $x=-3a$, both at
 $z=0$ and in spanwise planes aligned with the cube centre.

It would be of interest to demonstrate how the evolution of shear stresses is related to the development of the entire mean velocity profiles along the  $z=0$ line and the effect of spacing on them. The streamwise and wall-normal velocity profiles are presented in figures 18(a) and 18(b), respectively. In each series, the first row provides data for
 $x\leq 0$, and the second row, for
 $x\geq 0$. Starting from
 $x/a=-2.52$, there is already an increasing streamwise momentum deficit with decreasing spacing. The difference between profiles peaks at
 $x/a=-0.54$, at about the same planes of the horseshoe head, and then starts decreasing as the flow starts accelerating into the gap between the cubes. There, the very near-wall flow (
 $y/a<0.1$) accelerates, but a spacing-dependent momentum deficit develops at
 $0.1<y/a<0.6$. Both phenomena are associated with the horseshoe legs and to some extent, the secondary axial vortex
 $B^{I}$. At
 $y/a<0.1$, high-momentum flow is driven towards the wall between these vortices, as discussed before, and some of it makes it to the other side of the horseshoe leg under this vortex (figure 9j–r). This effect is intensified for the narrow spacing owing to the close proximity of both inner legs. At
 $0.1<y/a<0.6$, the horseshoe legs induce a positive wall-normal velocity along the centreline, which drives low-momentum flow away from the wall. At
 $x/a>1$, the persistent decrease in streamwise momentum is driven initially by the horseshoe legs, and then further downstream by the large vortical structures developing behind the cubes (figure 10g–o). As one would expect, the momentum deficit increases with decreasing spacing. All the vertical velocity profiles (figure 18b) have positive slopes at
 $x/a\leq -0.54$ that increase with decreasing spacing, owing to the adverse pressure gradients there. At
 $-0.54<x/a<1.5$, the near-wall profiles have maxima induced by the horseshoe legs. Further downstream, the maxima shift upward under the influence of the large scale merged streamwise vortices.
Evolution of (a)  $U/U_c$, and (b)
 $V/U_c$ profiles along
 $z=0$.

3.5. Gap-dependent blockage and channelling
The blockage to the channel, the flow channelling between cubes and the asymmetry in the flow structure around each cube can be evaluated by analysing the evolution of bulk velocity,  $U_b$. It is defined as the streamwise velocity averaged over an area with height
 $a_{iy}$, and width
 $L$ (figure 19a) upstream and downstream of the cubes, and
 $L-a_{iz}/2$ at
 $0\leq x/a\leq 1$. For
 $\lambda _i=1.0a$ and 1.5
 $a$,
 $L=(\lambda _i+a_{iz})/2$, i.e. the sample area extends from the centre of the cube to
 $z$=0 on the inner side, and by the same distance on the outer side. For
 $\lambda =2.5a$,
 $L=(\lambda +a_{3z})/2\text {--}150\ \mathrm {\mu }$m since for this case, the FOV ends in the outer side. The values of
 $U_b$ are normalized both by
 $U_c$ and
 $U^{\prime }_b$, the latter being the bulk velocity over the same height far upstream of the cubes based on the streamwise velocity profiles in the same channel flow available in Zhang et al. (Reference Zhang, Wang, Blake and Katz2017). The implications of cube-induced flow blockage are further evaluated by examining the evolution of the vertical and spanwise velocity components along the edges of the sample area. The vertical velocity component,
 $V_b$ (figure 19c), is averaged along upper edges of these areas (blue lines in figure 19a), and the spanwise velocity,
 $W_b$ (figure 19d), along their outer boundaries (red lines in figure 19a). Note that based on the continuity equation
 $a\cdot \partial U_b/\partial x$ is balanced by
 $V_b$ and
 $a\cdot W_b/L$. In this discussion, the flow asymmetry induced by the neighbouring cube can be readily observed by comparing the results for the inner and outer sides. Several trends are evident. First, in all parts of the flow field, the differences between bulk velocity components in the inner and outer sides increase with decreasing cube spacing. They are substantial for
 $\lambda =1.0a$, especially between and downstream of the cube, and decrease to a few per cent for
 $\lambda =2.5a$. Second, at
 $x<0$,
 $U_b$ decreases and the other components increase in magnitude with decreasing distance from the front surface, as the axial blockage accelerates the flow vertically and laterally outward. As discussed before, even at
 $x/a=-3$,
 $U_b/U'_b \sim 0.9$, i.e. the flow is already slowed down and begins to circumvent the cubes. The decrease in
 $U_b$ and the corresponding increases in
 $V_b$ and magnitude of
 $W_b$ intensify with decreasing spacing. In contrast, the lateral flow along the plane of symmetry between cubes (at
 $z=0$) remains persistently very small (
 $<$0.01
 $U_c$), confirming that the flow around the two cubes is symmetric, and that the observed phenomena are not caused by cubes’ misalignments. Third, at
 $0<x/a<1$,
 $U_b$ increases abruptly on both sides owing to flow channelling, but then continues to decrease at a mild rate along the inner side while remaining higher than that on the outer side. While
 $V_b$ decreases on both sides, it remains positive along the inner side, but becomes negative at
 $x/a>0.5$ in the outer side. The persistent upward flow between cubes, and downward flow along the outer side contribute to the previously discussed circulation that causes the migration and merging of axial vortices around the cube. Finally, downstream of the cube, the bulk flow appears to be influenced by the gap-dependent development of large streamwise vortices. Hence,
 $V_b$ remains negative and
 $U_b$ increases monotonically in the outer side, while in the inner side,
 $U_b$ does not change significantly with
 $x/a$, and its magnitude decreases with decreasing spacing. The latter is consistent with trends of the wall shear stress in this region.
(a) The areas in the inner and outer sides of the cube used for evaluating the blockage. At  $x<0$ and
 $x/a>1$, this area extends from the centre of the cube (black solid line), and at 0
 $\leq x/a\leq 1$, it extends outward from the side surface of the cube (black dashed line). (b–d) Axial profiles of (b) the streamwise bulk velocity, (c) wall-normal velocity averaged over the upper edge of the sample area (blue line in a) and (d) spanwise velocity averaged over the lateral edge of the sample area (red line in a). Here,
 $U'_b$ (
 ${=}0.53U_c$) is the bulk velocity in the fully developed channel flow far upstream of the cubes calculated for the same area from data available in Zhang et al. (Reference Zhang, Wang, Blake and Katz2017).

4. Summary and conclusions
The 3-D flow structures around a pair of roughness cubes embedded in the inner part of a turbulent channel flow ( $a/\delta _{\nu \infty }=91$,
 $a/h=0.039$) are investigated experimentally using M-DTH. The incoming flow is a fully developed turbulent channel flow over a smooth wall with
 ${\textit{Re}}_{\tau \infty }=2300$. To investigate the effect of lateral spacing, the pair of cubes are aligned in the spanwise direction, and separated by
 $a$, 1.5
 $a$ and 2.5
 $a$. The present paper focuses on the mean flow features, including the origin and evolution of the primary vortices and the interactions among them, the structure of the separated regions around the cubes as well as the distributions of wall shear stresses. The flow structures around each cube are qualitatively similar to those previously reported for larger isolated cubes (Martinuzzi & Tropea Reference Martinuzzi and Tropea1993; Yakhot et al. Reference Yakhot, Liu and Nikitin2006; Lim et al. Reference Lim, Thomas and Castro2009; Hearst et al. Reference Hearst, Gomit and Ganapathisubramani2016; Diaz-Daniel et al. Reference Diaz-Daniel, Laizet and Vassilicos2017; Schröder et al. Reference Schröder, Willert, Schanz, Geisler, Jahn, Gallas and Leclaire2020). Some flow features, e.g. the stagnation point on the front surface, appear to be insensitive to the cube size and incoming flow conditions. Other features, e.g. the extents of separation regions in front of and behind the cube are smaller near the present substantially smaller cube.
Upstream of each cube the boundary layer separates and most of its spanwise vorticity rolls up into the head of the horseshoe vortex and is enhanced by spanwise stretching as the flow circumvents the front surface. As discussed in the introduction, rollup of such structures in front of obstacles in boundary layers is well known (Simpson Reference Simpson2001). The legs of this vortex wrap around the front of the cube, realign in the streamwise direction and persist past the downstream end of the cube, where they interact with other streamwise structures.
Each cube is covered by a vortical canopy, consisting mostly of wall-normal vorticity outside of the separated regions along the side surfaces, and spanwise vorticity above the separated region on the top surface. The vorticity magnitude is height dependent owing to interactions with the strain field generated by streamwise vortices. Starting from mid cube, the vorticity layer expands and decreases in magnitude. It extends to the arch-like vortex, the dominant structure in the separated region behind the cube, where the vorticity magnitude is substantially lower than that close to the leading edge. This vortex canopy originates mostly from the front surface of the cube, where the vertical and spanwise vorticity components are generated as the flow near the surface accelerates nearly radially from the stagnation point. The associated pressure gradients presumably cause diffusion of vorticity from the wall. The canopy vorticity magnitude is intensified immediately downstream of the front surface by stretching in the spanwise direction above the cube, and in the vertical direction along the sides. The thickness of the inner part of this canopy deceases with decreasing cube spacing. In the aft part and downstream of the cube, contraction contributes to a reduction in both vorticity components.
In addition to the horseshoe legs, the cube is surrounded entirely by a series of other streamwise vortices. These findings are consistent with results of numerical simulations involving a much larger cube (Lim et al. Reference Lim, Thomas and Castro2009) or a square cylinder (da Silva et al. Reference da Silva, Chakravarty, Sumner and Bergstrom2020). These vortices originate from the corners of the front surface owing to partial realignment of the above-mentioned spanwise and wall-normal vorticity generated on the front surface. Shortly after being generated, the strength of these vortices evolves further by realignment of other components, e.g. the counter-rotating vortices located between the horseshoe legs and the cube surface (identified as  $B^{I}$ and
 $B^{O}$) are enhanced by realignment of
 $\varOmega _z$. The presence of the neighbouring cube causes asymmetry in the magnitude, location, size and evolution of the streamwise vortices, including the horseshoe legs. In particular, starting at
 $x/a=0.5$, the vertical flow away from the bottom between the cubes, which is induced by the horseshoe legs, causes outward lateral migration and merging of streamwise structures that have the same sign as the inner horseshoe leg. Vortices of the opposite sign are pushed away from the surfaces and diffuse. Behind the cube, the merged structure further pairs with the inner horseshoe leg, forming a large streamwise vortex that is as big as the cube. This vortex entrains the (counter-rotating) outer horseshoe leg, confining it to a narrow space located near the bottom. Consequently, the downstream signature of the pair of cubes consists of pair of cube-size counter-rotating vortices, each spinning in the same direction as the inner leg of the corresponding cube, with thin layers of counter-rotating vorticity near the wall. These processes occur earlier and are more intense with decreasing spacing but happen in all the present cases. For the widest spacing, the merging process with the inner leg is not completed at the downstream end of the sample volume.
All the separated flow regions in front of and downstream of the cube as well as those on the side and top surfaces are open. Sample 3-D streamlines are used for elucidating the phenomena generating the complex near surface flow topologies, which include foci, saddle points as well as separation and attachment lines. Along the side surfaces, the fluid enters the separated region at low elevations, spirals away from the surface and exits near the upper trailing edge. Over the top, the flow enters from both sides around the corners and, after spiralling, leaves from the back. Behind the cube, the flow enters from both sides at low elevation, swirls around the centre of the arch-like vortex while rising and then leaves at an elevation of approximately the cube height. The separated zones on the sides and behind the cube are also linked at low elevations. With decreasing spacing, the flow around the cube become increasingly asymmetric. In the inner side, the separation line in front of the cube tilts towards the front surface, the separation zone on the sidewall shrinks and the arch leg becomes smaller. On the outer side, the flow structure seems to be less affected by spacing.
The presence of the cubes causes deceleration, hence reduction in streamwise momentum and wall shear stress at least as far as three cube heights upstream of the front surface. The streamwise wall shear stress magnitude has peaks under the horseshoe head in front of the cube, and to the sides of the cube, in the region where the horseshoe legs and the secondary vortices  $B^{I}$ and
 $B^{O}$ induce downward flow towards the wall. The peak stress magnitude in the inner side decreases with decreasing spacing, presumably owing to the weaker and rapidly diminishing
 $B^{I}$ vortex. Behind the cube, the merged large pair of counter-rotating vortices induce an upward flow, reducing the wall shear stress between them. This phenomenon is more evident for the narrowest spacing since the merging occurs earlier, and the vortices are located closer to each other. The spanwise wall stress magnitude peaks between the front corners of the cubes and the region where the horseshoe vortex legs turn downstream. Also, the lateral flows induced by the merged large vortices behind the cubes enhance the spanwise stress under them.
As noted in the introduction, one of the motivations for the present study has been previously observed interactions among U-shaped vortices generated by neighbouring pyramid elements (Hong et al. Reference Hong, Katz, Meneveau and Schultz2012; Talapatra & Katz Reference Talapatra and Katz2012). In contrast, the present results suggest that interactions between legs of the horseshoe vortices generated by neighbouring cubes is not a major contributor to the wall-normal transport. The shear stress between them remains high, and they do not appear to lift away from the surface even when they are close to each other. Instead, migration and merging of streamwise vortices generated by the same cube, including the inner horseshoe leg, create a large vortex behind the cube. Then, interaction between vortices generated by neighbouring cubes does transport momentum away from the wall further downstream, as is evident from the reduced wall shear stresses there. The upward and outward flow that affects the migration and merging of streamwise vortices is driven, at least in part, by the asymmetric gap-dependent blockage to the bulk flow.
In summary, the ensemble-average flow around the cubes exhibits strikingly complex interacting flow structures. Included are a vortical canopy originated from the front surface, horseshoe vortex containing the upstream boundary layer vorticity, multiple streamwise secondary vortices originated from vortex realignment along the corners of the front surface and the arch-like vortex containing canopy vorticity in the near wake. All the separated regions on the side and top surfaces as well as upstream and downstream of the cubes are open, and connected, especially near the bottom. As expected, the lateral neighbouring cube induces significant flow asymmetry, which increases with decreasing spacing. This asymmetry causes preferential merging of multiple axial vortices around and behind the cubes, resulting in formation of a large streamwise vortex, one behind each cube, which rotates in the same direction as the inner leg of the horseshoe vortex. These flow phenomena affect the wall shear stress distribution over the entire sample area, including generation of peaks that are as high as three times the far field wall stress. The next study, which will be a subject of future publication, will examine the impact of the strain field generated by these flow features on the evolution of turbulence in the passage. Modal analysis (e.g. proper orthogonal decomposition) can be applied to instantaneous velocity fields to further investigate the dynamics of flow structures. Studies of the changes to the flow and turbulence when the elements are embedded in a rough wall will also follow.
Acknowledgements
The authors would also like to thank Y. Ronzhes for his continued support in operating the facility and manufacturing the experimental set-up.
Funding
This work is funded in part by the Office of Naval Research under grant nos N00014-15-1-2404 and N00014-17-1-2955, and in part by National Science Foundation under grant no. CBET-1438203.
Declaration of interests
The authors report no conflict of interest.
Appendix
In the 3-D particle tracking, each unstructured vector is calculated from the displacement of a tracer particle. Therefore, the uncertainty in the unstructured vectors comes from the uncertainty in locating the particle, i.e. uncertainty of the intensity-weighted centroid of the truncated trace. Detailed results of tests to determine the position accuracy using synthetic particles, with and without added noise, are discussed in Gao & Katz (Reference Gao and Katz2018). In tomographic holography, the elongated particle traces are truncated by multiplying the intensity distributions of the particle traces after using a 3-D self-calibration procedure to match the two views. The intensity-weighted centroid of each truncated trace is used as the 3-D coordinate of the corresponding particle. Tests using thousands of synthetic particles show that the position uncertainty is 0.24  $\mathrm {\mu }$m in the
 $x$–
 $z$ directions and 0.45
 $\mathrm {\mu }$m in the
 $y$ direction. The higher wall-normal uncertainty is attributed to the rhombus-like shape of the truncated trace. Correspondingly, for the 25
 $\mathrm {\mu }$s time interval between exposures, the uncertainties of unstructured vectors are 0.014 m s
 $^{-1}$ in the
 $x$–
 $z$ directions and 0.025 m s
 $^{-1}$ in the
 $y$ direction.
The uncertainty of the structured mean velocity, which is determined from the unstructured vectors using SVD (see § 2.2), has also been evaluated using synthetic data. The particles are randomly distributed in a sample volume of the same dimensions as those in the actual experiment. The particle number density and number of instantaneous realizations are also identical to actual values. The particles follow the flow in the far upstream boundary layer, i.e. the mean wall-normal and spanwise velocity components are zero. To simulate the effect of turbulence, velocity variations (standard deviation) of 0.2 m s $^{-1}$, corresponding to 8 % of the centreline velocity, are imposed on all three velocity components across each instantaneous sample volume. Furthermore, the above-mentioned uncertainty in individual unstructured vectors is also added. Using the ‘standard’ 100
 $\mathrm {\mu }$m diameter spherical interpolation volume and 60
 $\mathrm {\mu }$m vector spacing in all directions, the error of the calculated structured mean velocity is
 $0\pm 0.008U_c$ in all directions. Using the 150
 $\mathrm {\mu }$m diameter interpolation volume for vorticity calculation, the error in the calculated vorticity is
 $0\pm 0.181U_c/a$ in the
 $x$ direction,
 $0\pm 0.180U_c/a$ in the
 $y$ direction and
 $0.008\pm 0.183U_c/a$ in the
 $z$ direction. Synthetic data have also been used to quantify the uncertainties of wall shear stresses (and vorticity near the front surface), which involve the thin oblate interpolation volumes (see § 3.3). The mean error of the streamwise shear stress is
 $-0.011\pm 0.114\rho U^2_{\tau \infty }$, and that of the spanwise shear stress is
 $0.001\pm 0.120\rho U^2_{\tau \infty }$.



