

INTRODUCTION
Angola's protracted civil war between 1975 and 2002 resulted in the loss of more than half a million lives and countless injured. Massive population displacement, livelihood disruption and upheaval of settlements existed across the country, especially in the diamond-rich province of Lunda Sul.Footnote 1 After cessation of the civil war, the Angolan government faced local residents’ demands for peace, prosperity and an end to poverty. Both the colonial and post-colonial state had failed to exert a strong governing presence in the Lundas, just managing to retain a small urban foothold there against formidable odds during the civil war.
Throughout the 20th century, the tenuous presence of the state was entwined with conflicting interests embedded in diamond production. The post-war Angolan state has posited itself as a ‘developmental state’ in terms of its aim to secure political stability through the provision of infrastructure and services. But as Cox & Negi (Reference Ferguson2010) argue, developmental states must go beyond simple welfarism and display the capability to transition localized populations from subsistence forms of livelihood towards active participation in capitalist labour and land markets. Angola has a contradictory challenge in this regard. Its diamond wealth gives it far more leverage to invest in infrastructure and good governance, but past and present vested interests in diamond production on the part of the state and mining companies are powerful with the default path forward leading to restoration of ‘mining business as usual’. Nonetheless, long-term peace and prosperity depends on the Angolan state gaining legitimacy in the eyes of the electorate and delivering a more balanced distribution of the country's wealth (Englebert Reference Englebert2002). It remains to be seen whether the Angolan state and foreign mining companies’ urban housing and infrastructural plans alleviate poverty and precarity in the province.
Violent wars combined with contestation over mineral wealth have plagued several African countries over the last half-century (Le Billon Reference Le Billon2001). Given that the Lundas are Angola's major diamond regions as well as a current target of urban reconstruction, several vexed questions related to the interaction between mining and urbanisation arise that have been considered elsewhere across the continent (Bryceson & MacKinnon Reference Bryceson and MacKinnon2012). They involve the interface between large-scale corporate mining and small-scale artisanal mining and the problems of skilled/unskilled and foreign/domestic labour usage (Bush Reference Bush, Fraser and Larmer2010; Fraser & Larmer Reference Fraser and Larmer2010; Vlassenroot & Raeymaekers Reference Vlassenroot, Raeymaekers, Vlassenroot and Raeymaekers2004). Studies in post-conflict ‘diamond-cursed’ countries have pointed to a strong tendency for large-scale mining to prevail over artisanal mining, generating political tensions between ‘haves’ and ‘have-nots’ (Carstens & Hilson Reference Carstens and Hilson2009; Wilson Reference Wilson2013; Bryceson et al. Reference Bryceson, Fisher, Jønsson and Mwaipopo2014).
In the aftermath of a war in which mineral-conflict figured prominently and the term ‘blood diamonds’ was coined, the Angolan state has chosen to reinstate large-scale corporate mining and implement forceful measures to divert the Lundas’ population from artisanal mining. This was conceived as a strategy to secure law and order, at the same time as appeasing the population with an ambitious urban development agenda (Schubert Reference Schubert2010). As a form of post-conflict management, it accords with Soares de Oliveira's (Reference Soares de Oliveira2011: 288) concept of ‘illiberal peacebuilding’, in which state directive control over the economy and politics of the country is pervasive.
The government's stated intention is to assume a dominant role in the reconstruction and modernization of the region's towns and cities by repairing the infrastructural war damage, improving social services and lifting people's living standards. Success would undoubtedly earn the state much needed political legitimacy. Yet, immediately after the end of the war in 2002, the state instituted military operations aimed at enforcing a ban on artisanal mining that centred on the expulsion of foreign nationals from the region, notably Congolese artisanal miners, distrusted because of their reputed association with Savimbi-led UNITA rebel forces during the war. This was calculated to politically stabilize the country and deter tens of thousands of local people from artisanal diamond mining.
To theoretically contextualize the challenge of poverty alleviation in Angola, this article focuses first on rising awareness of a global precariat of marginalized labourers facing ambiguous working conditions and low remuneration, exploring how labour insecurity is affected by organisational shifts in the relationship between the nation-state, global capital investment and people struggling for basic livelihoods in situations of political and economic uncertainty. Against this analytical background, we interrogate how and why the Lundas population is now largely excluded from direct employment in diamond mining companies and subject to state attempts to prevent them from practicing artisanal mining, which they relied on heavily during the civil war. Thereafter, we consider residents’ own housing and livelihood efforts to secure a better life in urban settlements, based on fieldwork data from four Lundas mining settlements, namely Saurimo, Cacolo, Luó and Itengo. Finally, we return to the issue of labour precarity and its fluctuating incidence since diamond mining was established in the early 20th century, tracing it through the breakdown in synergy between large-scale mining and urbanisation during the civil war years, then the mining revival and urban growth of the first decade of the 21st century.
WEALTH, POVERTY AND PRECARITY IN THE GLOBAL MARKET
After over two decades of neo-liberal policies, rising levels of material insecurity and casualisation of labour are becoming entrenched in many parts of the world. Bourdieu (Reference Bourdieu1998, Reference Bourdieu1999) used the term ‘precarity’ to encapsulate a recurring form of labour market marginalisation characterised by casualisation, conceptualising it is as ‘part of a mode of domination of a new kind, based on the creation of a generalized and permanent sense of insecurity aimed at forcing workers into submission, into the acceptance of exploitation’ (Bourdieu Reference Bourdieu1998: 85).
Bourdieu (Reference Bourdieu1998: 81) refers to ‘flexploitation’, which serves as ‘rational management of insecurity’, arising from global competition between workers in developed capitalist countries and the least advanced countries, creating ‘submissive dispositions … based on a growing number who do not work and the diminishing number of those who work, but work more and more’, ever conscious of the abundant supply of labour ready to replace them at any point. The French sociologists Castel (Reference Castel2003) and Wacquant (Reference Wacquant2009) elaborated a concept of social precarity. More recently, the welfare economist, Standing (Reference Standing2009, Reference Standing2011) has dissected neo-liberal labour restructuring in developed capitalist countries and the deepening material uncertainty associated with short-term employment, political marginalisation, social insecurity, disintegrating career trajectories and incoherence of the working class.
Although this predicament may seem distant from diamond mining and urbanisation in the Lundas, the issue of labour uncertainty and precarity under international capitalist investment and restructuring extends to urban residents through the mediation of the Angolan state and global mining capital (Ferguson Reference Ferguson2005). Amidst the growing global imbalance between labour and capital, the Angolan state, unlike most western governments, experienced relative prosperity until the fall in world oil prices in 2014. The country's oil and diamond wealth placed it in an enviable position of attracting foreign investment and revenue. The Chinese, for instance, have been heavily involved in infrastructural building and repair in Angola.Footnote 2 Angola's former colonial power, Portugal, and BRIC countries, notably Brazil and Russia, have been investing significantly in mining.
But this upward economic trajectory is double-edged. Virtually all the mining investments are directed at large-scale, capital-intensive mining that relies on highly trained, often expatriate staff, destined to derail artisanal miners’ livelihoods by precluding their access to lucrative digging areas, while not availing them alternative mine employment. Thus, existing artisanal miners in the Lundas contend with labour displacement as Angola capitalizes its diamond production.
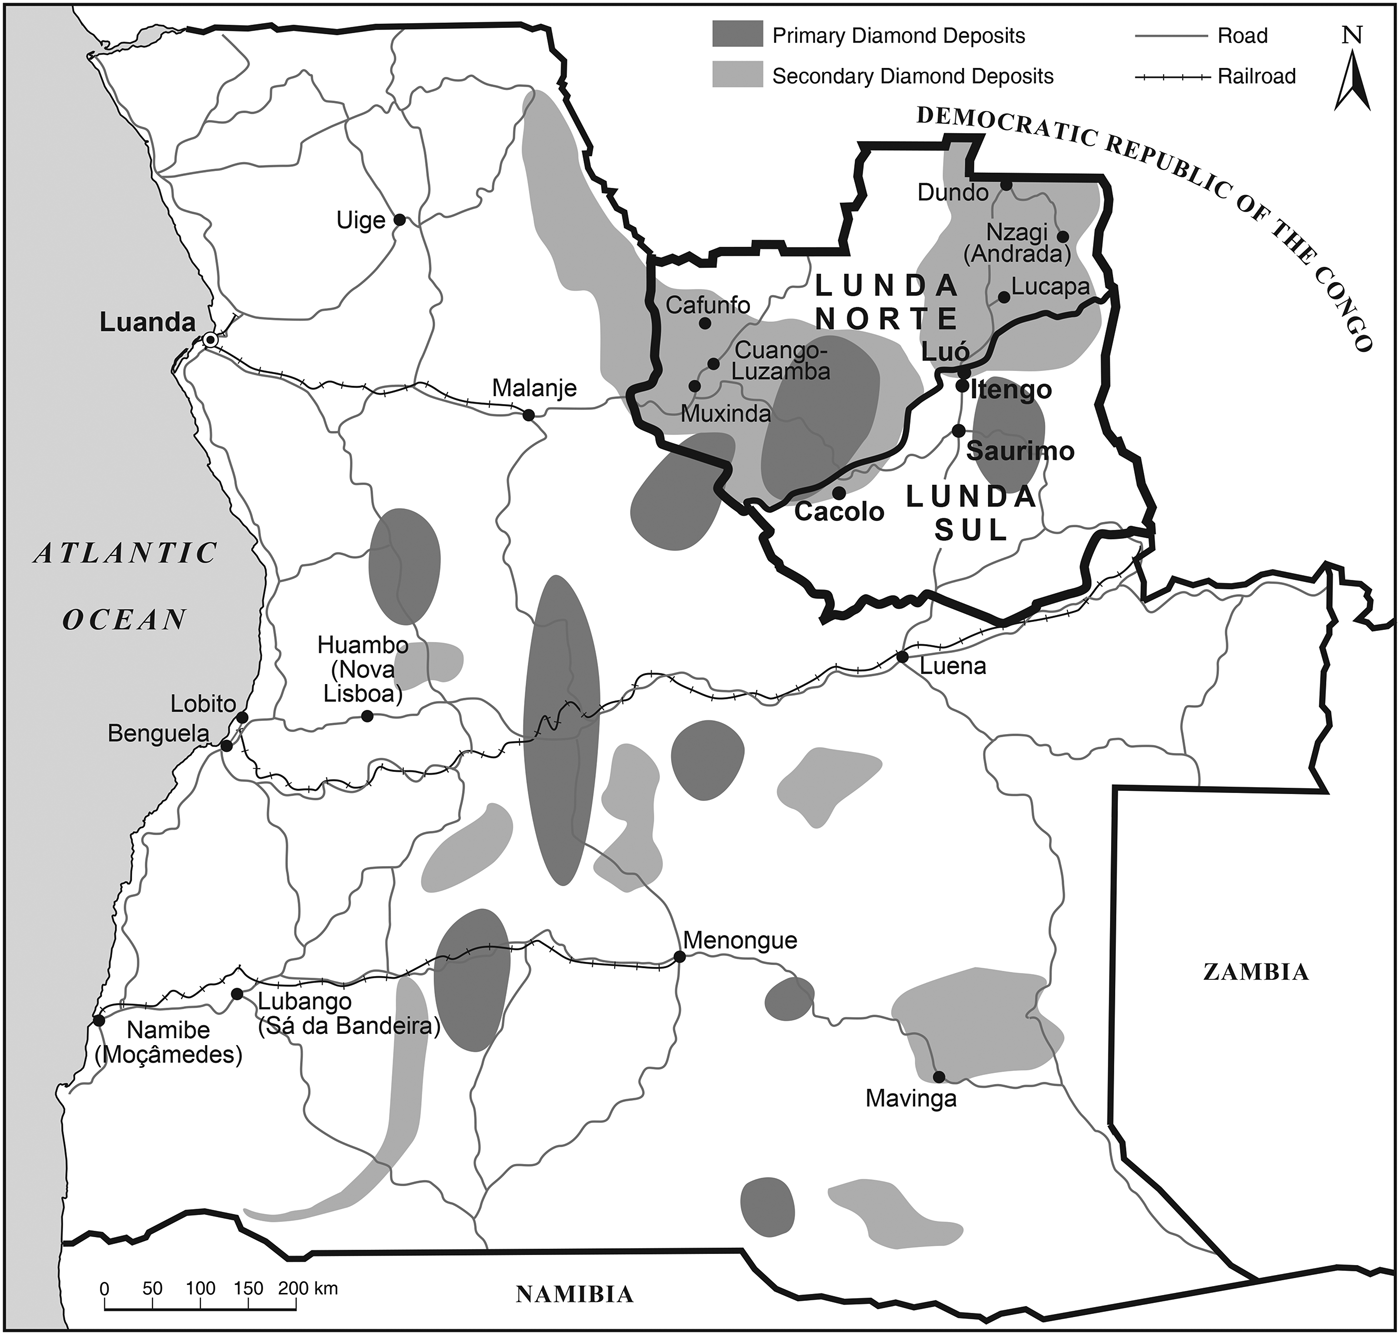
Poverty and precarity of livelihood in the Lundas at present needs to be understood in light of the return of large-scale diamond mine production, expanding urbanisation and the legacy of civil war. Catoca and Rio Lapi mines are located in Lunda Sul, while The Sociedade Mineira do Camatchia-Camagico in Luó, is on the border between Lundas Sul and Norte (Figure 1).
Angolan diamond mining areas and urban towns (Lundas provinces outlined).

LUNDAS PROVINCES: COLONIAL DIAMANG MINING ERA, 1917–1975
When diamonds first began to be mined in the early 1920s, urban growth in colonial Lundas was sanctioned by the government and solely nurtured by colonial mining firms, notably Diamang, a consortium of Belgian, British and American interests and the Portuguese state, founded in 1917 (Alencastro Reference Alencastro2014). Tellingly, it was answerable to Lisbon rather than the colonial governor in Luanda. Up to 1975, Diamang controlled the production of diamonds, the labour supply and the provisioning of urban infrastructural and housing development at all its production sites. Some of these sites grew to be large urban settlements including Dundo, the firm's headquarters (Figure 1).
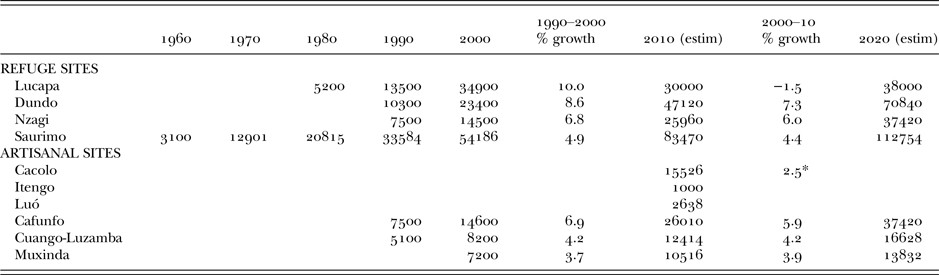
Diamang's African employees, coming from other provinces and neighbouring Congo, expanded from 2,300 in 1920 to approximately 10,000 in 1930, 15,000 in the next decade, to 25,000 in 1960 (Varanda Reference Varanda2004: 263). However, there are no population records for the province, let alone for each of the mining locations during these decades. The colonial accounts vaguely refer to very low population density until the arrival and settlement of people working in the mines (Cleveland Reference Cleveland2010). In 1960, the population of Saurimo, the administrative capital of the Lundas, was estimated at 3,100 (e-Geopolis 2013).
The colonial creation of mining cities in the Lundas was the result of the firm's initiatives, backed by state agreement. During the 1960s and the 1970s, the diamond-producing towns were under the legal jurisdiction of the state but were managed in every economic, social and infrastructural detail by Diamang, in contrast to the government's administrative centres. Diamang's colonial mining towns followed a corporate organisational pattern focused on management of the labour force and control of access to mining areas. Strict control combined with territorially extended dominance over the economic activity of the population, creating a quasi-autonomous state system – existing within the state and endorsed by the state but nonetheless exercising decision-making autonomy – responsible for almost all the social, economic and residential aspects of life in the region for decades. Clarence-Smith (Reference Clarence-Smith1983) observed:
Running practically every aspect of life in the remote north-eastern corner of Angola, with its own police, roads, dams, hydro-electric installations, radio, schools, health service, agricultural stations, rural extension services, missions and museum, Diamang had become a state within a state, referred to as the ‘ninth colony of the empire’. (p. 173)
Over the course of Diamang's mining empire, the towns of the region evolved on the basis of European and African racial and class segregation of jobs, housing and services. Class segregation was also marked among the white population. Engineers, doctors and teachers lived in the centre of the towns, whereas technicians were located in more peripheral areas. By the end of the 1930s, distinct white and black support services were instituted (Andringa Reference Andringa2009).
Originally, African men without formal employment, were not allowed to reside in the Diamang towns. Over time, the residential policy became more flexible. Approximately one-third of Diamang's African workers lived with family members in the encampments (aldeamentos) rather than in dormitories as bachelor workers (Cleveland Reference Cleveland2008: 9; Reference Cleveland2010: 94).Footnote 3 To facilitate the supply of agricultural products to the mines, a farming system was developed in the 1930s, called SPAMOI/SPAMO, Serviço de Propaganda e Assistência à Mão de Obra/Indígena, in which the miners’ relatives farmed in the mine's agricultural fields. The presence of women and families in the mining camps gradually propelled Diamang to provide company housing of ‘stand-alone houses with one, two, or three rooms, with each room intended for three workers or one worker and accompanying family members’ (Cleveland Reference Cleveland2010: 104). Beginning in the 1960s as the first independence movements started forming, Diamang encouraged relocation of entire families in order to be able to rely on an in situ stable workforce (Cleveland Reference Cleveland2008: 50, Reference Cleveland2010: 94).
Settlement in encampments and towns was managed by Diamang to accommodate and control the workforce, both the non-skilled workers and their families and the technically trained staff in spatially stratified mining towns, where all services – education, health or food – were provided by the firm. Workers’ strategies beyond their regulated existence by the mine were limited, involving only sporadic trade with neighbouring villages (Cleveland Reference Cleveland2015). Their dependence on the rules set by both the colonial state and the firm was incontestable.
Mining cities like Dundo, established in the 1920s, were built by Diamang following an American style of detached-housing for its European staff (Pearce Reference Pearce2004; Udelsmann-Rodrigues & Tavares Reference Udelsmann-Rodrigues and Tavares2012). Initially, African workers’ housing was typically rural (mud walls and thatched roofing) that they built themselves according to a set model. By the 1960s, when the company had taken responsibility for the population's housing, infrastructure and services, houses were built with cement walls and iron roofing (Cleveland Reference Cleveland2008).
Saurimo's establishment as the district capital in 1923 coincided with Dundo's launch as Diamang's production headquarters. Saurimo grew faster than Dundo, becoming a city in 1956 with a strategic location on the road linking Luanda, Malange and Dundo and proximity to the Luena railroad (Fonte Reference Fonte2007: 293) (Table I). Diamond prospecting in the Catoca valley near Saurimo began in 1965, but was short-circuited by the war (Gordon Reference Gordon2005).Footnote 4
Urban Population and Growth Rates in the Lundas Provinces, 1960–2020.

Source: http://e-Geopolis.eu, accessed March 2013; UPIMA fieldwork 2011 (Municipality and Province reports, *Cacolo Municipal Plan).
Survival and livelihood opportunity in the urban disorder of civil war, 1975–2002
The eruption of civil war after national independence in 1975 decimated the colonial synergies between mining and urbanisation. Large-scale mining, and particularly Diamang's activities, experienced erratic disruptions and eventual closure in the early 1980s. The formal mining firms of Catoca (Sociedade Mineira de Catoca Lda.) and Lucapa (Sociedade Mineira do Lucapa) that operated for relatively short intervals during the war provided jobs and housing exclusively for a select number of workers. Overall, the role of the mining companies as a catalyst for urban growth and a main provisioner of employment and housing was drastically curtailed by the civil war.
The absence of a national census between 1970 and 2014 has been a major obstacle to tracing the region's demographic change.Footnote 5 Movement of the population in and out of the Lunda Sul can only be sketched from estimates and indirect accounts. Findings from our randomly sampled household survey and qualitative interviews (in Saurimo, Cacolo, Luó and Itengo) indicate that rural-urban movement intensified with massive migration to what were deemed ‘safe’ cities controlled by the MPLA government. After inception of the war, populations moved in large numbers away from Cacolo and Itengo towards the major towns controlled by the government, while at the same time artisanal mining settlements surfaced in the previous formal mining areas. Table I shows the rapid growth of government-controlled ‘safe’ cities like Saurimo, Dundo and Lucapa.
Large numbers of farming families fled to the government-held towns. Those resident in the blockaded government refuge towns faced inadequate food supplies, deteriorating standards of living and continual uncertainty about the safety of their locational residence, living with the possibility of having to flee for survival. The provision of infrastructure and services to the population in Saurimo was technically in the hands of the MPLA government during the war, but the rapid growth of the refugee population quickly exceeded the existing infrastructure and service capacity. Access to the delivery of supplies and repair goods was blocked by UNITA, except by air.
With the partial and eventual closure of the Diamang mines, waged and salaried employment was negligible. Household production of food was rare as well given the spatially constrained nature of living in a blockaded town. Leaving the secure towns to farm was too hazardous. World Food Programme-supplied food aid kept people alive. They eked out an existence in casualised self-employed activities.
In the post-Cold War 1990s, when South African and US funding for Savimbi's army ceased, diamonds became an important source of revenue for UNITA's military operations. UNITA troops endeavoured to occupy the rich mine areas and attracted Congolese artisanal miners (Malaquias Reference Malaquias2001; Marques & de Campos Reference Marques and de Campos2005; Cleveland Reference Cleveland2008). The composition of the migrant flow to the mining sites was primarily foreign male garimpeiros Footnote 6 and businessmen. In some places, they existed alongside the forced immobility and captivity of the local Lundas population.
As two of our interviewees explained: ‘About 200 families remained in Cacolo throughout the war. The UNITA military occupied the houses they wanted and destroyed many of the others’ (F. 2011 Int.). The captive population's activities were circumscribed by the guerrillas. ‘UNITA organized Cacolo during the war. The military, the Congolese and their families lived in Cacolo; there were vaccinations, medical posts, literacy schools and shops. But if you wanted to kill a chicken, your own chicken, you had to ask for permission.’ (G. 2011 Int.).
The advance and retreat of the battle lines of war impacted on garimpeiros’ mining and the circulation of the population more generally. In the small village of Itengo, devoid of infrastructure, the population had withdrawn and taken refuge in nearby towns or Luanda when the war began. But in the latter stages of the war, Luó grew from a colonial proto-mining encampment to a garimpo boomtown, hosting a fluctuating population of garimpeiros under UNITA's control.
Most of the population remaining in the rural areas were MPLA or UNITA soldiers or artisanal miners. An indeterminate percentage of the latter were not Angolan nationals. The small UNITA-controlled villages of the region close to alluvial diamond sites became heavily populated with artisanal miners.Footnote 7 Exposed to violence and life-threatening uncertainty, the miners nonetheless pursued a remunerative livelihood digging diamonds that they sold to local diamond buyers linked to the international diamond market. The settlements pulsated with informal sector activity of traders and service providers, sustained by the diamond miners’ strong purchasing power (Boeck Reference Boeck2001). The covert ‘strategic arrangements’ between official authorities and private commercial interests were based on ‘several expedients of physical, economic and social violence’ (Marques Reference Marques2011: 25).
The war's artisanal boomtowns controlled by UNITA fluctuated in size, attracting then repelling population in-migration, as the conflict and diamond diggings criss-crossed Lundas’ vast terrain. Although the settlements’ economic growth was strong, the provision of infrastructure and services was problematic and there was no local development strategy (Malaquias Reference Malaquias2001). The garimpo areas were heavily disputed between economic, political and military actors (Marques Reference Marques2011: 71). Consequently, few invested their profits in housing and infrastructure. The instability and destruction caused by frequent military confrontation doomed any building effort. The logistics of mere survival prevented people from imagining residential permanence. Above all, infrastructural deterioration and livelihood uncertainty characterised the emerging and seized towns.
While the booming garimpo settlements saw population agglomeration in exceptionally rough and precarious circumstances, the garimpo town of Luó was massively cleared out at the end of the war in 2002, during the exodus of guerrilla soldiers and the government's evictions of foreign artisanal miners.Footnote 8
TRACING AGENCY AND PRECARITY IN THE RE-ESTABLISHMENT OF ANGOLA'S MINING TOWNS, 2002–2014
Many of the original Lundas population, who fled the conflict, returned to their home province in the early years after the war's cessation. Formal diamond mining resumed in Luó in 2005, while in Itengo, Escom'sFootnote 9 alluvial diamond mining project started production after 2015. Several actors in post-war Lunda positioned themselves to control the economy and, most importantly, politics. Through reassertion of control over artisanal and industrial diamond mining, the Angolan government aimed to finally regain hegemony in a region that had long existed under the influence of the guerrilla opposition.
Our field research aimed at piecing together how residents’ livelihoods, housing strategies, infrastructure and pattern of service consumption contributed to the evolution of urban mining settlements, how different strategies and unequal power relations led to urban development or decline, and how this impacted on residents’ quality of life either along the paths of rising prosperity or precarity. Key informant interviews with state officials provided insights into the implementation of state policies. In-depth discussions with business and service providers in the towns revealed the economic constraints and opportunities that residents wrestled with daily, albeit with highly differentiated livelihoods and resource access.Footnote 10
Bearing in mind that both private and public combinations of capital investment determine urban growth and development (Ademiluyi & Raji Reference Ademiluyi and Raji2008), the following sections interrogate the agency of the state, mining companies and urban residents in turn. After almost 30 years of war, the overriding objective of the Angolan state has been the pursuit of national stability. Mining companies’ efforts have been driven by profits tempered by corporate social responsibility concerns as well as national policies that require government approval and local compliance leaving room for possible collusion. Last but not least, the objectives of the population living in mining settlements have been anchored in the pursuit of economic survival on the part of the precarious poor and middle strata residents’ aspirations to improve their living conditions.
STATE-DRIVEN RECONSTRUCTION
The critical role of cities in state consolidation, transformation and erosion, tends to be neglected in contemporary development discourse (Beall et al. Reference Beall, Goodfellow and Rodgers2013). It would be myopic to ignore it in Angola where the state assumed the leading role in post-war urban reconstruction. The state's deliberate visibility showed a clear orientation to urban investment as a way of securing legitimacy. Angola's ‘state at work’, taking ‘ownership of development directed from above’ projected a ‘developmental state’ as part of a ‘dynamic and transitional process of state formation’ (Croese Reference Croese2013a : 1).
From 2002 onwards, national, provincial and municipal governments gave priority to political stability. In Lunda Sul, this entailed the state's concerted effort to contain and control garimpo mining, the precarious livelihood pursued primarily by Congolese migrants and Angola's urban and rural poor.
Forcibly deporting foreign garimpeiros was double-edged: an attempt to rid the country of Congolese migrants who may have collaborated with UNITA, and a way to prepare the way for large-scale diamond production by mining companies to the exclusion of artisanal miners. The Angolan state in fact increased its military expenditure in the aftermath of the war (Soares de Oliveira Reference Soares de Oliveira2011), demonstrating its power, particularly in the Lundas. The resort to violence by military personnel implementing the expulsion provoked the international community's outcry against human rights violations in Angola (Marques Reference Marques2011).Footnote 11
Meanwhile, post-war removal of landmines in the Lundas’ large-scale mining concession areas facilitated corporate diamond mining's take-off. Corporate mining investment underpinned remarkable economic growth recorded at 15% in 2002, reaching 23% in 2007 before being slowed down by the global economic crisis of 2008.Footnote 12 In 2013 and 2014, annual growth steadied at 6%. In Angola, the Lundas contributed to this impressive post-war economic recovery through its diamond output.Footnote 13 In 1974, pre-civil war Angola produced 2.4 million carats a year, while in the 2000s, the annual average reached 8.5 million (Hodges Reference Hodges2001).
Saurimo's rapid post-war growth was boosted by Catoca's extraordinary diamond wealth, alongside its administrative role as the provincial capital. Catoca mine was Angola's richest diamond mine, producing 7 million carats valued at $122.6 million in 2009 and 6.7 million carats in 2012, representing approximately 80% of Angola's total diamond output in that year.Footnote 14
The diamond wealth of the region contrasted with the region's transport inaccessibility and poverty. According to the National Institute of Statistics’ estimates (INE 2010), 36% of the urban population of the eastern provinces were classified as poor, while in the rural areas the figure reached 58%. During the many years of war and agricultural collapse, reliance on garimpo became a significant form of livelihood for the Angolan precariat. A ban on artisanal mining was bound to raise welfare concerns for the local population. Residing in a remote region that had historically been marginal to Angolan state governance but central to the global diamond market, raised an existential paradox for the local people: ‘If hunting, fishing and collecting salt is not a crime, why is diamond digging considered a crime?’ (M. 2011 Int.).
In the context of rising global prices for metals and gemstones, surges in artisanal mining were occurring in most mineral-rich countries in Africa at the turn of the 21st century (Bockstael & Vlassenroot Reference Bockstael and Vlassenroot2012; Bryceson et al. Reference Bryceson, Fisher, Jønsson and Mwaipopo2014). However, in Angola with the granting of mining concessions, the erstwhile centrality of garimpo came under state attack (Marques Reference Marques2011). Populations in the artisanal boomtowns saw far fewer investments made in infrastructure and services. Settlements were downsized. People who remained reliant on artisanal diamond mining did so surreptitiously. The most determined sought new richer diamond sites in remote areas to evade official surveillance.
While the MPLA-led state denigrated garimpo and its inferred rural backwardness, it proactively asserted its control over the region at provincial, municipal and commune levels, by prioritising towns’ formal economies and establishing the administrative foundations for investments in housing and infrastructure rebuilding. The widely publicised state slogan ‘Angola growing more and distributing better’ referred to a panoply of building programmes. Modern urban housing and service facilities were the most conspicuous targets, given the vast stretches of slum housing (musseques) that ringed towns and cities throughout Angola, not least in the Lundas. Combined with numerous private and public/private projects, ‘new centralities’ (novas centralidades) and social housing schemes (the biggest being the One Million Houses programme) were planned for municipalities throughout the country, fuelling the people's imaginative quest for ‘a good life’. These building projects were in various stages of planning and building at the time of field research,Footnote 15 some delayed by corrupt practices.Footnote 16
Village agglomeration projects, it can be argued, constitute an early stage of urban development in Lunda Sul, led by the government, and supported by mining firms through their corporate social responsibility programmes.Footnote 17 The projects were aimed at facilitating economies of scale in the construction of permanent housing and the provision of pumped water, electricity, sanitation as well as schools, health centres and other community services. More recently, some settlements were constructed to accommodate 750 families with the support of the mining corporations.
Endiama, the government's diamond mining parastatal, serves as an organisational umbrella over the privately owned mining corporations. Mixed state and private sector investment was the state's strategy in relation to their housing schemes,Footnote 18 as exemplified by the building of the Zorro neighbourhood settlement of 300 houses for low-income mine workers and their families for Catoca mine, Angola's biggest diamond mine. The Saurimo project unifying villages adjacent to the Catoca mine comprised three neighbourhood projects (Muandonge, Luenda and Caxita), with the objective of nuclearised settlement for over 2,700 people. Sacachima and Muatoio had already been unified to consolidate housing for approximately 120 families (U. 2011 Int.; L.C. 2011 Int.).
In Angola, the state's presence became visible in all aspects of urban and infrastructural reconstruction after the civil war, referred to as the ‘state at work’. But the government housing programmes had vocal sceptics. Reviewing the nature and impact of the Kilamba housing project built in 2008 in the outskirts of Luanda, Croese observed:
The Kilamba project has come to illustrate the growing disconnect between the Angolan government and the people and the feeling amongst many Angolans that it is not poverty that is being combatted, but the poor themselves for whom there is little place in the post-war narrative of reconstruction, development and modernization. (Croese Reference Croese2013b : 5)
The government's Public Investment Program (PIP, Programa de Investimento Público) was pointedly focused on rehabilitation of education, health, transport and communications facilities. The province of Lunda Sul had a budget of roughly US$43 million in 2011. A large amount of it was channelled to the urban municipal headquarters and to the capital of the province. Lunda Sul's infrastructural investments were intended to address war destruction and absence of construction throughout the war.Footnote 19
Beyond building roads, urban housing and social service facilities, the state's major projects in Lundas were the construction of the Chicapa hydroelectric dam (Hidrochicapa) and the rehabilitation and expansion of the piped water supply system. Private capital was active in opening up banks, insurance companies and extending the provincial telecommunications network.
The paradox in this mega infrastructural reconstruction and expansion programme was that the work being generated was bypassing large segments of the local population who faced mounting unemployment. Construction firms opted for skilled workers from elsewhere, who were transported to the construction sites. The Director of the Cacolo employment and vocational training centre remarked that most firms seek to employ a qualified, specialised workforce that was not on tap in the Lundas (I. 2011 Int.). Higher paid jobs in Lundas’ large-scale mining were out of the local population's reach since they had not been availed educational opportunities during the war decades.
Thus, local unemployment was high, and the jobs at hand tended to be casual with unpredictable or seasonal periodicity, particularly in construction. In effect, the indigenous adult population of the Lundas had little hope of secure waged jobs let alone careers. They were part of the war's lost generation, who could not compete in their own booming regional labour market, in the face of direct international competition from Chinese contract construction workers, expatriate Portuguese and other nationalities who flocked to mineral-rich Angola, attracted by the high wages and salaries paid for skilled labour compared with salary levels in their own countries (Soares de Oliveira Reference Soares de Oliveira2011). Paid employment for the poor tightened further with the 2014 fall in global oil prices and consequent widespread deterioration in the Angolan economy.
Mining company agency
The interventionist role of the Angolan state in the Lundas post-war urbanisation process was not equalled by the mining firms, which distanced themselves from their pro-active role in colonial housing development and infrastructural construction. Corporate social responsibility (CSR), emanating from the firms’ quest for local legitimacy and acceptance (Wiig & Kolstad Reference Wiig and Kolstad2010), tended to be pursued at a restricted project level, positioning mining companies in a marginal development role in the Lundas. Recurrently called upon to support government programmes and participate in local development, mining firms’ intervention was comparatively weak.
While Catoca mine's expenditure on development-related activities at the local level centred on ‘the companies’ social security funds, health coverage, meals and insurance during the colonial period, staff perks after the civil war were restricted to health services and workers’ credit schemes. Workers could apply for Monuhaha credit to buy a house in the Zorro project or in Luanda in projects such as Nova Vida or Jardim do Éden, which suited Catoca's non-Lunda long-distance migrant workers, but was less generous than what government civil servants received.
The national and international context had become radically different in the post-war period. Transnational corporate mining firms streamlined staff costs vis-à-vis accommodation and benefits and where possible casualised the labour force (Fraser & Larmer Reference Fraser and Larmer2010). The price of diamonds on the world market was relatively depressed from 2000 onwards.Footnote 20 No one firm held a monopoly in Angola in the way that Diamang had in previous decades. The firms’ CSR programmes delimited their outreach to improvements in the mining compound and immediate surroundings.Footnote 21
The government preferred to steer the mines towards direct social service contributions to the national budget. The Brilhante foundation, in conjunction with the government's mining parastatal, Endiama, managed the pooled contributions of Angolan mining firms. Angolan mining policy stipulated that 10% of corporate taxation had to be allocated to the provincial state's budget. Beyond projects in the area of rehabilitation of historical buildings and construction of schools, there is little available information about Fundação Brilhante's expenditure in the Lundas (Blore Reference Blore2007).
Despite the marked differences in size and type of large-scale capitalised mining firms, most hired educated, labour-specialised employees who were expatriates or Angolan nationals from other provinces, notably Luanda. At Luó mine (Camatchia-Camagico), one quarter of the 1,200 local workers lived in nearby bairros and the firm provided transportation for them within a 10 km radius. ‘Only a handful of people from the neighbouring Luó village work at the mine; all are employed in unskilled posts’ (P. 2011 Int.). Those living in Saurimo (72 km away on a rutted road) stayed at the mine encampment during the week. The mine's 200 expatriates lived in the mine compound for 30 or 60 days followed by 7 or 15 days leave.
In 2011, Catoca mine had 2,070 workers, almost half of them were expatriates or non-Lunda residents engaged in circular migration.Footnote 22 Large-scale mines such as Catoca and Luó offered their expatriates and Angolan nationals from other provinces bachelor housing, meals and medical services at a basic level. The local workers were hired on an outsourced basis, living in Saurimo or around it and were not afforded the perks received by the more educated staff.
Mining firms’ housing policy mostly eschewed the colonial model of workforce stability, having jettisoned permanent contract workers in the encampments. Instead, Catoca and Luó mines provided accommodation solely for their workers, not their familiesFootnote 23 in line with the neo-liberal global trend for labour cost minimisation (Fraser & Larmer Reference Fraser and Larmer2010). Nonetheless, mining staff's livelihood circumstances were generally more comfortable and secure than that of other residents of the mining towns.
The Lundas population's urban residential stability, access to housing and reconstruction of livelihood
In 2002, the devastation left in the wake of the civil war combined with the return of the population (including the military) to their areas of origin and the eviction of foreign garimpeiros, profoundly reconfigured the composition of Lundas’ urban settlements. Many of the indigenous population sought to disassociate themselves from the garimpo towns. Population gravitated to the formal townsFootnote 24 associated with corporate mining, not because they expected to get mining jobs. Rather they served as locational concentrations of higher purchasing power where a multiplier effect was coalescing to support diversified sources of income. Livelihood patterns in the Lundas were no longer constrained in the larger towns by life-threatening circumstances or goaded by a blood diamond economy at the artisanal mining sites. Residents of the provincial towns were returning to their home area or coming in as new migrants.
Urban residents’ material security rested on seven potential sources: (1) artisanal mining, (2) self-employed income generation, (3) household agricultural production, (4) formal employment (mostly government), (5) formal mine wages, (6) extra-wage benefits from employers such as housing, pensions, etc. and (7) state benefits such as health, education and welfare. Lunda Sul's urban households had been subjected to restricted access to the latter five livelihood forms during the preceding five decades due to the civil war and the fluctuating presence of diamond mining companies and welfare-dispensing capacity of the Angolan state.
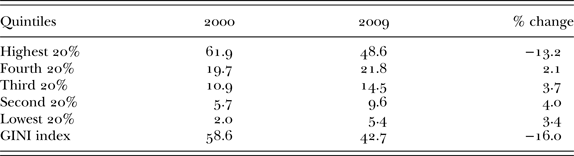
World Bank estimates of the Gini coefficient in Angola suggest that between 2000 and 2009, there was positive improvement for the lower four income quintiles in the country as a whole, whereas the top quintile evidenced a quite high reduction in wealth (Table II). Nonetheless, the poverty headcount ratio of those earning $1.90 per day showed only a slight improvement from 32% in 2000 to 30% in 2008 (World Bank 2017). The INE data cited earlier suggests that approximately one-third of the urban population and almost 60% of the population in the eastern part of the country constituted an impoverished precariat.
GINI index and quintile distribution of income shares in Angola, 2000 and 2009.

Source: World Bank 2017, World Development Indicators.
Our household survey findings represent a snapshot of the variability of household livelihood pre and post-war at four urban study sites. Saurimo, founded in 1923 as a colonial settlement, is the largest city in the province. Cacolo, established earlier in 1910, was a former UNITA-held diamond-trading site for many years. Luó emerged as a mining town in 1973 having been a UNITA-held artisanal site for long periods of the war. Itengo is a traditional village-cum-mining town, emptied during the war but thereafter became the residential site of the traditional authority, which local people gravitated towards.
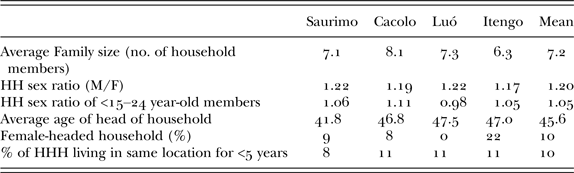
Since the war, household stabilisation got underway, as reflected in our survey data (Table III). Fifty-five per cent of sampled household heads had lived in their current location for over 10 years. Households were large, averaging seven members, very different from the bachelor norm that characterised Lundas’ artisanal mine rush sites and boomtowns during the war. Nonetheless, the economically active adult sex ratio was still biased towards men. But in the case of Itengo, there was a strong presence of female-headed households, hinting that male household heads were migrating to other Lundas mining areas, leaving their wives behind. Itengo and Luó were no longer covert sites for artisanal mining. Garimpeiros were more likely to be found at remote mining locations in the Lundas countryside. Households in urban locations, on the other hand, attracted young extended family members seeking the chance to attend school.
Measures of residential stability.

Source: Authors’ UPIMA survey data.
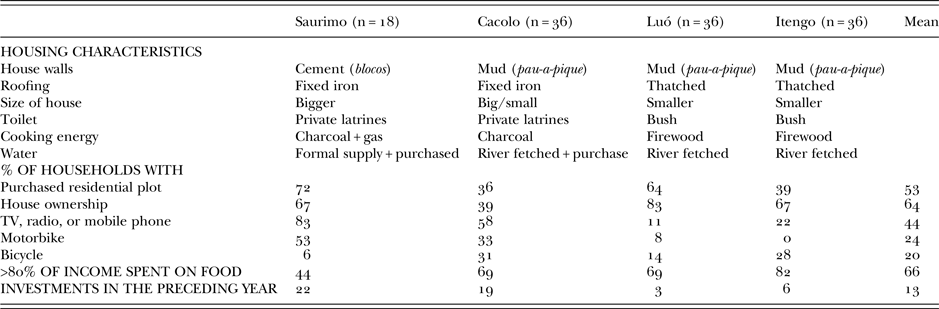
While Saurimo and Cacolo, as formal towns, differed from the informal garimpo sites of Luó and Itengo during the war, Table IV confirms a stepped progression of material well-being ranging from the current large cosmopolitan city of Saurimo to Itengo, a small urbanising settlement. Luó joined Cacolo as an ‘in between’ case, bridging the marked divide between Saurimo's relative urban affluence and Itengo's rural-like simplicity. Luó’s garimpo status was being replaced by the presence of a formal mine labour force, with a few households being availed higher income levels. The portion of income spent on food was a clear indicator of the extent of poverty or wealth in the settlement. In Saurimo, 44% of the households spent over 80% of their money on food while in Cacolo and Luó the percentage was 69%, with Itengo notably the poorest at 82%, suggesting that household precarity was inversely related to the size of the urban settlement.
Summary of housing characteristics, asset ownership and investment by settlement.

Source: Authors’ UPIMA survey, 2011.
Residents’ housing investments were a telling indicator of residential stability and economic aspiration (Table V). Of the surveyed household heads in all locations, 64% of the respondents owned the house they lived in and 56% had purchased their plot and built their house as their financial resources allowed over the years. However, saving money for other investments was not easy. Only 13% of the interviewed household heads had made investments during the preceding year. Roughly one-fifth of households in Cacolo and Saurimo were able to invest as opposed to barely six and three per cent of households respectively in Itengo and Luó.
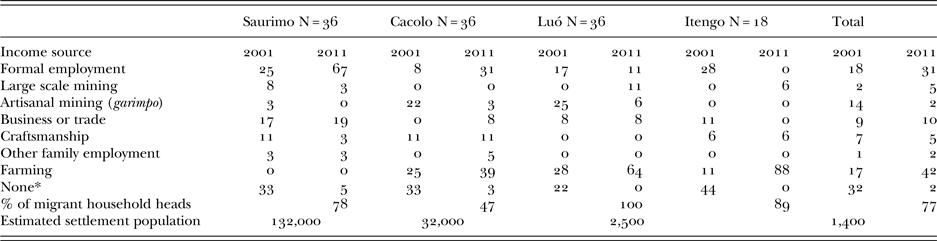
Surveyed households’ main income sources, 2001 and 2011 (% of households).

Source: Authors’ Angola UPIMA survey data.
* The high percentages relate to the fact that during the war many households depended on food aid and other basic needs provisioning from humanitarian agencies.
The standard of housing of the surveyed households ranged from modern urban dwellings with permanent walls and roofing to traditional rural materials of mud walls and thatched roofs. The gradation from superior to inferior housing again related to settlement size from the largest to smallest settlement. Residents of Saurimo had more economic opportunities and were achieving higher income and welfare on average.
Having considered the agency of the state and mining companies in post-war urban rebuilding, it is useful to contrast the Lundas residents’ agency in different types of towns. In 2001, formal mine employment was dominant in both the largest (Saurimo) and smallest (Itengo) settlements, while artisanal mining prevailed in the middle-sized towns of Cacolo and Luó. By 2011, with the reported virtual disappearance of artisanal mining in all towns, investment by the state, mining firms and not least household investments were readily evident in the formal towns such as Saurimo and Cacolo, as opposed to settlements like Luó and Itengo where 64% and 88% of the surveyed households were primarily surviving on their agriculture production in 2011, compared with 28% and 11% previously in 2001. The incidence of farming in Luó had more than doubled, while Itengo's farming households increased by 7.5 times. In the highly urbanized capital of Saurimo, no survey households were farming in 2001 or 2011. Cacolo was again in the middle, with 25% of households farming in 2001, climbing to 39% in 2011.
Nonetheless, there was little evidence that people were enamoured with farming. In the wake of a protracted war, generally more than one generation of households had been removed from agrarian work and lifestyles. Many families no longer had sufficient farmland or competence in agricultural skills. Furthermore, despite extensive demining operations since 2002, the threat of encountering landmines while farming persisted.Footnote 25
Not surprisingly given state policies against garimpo, the reported incidence of artisanal mining was in decline from a significant income-generating activity for 14% of the households in 2001, to only 2% in 2011. But anecdotal testimonies suggested that the absence of artisanal mining may have been a matter of locational displacement rather than disappearance per se. As local observers remarked:
Luó was much bigger in the 1990s. Now it is decreasing and there are empty houses. People move to the city [Saurimo]. (M. 2011 Int.)
The garimpo brought many people here but today the population is going bankrupt because of the artisanal mining ban; they have to dig furtively. (J. 2011 Int.)
Many people, especially young men and the poor as well as others who needed extra cash, surreptitiously pursued garimpo, running the risk of being caught. The risk was matched against the potential reward of questing for lubóia, the ‘big stone’ that people traditionally believed could bring them economic salvation (Udelsmann Rodrigues & Tavares Reference Udelsmann-Rodrigues and Tavares2012; Bryceson Reference Bryceson, Resnick and Thurlow2015). During the war years when ‘people were unable to go to the fields to get food … they would say they were “going to get something for their pocket” meaning that they were going to do garimpo in the morning in the hopes of coming back with income in the afternoon’ (A.C. 2011 Int.). However, at the time of our survey in 2011, urban residents were prevented from mining in the vicinity of their home and had to go covertly further afield to find diamonds at remote sites.
Displaced from wartime military and artisanal mining livelihoods and largely devoid of expertise and skills that could be deployed in the prevailing job market, many Lunda Sul urban households struggled to adapt and survive. The uncertainties of war had ended, but precarity of livelihood remained. The war years had exposed most of the population to precarity, whereas in the post-war period, the urban precariat shrank in number and became especially concentrated amongst relatively uneducated migrants living in the smaller urban settlements.
TEMPORAL AND SPATIAL RELATIVITY OF PRECARITY
Angola's diamond-rich Lunda Sul province experienced tumultuous change during the latter half of the 20th century. The protracted civil war, in which UNITA and MPLA soldiers battled, inflicted decades of deprivation and precarity on all Lundas residents. Scheidel (Reference Scheidel2017) maintains that war, particularly civil war, is a ‘great leveler’ of differences in wealth, and so it was for the vast majority of the population during Angola's civil war, with the exception of the highest echelons of leadership with direct access to the wealth emanating from oil and diamond exports.
The MPLA government took the leading role of managing the ‘formal’ refuge cities, notably Saurimo, throughout the war and Cacolo and Luó in later stages, but was unable to adequately provision the urban population. International humanitarian agencies stepped in to supply food and other critical basic needs.
Between the cessation of the war in 2002 and 2014, the Angola state re-instated its alliance with international mining capital. Investment by several foreign mining companies on neo-liberal contractual terms enhanced the Angolan state's revenue, affording financial capability to address the precarity and equity imbalance of the war years. Urban infrastructural development plans of the state and to a far lesser extent mining companies unfolded haltingly. State efforts, however, predominantly centred on Luanda, where a modernising technocratic vision held sway. In the Lundas, infrastructural investment focused on the larger urban settlements, providing patchy improved access to public services alongside income gain primarily for urban residents with employable skills and education, related to Angola's improved Gini index between 2001 and 2009.Footnote 26
Both Angola's ‘developmental state’ and mining corporations have not tackled the widespread structural unemployment that pervades the national economy. Quite the opposite, in the Lundas, the state's policy backing for large-scale mine production and reliance on foreign expertise and labour, while banning artisanal mining, exacerbated the urban poor's livelihood circumstances.
Garimpo had served as a flexible and remunerative form of livelihood and vital mainstay for many households during the war decades. The garimpo boomtowns embodied migrants’ personal survival tactics and economic ambitions alongside UNITA's war chest concerns. When UNITA was expelled from Lunda Sul and the civil war became history in 2002, garimpo remained a vital surreptitious fallback source of income for unemployed youth and the poorest strata of the local population.
Ruling African elites that endeavour to secure peace through political stability, infrastructure building and regional integration receive donors’ good governance seal of approval. Questions remain, however, about whether a government's attempt at ‘control over all aspects of life’ can reduce poverty (Schubert Reference Schubert2010; Soares de Oliveira Reference Soares de Oliveira2011). The Angolan state was heavily criticised for sacrificing human rights in its pursuit of political stability and regional integration.
Returning to Cox & Negi's (Reference Cox and Negi2010) critique of the African developmental state, the post-civil war Angolan state and the country's urban elites have continued to pursue their historical alignment with international mining interests in the 2000s, failing to effect transition of localised populations from precarious subsistence forms of livelihood towards active participation in remunerative labour and land markets. The Angolan developmental state's infrastructural investments have largely amounted to dabbling with appearances in the Lundas as far as the poor are concerned. The revitalisation of the large-scale mining sector provided a ladder out of precarity for some segments of educated Angolans while leaving those who were relatively unschooled and unskilled resorting to farming and covert artisanal mining in hide-away rural areas. Displaced by state policies and international mining companies’ mining investment, they have been unable to lever themselves out of poverty, in effect, sinking into a deep pocket of the global precariat, submerged under the increasingly capitalised Lundas mining landscape.