‘[…] the negative association between ethnic heterogeneity and public goods provision is so widely accepted – Banerjee et al. (Reference Banerjee, Iyer and Somanathan2005) go so far as to describe it as “one of the most powerful hypotheses in political economy” (639)’.Footnote 2
What is the effect of language on growth? Consider Indonesia. Although half the population spoke Javanese at independence in 1949, the government chose Malay as the official state language. To give it a nationalist feel, Malay was renamed Indonesian. And while Malay had been widely spoken throughout Southeast Asia because of trade, the dialect spoken across Indonesia – all 18,000 islands – was quite different from the one classified as ‘Indonesian’. It was a language that required standardization. Moreover, since it lacked depth in vocabulary, many loan words were needed. Upon assuming office, Suharto (1967–98) designated Indonesian the exclusive medium of instruction in schools. All 700-plus other vernacular languages were banned from the classrooms.Footnote 3 This exposed a generation of students to Indonesian as a second language (L2).
Now consider the Philippines – another linguistically heterogeneous (185 languages) archipelago (7,000 islands) state in Southeast Asia. At independence in 1945, the Philippine government designated Tagalog as the state language. Whereas Malay was considered a lingua franca in Indonesia, Tagalog was the language of the plurality in the Philippines. Given the ethnic overtones, initial national efforts to teach the state language in the classrooms were futile. The government even renamed the language twice – first to Pilipino (1959) and then to Filipino (1973). The name changes notwithstanding, in the non-Tagalog areas, vernacular languages continued to be used in schools; Pilipino/Filipino was hardly taught – and if it was, it was taught poorly.Footnote 4 Coupled with high dropout rates outside of Manila,Footnote 5 a sizable population was left with a weak command of the state language.Footnote 6
While Indonesia and the Philippines are by no means the only countries where language has been a salient political issue, examining them can help elucidate the general relationship between language and growth – a relationship that we can (and will) test statistically. Neither country existed in its current name prior to the arrival of the Europeans (the Dutch in Indonesia and the Spaniards in the Philippines). At the time, both countries were merely a scattered collection of islands across an ethnically diverse archipelago. Upon independence, this lack of shared collective identity proved to be a challenge for state-building efforts. These struggles were magnified in post-WWII economic struggles. The two countries found themselves with empty coffers and torched farmlands – no trivial matter, given their dependence on agriculture. At the time, neither country could sustain its own rice production.Footnote 7 While both countries flirted with democratic structures in the early post-independence decades, the 1960s would usher in a long-ruling autocrat in both (Suharto in Indonesia and Marcos in the Philippines). It is also fitting to note that both men were anti-communists in their political ideology.
Yet despite having similar political paths dating back to colonialism, the Indonesian and Philippine economic trajectories could not have been any more different. During Suharto’s rule (1967–98), Indonesia’s miraculous growth garnered global attention. The World Bank even classified it as a ‘high performing Asian economy’ (HPAE). In contrast, during Marcos’ tenure (1965–86), the Philippines struggled as ‘the sick man of Asia’. In fact, in the same report that designated Indonesia as an HPAE, the Philippines was the only capitalist (that is, non-communist) East Asian country left unmentioned. Admittedly, there are multiple explanations for the economic divergence between Indonesia and the Philippines. But in this article, we focus on one such explanation: the effects of language. Specifically, we are interested in the mechanism linking language and growth.
The purported advantages of ethnolinguistic homogeneity for an economy are well documented.Footnote 8 Language is a cultural marker.Footnote 9 Among co-ethnics, we are more likely to witness shared preferences – preferences over whose welfare to consider, which public goods to produce and to what extent to offer said goods.Footnote 10 But when a country is heterogeneous, there is an amalgamation of conflicting preferences. This tension can result in the under-spending of core public goods and the over-spending of targeted private goods.Footnote 11 Over time, such arrangements can be detrimental to a country’s economy.
As a cultural marker, language also situates people into ‘imagined communities’.Footnote 12 Within this community, co-ethnics have the technology to identify each other quickly and interact efficiently and accurately – all on a regularized basis. Co-ethnics also share norms of reciprocity: they have instruments to make it easier to monitor each other.Footnote 13 In contrast, such benefits are not afforded to those in the out-group. Exchanges across languages necessitate translations, are time-consuming and risk misunderstanding. In sum, these transaction costs can impede growth.
The alleged robustness of the link between ethnolinguistic heterogeneity and poor economic performance is evident in the opening epigraph. Consistent across these analyses is the focus on language as a tool exclusively for demarcating ethnic group boundaries. Yet language serves another – arguably, primary – purpose: it is a vehicle of communication.Footnote 14 When two individuals speak the same language, they can interact with greater efficiency. Since individuals can speak multiple languages,Footnote 15 the boundaries of a spoken language need not always be congruent with the boundaries of the ethnic group. Consider the example of Indonesian in Indonesia. When a language transcends ethnic groups, there is a larger population that can interact in the same language – regardless of what other languages each individual can also speak. Under such conditions, business exchanges flow with greater efficiency, and this efficiency has positive implications for economic growth.
By focusing more on who can speak a language and less on who identifies culturally with the language, this article calls attention to the efficiency-enhancing function of languages. In particular, we argue that when individuals – regardless of their ethnic identities – interact in the official state language, economic exchanges are more efficient. In aggregate, it is not the ‘ethnic structure’ per se but rather the ‘ethnic practice’Footnote 16 that is conducive to economic growth. This is true even if the individual’s mother tongue (L1) is not the official state language. Instead, what matters is that the individual has had the opportunity to learn the official state language at a minimum as a second language (L2).
This article proceeds as follows. We begin with a review of the arguments positing why ethnolinguistic heterogeneity stunts growth. We raise concerns about (1) the conceptualization of language as strictly an ethnic marker, and correspondingly (2) the coding of ethnolinguistic heterogeneity as static. We argue that countries with larger populations of official language speakers have higher growth rates than those with smaller populations. Moreover, this effect can nullify that of ethnolinguistic heterogeneity. We test our argument using an original cross-national and time-variant measure of not just mother tongue speakers but also of second-language learners of the official state language. The results from these tests are encouraging: countries with exogenously high levels of heterogeneity can avoid ‘the growth tragedy’Footnote 17 by endogenously teaching the official state language in schools, even as a second language.
ETHNOLINGUISTIC HETEROGENEITY AND ECONOMIC GROWTH
In their seminal 1997 article, Easterly and Levine argued that ethnolinguistic heterogeneity has a tragic effect on growth.Footnote 18 They found that in Africa, countries with higher levels of diversity are also the ones that have growth-impeding conditions (for example, low literacy, political uncertainty, weak financial institutions, suspect monetary regimes, excessive public deficits and inadequate infrastructure). The strength of this association between ethnolinguistic heterogeneity and low economic growth is so robust that Posner notes, ‘Thanks largely to their article [Easterly and Levine (Reference Easterly and Levine1997)], it is now de rigueur for economists to include a measure of ethnic diversity in their cross-country growth regressions’.Footnote 19
There are several explanations why ethnolinguistic heterogeneity stunts economic growth. One is about shared preferences. Members of the same ethnolinguistic group are more likely to consider the welfare of co-ethnics, to value the same outcomes and to choose to work together.Footnote 20 These shared preferences are especially pronounced when public goods provision is a (perceived) zero-sum game.Footnote 21 While there is no evidence of tension between ethnic groups over the general idea of public goods provision, there is conflict over the specific type or location of services.Footnote 22 For example, an ethnic group may support the construction of a hospital, but the support may be conditioned on whether the hospital is built in a location that would benefit the concerned group.Footnote 23 The absence of these public goods can retard growth.
Secondly, individuals may be more co-operative with co-ethnics not because of preferences per se, but because of ease. When individuals are from the same ethnic group, they operate with greater efficiency (efficacy), understand each other more accurately (readability), interact more frequently (periodicity) and identify each other more quickly (reachability).Footnote 24 This larger ethnic network and its inherent set of rules guide interactions – including those in the marketplace. It is easier to enter into contracts and enforce agreements with co-ethnics than across ethnic boundaries.Footnote 25 When an ethnic group in a polity confines its businesses to only within the group, this can limit the state’s overall growth.
Despite the conventional wisdom linking diversity and growth, there are reasons to remain cautious of the mechanisms. Here we highlight two concerns. The first has to do with conceptualization. Even though ethnicity is conceptually much larger than just language – for example, religion or raceFootnote 26 – language has often been used by political scientists as if it were the most important or salient ethnic marker.Footnote 27 For instance, the most commonly used measure for ethnic heterogeneity is the Ethnolinguistic Fractionalization (ELF) index. The data source is the Soviet Atlas Narodov Mira, which has been widely used by scholars, including Easterly and Levine.
In political science, there has been no shortage of critiques levied against the use of ELF. These critiques fall into one of two types. The first is about political relevance. Not all ethnolinguistic groups have the same political influence. Some are simply a demographic classification; others are politically relevant.Footnote 28 The second type of critique is about the need to consider other dimensions, whether it is about religion,Footnote 29 the structure of inequality,Footnote 30 geographical dispersion,Footnote 31 or the institutionalizationFootnote 32 and polarizationFootnote 33 of these cleavages.Footnote 34
Despite these calls for re-conceptualizing ethnicity, a common denominator across these works – including Easterly and LevineFootnote 35 – is the treatment of language strictly as an ethnic marker. Focusing on language as a cultural marker overlooks how language is a tool of communication. Knowing the same language can expedite interactions and allow for co-operation.Footnote 36 The reach of this technology need not, however, be confined exclusively to ethnic boundaries. Instead, it can cross-cut ethnic identities. When individuals know a second language, they can interact efficiently with speakers of two different ethnic groups.Footnote 37 Language learning is additive; being conversant in a second language does not imply that individuals are changing their identities or that there is ‘social consensus or harmony’.Footnote 38 It does, however, reduce transaction costs: individuals from different ethnic groups can communicate without the help of interpreters and translators. In short, ‘bilingualism is of the essence in regard to communication’.Footnote 39 We argue this efficiency is important in facilitating economic growth.
The second concern relates to coding. Because the extant literature conceptualizes language as an identity marker, the boundaries of the language must match those of the ethnic group (that is, those whose mother tongue is strictly that language). For example, the ELF index uses a Herfindahl concentration index to measure the likelihood that two people selected at random will be from two different ethnic groups (that is, speak two different languages). Although the ELF index is commonly employed, its use is problematic. By focusing on the country’s ethnic structureFootnote 40 – that is, language as a demographic marker – it treats the number of speakers of any language as static. Moreover, it assumes that ethnic group categories – necessary for calculating the index – exist because of some apolitical process. Yet there is reason to believe group institutionalization – which groups are salient and which ones appear on a census – is very much a product of politics.Footnote 41 The same concern plagues many of the alternative ethnic fractionalization measures. Alesina et al.,Footnote 42 for example, use ‘mother tongue’ data strictly from the 2001 edition of the Encyclopedia Britannica. Similarly, Fearon’sFootnote 43 measure fills in missing ELF country years with the CIA World Factbook, Encyclopedia Britannica and Library of Congress country studies. While these individual sources are available across different years, the resulting Fearon measure is static.Footnote 44
However, not all individuals are monolingual. Some are (exogenously) raised in bilingual families. Others (endogenously) learn a second language. When people study a language, the number of speakers increases – even if demographically, the group whose claim to the language as a mother tongue does not change. In this article, we focus on the ethnic practice of the language.Footnote 45 We code not only those who speak the official language as a mother tongue (L1) but also take into consideration the population of second-language (L2) learners – over time.
LINGUISTIC EFFICIENCY AND ECONOMIC GROWTH
There are transaction costs when two individuals cannot communicate in the same language – any language.Footnote 46 It may be a trivial matter to translate a few words here or there. But over time and across multiple interactions, these costs build up. The European Union, when it was comprised of only fifteen member states, spent an estimated €686 million annually on translation costs. And then when it expanded to twenty-eight members, the costs correspondingly soared to over €1,123 million – enough to pay 10 per cent of the commission’s workforce.Footnote 47
Although an extreme example, the European Union case clearly highlights that while translations are a solution to communication challenges, they are nowhere near as cost effective as direct communication.Footnote 48 When individuals can interact in the same language, this increases efficiency. The purported benefits of engaging in the same language can be observed regardless of the ethnic identities. What matters is that the individuals know the same language. Individuals need not be monolingual. Consider two individuals. Ana is a monolingual alpha speaker. Bill is a native beta speaker but has studied alpha in school. In a country where language is a politically salient marker, per conventional ethnic fractionalization measures, Ana and Bill would be classified into separate ethnic groups based on their mother tongues – and often using decennial census data. This demographic difference – in preferences and in ease of co-operation – would be why we see growth impeding behaviors.Footnote 49 We argue differently. The fact that Bill can speak – even if imperfectlyFootnote 50 – Ana’s singular language means the two individuals – of different ethnic backgrounds – have an available channel between them to communicate efficiently.
In line with the transaction cost economics literature, we contend that linguistic efficiency is important.Footnote 51 But not all languages are equal.Footnote 52 Some are demographically dominant: they are the mother tongues of the majority.Footnote 53 Others are in greater economic demand: they are the languages associated with higher wages,Footnote 54 greater trade flowsFootnote 55 or more investments.Footnote 56 Some languages are also known to have stronger legal and/or linguistic foundations.Footnote 57 And in this article, we purport that some languages are more important because they are the official language of the state.
Linguistic efficiency in the state language is important. Choosing a state language can be understandably a contentious processFootnote 58 – and it should be. The designated language is used throughout all government bodies and in all administrative matters. The paperwork to get a license to operate a food truck, to serve alcohol on premise or to drive a taxicab; the forms to fill out to get registered as a business, to patent an idea or to pay taxes; and the contract between two partners or between an employer and employees are all in the state language.
Consider the above monolingual (alpha) Ana and the bilingual (beta and alpha) Bill. If the official language were alpha, both Ana and Bill can engage fully in economic transactions with the protection of the state. For example, Ana can open a medical marijuana dispensary and hire Bill to work for her. But if the official language were delta – a language that neither Ana nor Bill speaks – this means both individuals are effectively disenfranchisedFootnote 59 – even though they can communicate in alpha. They are not able to enter contractual agreements fairly, use the judicial system meaningfully to enforce violations of the agreements or even pay their taxes accordingly. Of course, both individuals can hire translators, but the cost of doing so can be prohibitive.
This has been the case in Haiti. Although the Haitian population is linguistically homogeneous (>94 per cent) and – in the words of Lieberman and SinghFootnote 60 – ethnically non-institutionalized, the spoken language (Haitian Creole) is very distinct from the official state language (French). The latter is spoken by as little as 4 per cent of the population, yet French remains the language of government services and official forms.Footnote 61 The disparity caused from such ethnic practicesFootnote 62 was highlighted in the aftermath of the 2010 earthquake: French-speaking aid workers arrived in Port-au-Prince but could not communicate with the population at large.Footnote 63
As the Haiti example demonstrates, while communication efficiency can happen in any language, what matters more is when the efficiency is in that of the state language– that is, when there is officialization of the state language. This is evident when there are explicit costs of not knowing the state language. Consider Estonia. There, the constitution explicitly states Estonian as the country’s only official language. For the Russian minorities (25 per cent of the population), the inability to speak Estonian means they cannot engage meaningfully with the state services. And it is not just about the inconveniences of needing an Estonian–Russian interpreter or translator. It is also about being able to maintain gainful employment. In Estonia, there is a language inspection body that has the authority to appear at any workplace at any time and administer a language test to anyone. Failure to pass the test can result in job termination.Footnote 64 This happened in 2011 when the language inspection agents fired five orphanage workers in a predominantly ethnic Russian town (96 per cent) for inadequate Estonian-language skills.Footnote 65
If a country is largely homogenous and the language of the dominant ethnic group happens to also be that of the state, the government has the luxury of having a large L1 population conversant in the official language. Consider Japan, where over 99 per cent of the population claims Japanese – the official state language – as its mother tongue. But governments in countries with greater diversity face the tremendous challenge of institutionalizing an official language: language policies need to have their origins from the top down, with overt means and goals, be explicit in documentation, and be existent in both in law and practice.Footnote 66 The language must also be accessible to more than just the elites.Footnote 67
One way to institutionalize an official language is via the education system. In fact, save a few rare exceptions,Footnote 68 all governments rely heavily on their education systems to advance their language planning visions.Footnote 69 Education, after all, is the apparatus for broadcasting the government’s vision of how the state should look – including its linguistic ideology.Footnote 70 Some see language as a set of problems that need to be addressed. Others see it as a right. Still others view language as a resource.Footnote 71 This orientation can have economic implications.Footnote 72 But more generally, the link between education and economic growth is well established.Footnote 73 When individuals study and become proficient in a second language, they have (1) the necessary skills to be more productive in their work and (2) the bargaining leverage to demand higher wages.Footnote 74
In some instances, this reliance on the education system is absoluteFootnote 75 and can be authoritarian. Consider Thailand. As part of a larger state-building effort, King Chulalongkorn (1868–1910) designated central Thai (later renamed standard Thai) as the official language. Over the ensuing years, all schools (including the monastic ones) adopted the palace’s curriculum – first the teaching of central Thai and then teaching in central Thai.Footnote 76 King Chulalongkorn’s successors adopted similar policies. The promulgation of central Thai was no simple matter given the linguistic diversity. During King Chulalongkorn’s tenure, there was an assortment of languages (for example, Chinese, Khmer and Lao) and dialects (for example, central, northern, northeast and southern). To make matters even more challenging, northeastern Thai speakers were not only the largest group (33 per cent of the population) but also spoke a language that was linguistically closer to Laotian than central Thai. Today, the country remains linguistically heterogeneous (Herfindahl index: 0.740).Footnote 77 Yet by many accounts, over 90 per cent of the population claims proficiency in standard Thai.Footnote 78
Alternatively, consider Singapore – home to Chinese (74.2 per cent), Malays (13.3 per cent) and Indians (9.2 per cent). Despite having been a British colony, at independence (1965) only 21 per cent of the population claimed literacy in the English language.Footnote 79 Due to the economic conditions, coupled with other pressing concerns (for example, military development), the education system was left largely untouched until 1978. That year, the newly appointed education minister Goh Keng Swee led a team of twelve – known as the ‘Daring Dozen’ – to review the ‘innumerable’ problems with the ministry.Footnote 80 The subsequent 1979 Goh Report would prove to be the foundation of Singapore’s educational policy for the next several decades. Prior to the Goh Report, the country’s education system was mother tongue-English bilingual on paper, but in practice it was ineffective. Moreover, there was a high dropout rate, suggesting that a subset of the population did not even have the opportunity to study English. In contrast, Goh Keng Swee adopted educational policies that emphasized ‘social efficiency rather than social equity’.Footnote 81 In third grade, students were administered a largely linguistically based aptitude test, and were subsequently separated and tracked based on the results. In the sixth grade, students were administered another similar exam to readjust for student performance. And so by the time the students entered junior high, they were already placed into a specific curriculum where English was taught to maximize proficiency. The majority had English taught as a second language. There were exceptions: those with exceptional aptitude were placed in schools where English was taught as a first language, and those with special needs were assigned to schools where English learning was minimal. Today, English is the mother tongue of 40 per cent of the populationFootnote 82 and the second language of another 50 per cent.Footnote 83
When a country has a large population attending school for a substantive number of years, it produces a significant population that has been exposed to the official language as either a first (L1) or second (L2) language. So while the demographic population of people who can claim the official language as a mother tongue is largely fixed, the country can increase the conversant population – that is, speakers of the state language – through L2 numbers. When the total L1 plus L2 population is substantive, this suggests the official language cuts across the larger population. In other words, the country’s ethnic practice is not necessarily congruent with its ethnic structure.Footnote 84 What matters is not the size of L1 speakers – as argued by the likes of Easterly and Levine,Footnote 85 who focus only on native speakers – but rather the aggregate L1 and L2 population. This discussion leads us to the following hypothesis:
Hypothesis 1: Countries with a larger official language-speaking population have higher economic growth rates.
As indicated in the Philippine and Singapore cases, it is not sufficient for a government to simply adopt a mother tongue-L2 bilingual policy. The official language has to be taught for it to be official. Put differently, there must be some state capacity. It is possible that this state capacity to educate the population is the same engine driving the county’s growth – and we do discuss this concern in the empirical section. But here let us note that our objective is not to evaluate the economic impact of language vis-à-vis other state capacity measures. Instead, the purpose is to examine and compare the effects of the two purposes of language. The first is the one commonly employed in the literature: language is a marker of ethnic identity. The second is about the efficiency-enhancing function. We argue that, when taking into consideration L2 speakers of the official language, the effects of communicative efficiency are comparable to those of ethnolinguistic homogeneity. Specifically, we hypothesize:
Hypothesis 2: The economic effects of a larger official language-speaking population are no different than those of ethnolinguistic homogeneity.
RESEARCH DESIGN
Our sample is all countries 1975–2010 with irregular intervals. Note that our primary variable is not available annually but rather irregularly – once every three to five years (more below). We begin with 1975 because of data availability for L2 speakers. The unit of analysis is country-reported year. In all, we have more than 800 observations across 172 countries.
Dependent Variable: Economic Growth
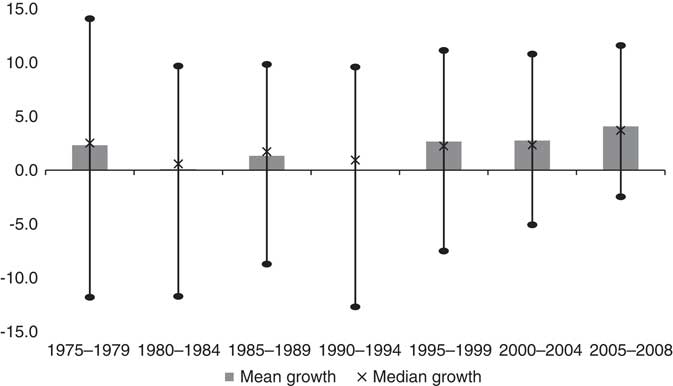
Here, we use data as reported in the Penn World Table.Footnote 86 Growth is measured as change in real GDP per capita in constant prices. The average growth rate in the entire sample is 1.61. Figure 1 shows the growth rates in five-year intervals over time.
Economic growth Note: the shaded bars represent the average growth rates for each interval. The black lines indicate the 95 per cent distribution, with the median noted.

Primary Variable: L1 + L2 Official Language
We are interested in the population that can speak the official state language. It is not necessary that individuals speak this language at home; it is sufficient that they have studied it and are proficient in it. Put differently, we want a measure that captures those who speak the language as a mother tongue (L1) and those who have learned it as a second language (L2). Mathematically, the population of L1 + L2 speakers is always at least as large as – if not greater than – the L1 population.
Defining proficiency can be a subjective endeavor. For example, the United States Department of State measures proficiency along a six-point scale ranging from no practical proficiency (0) to elementary proficiency (1: ‘able to satisfy routine travel needs and minimum courtesy requirements’) to bilingual proficiency (5: ‘equivalent to that of an educated native speaker’).Footnote 87 In contrast, the Council of Europe classifies linguistic skills into three broad user categories: basic (A), independent (B) and proficient (C).Footnote 88 To sidestep these challenges, we measure L1 + L2 official language population using data from one reliable source. Ethnologue,Footnote 89 a database developed by missionaries in 1934, is arguably today’s most comprehensive linguistic encyclopedic reference. It identifies the menu of languages spoken in each country and the number of speakers (primary and, when available, secondary) associated with each corresponding language. This gives us a direct measure of the L1 + L2 population in any language. Since missionaries need to be able to communicate in order to proselytize, Ethnologue has an interest in recording second-language speakers. For instance, if residents in a Mayan village can all speak Spanish, it makes sense for the missionaries to do their outreach in Spanish. However, if the Mayans cannot speak Spanish, Ethnologue would note the need for Biblical translations. While Biblical proficiency does not necessarily equate to proficiency in economic exchanges, it does suggest some basic ability to communicate. Since the 1934 edition, there have been sixteen subsequent editions. The most recent was published in 2013.
There are two other benefits of using Ethnologue. One is that each Ethnologue edition identifies the official language of the state. Although governments rarely change their official languages, modifications do periodically happen. For example, Luxembourgish, presently an official language of Luxembourg, was not considered one until the 1984 constitutional revision.Footnote 90 Measuring the proportion of the population that is proficient in the official language requires having first identified the relevant language for each time period. Two caveats merit further elaboration. First, some countries do not have a de jure official language, but there is always a de facto working language. For example, the United States has no language legislation at the national level. Yet in practice, English is the most commonly used language for driver’s license tests, the only language of instruction in public universities and the primary language of all the major media sources.Footnote 91 For countries that have no official language, we code for the de facto working language. The second caveat is that some countries have multiple official languages. Just because a country recognizes multiple languages does not mean its people are necessarily proficient in all of them. The Finnish Government, for instance, constitutionally recognizes both Finnish and Swedish in parliamentary debates and judicial proceedings. The two languages are also considered equal in any municipality where the local minority constitutes more than 8 per cent of the population. Yet Finnish is spoken by a much larger population than the other. In these cases of multiple official languages, we code for, first, the language of higher prestigeFootnote 92 and then for the language of the largest numerical official population.
The final advantage of Ethnologue over other sources such as Gunnemark’sFootnote 93 is that it chronicles the L1 + L2 official language population at multiple points in time (for example, 1978, 1984, 1988, 1992, 1996, 2000, 2005 and 2009). This allows us to identify not only the L1 + L2 population in any given year but also changes in the population over time. The population of L1 + L2 official language speakers is measured as a percent of a country’s total population. The variable ranges from 0 to 1, where 1 indicates the entire population is proficient. The correlation between our dynamic L1 + L2 Official Language measure and Gunnemark’s static measure of the population speaking the official language at home is 0.595.
Alternative Variable: Ethnolinguistic Heterogeneity
We seek to challenge the association between ethnolinguistic heterogeneity – as a demographic concept – and economic growth. To this end, we employ two different measures. The first is the commonly used Soviet Atlas Naradov Mira ELF index, which measures the probability of drawing two individuals who are from different ethnolinguistic groups. A larger index (maximum value of 1) suggests a more heterogeneous country. A minimum value of 0 indicates complete ethnolinguistic homogeneity. Theoretical expectations would suggest heterogeneous countries have lower levels of growth.Footnote 94
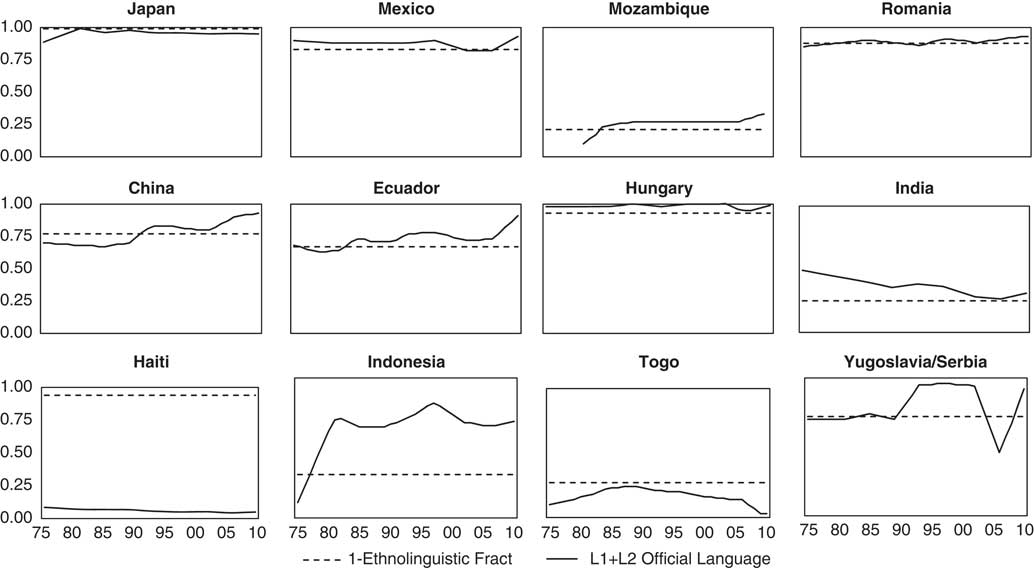
The correlation between L1 + L2 Official Language and the ELF index is −0.618. Figure 2 compares the two measures across a sample of countries. In the top row, the two measures are largely the same in each of the four countries (Japan, Mexico, Mozambique and Romania). Note that in order to compare the two measures on the same scale, we plot the inverse of the ELF index. So instead of measuring the probability of drawing two people from two different ethnolinguistic groups, we now show the likelihood that the two individuals are from the same group. Note that even with such congruence, the L1 + L2 official language measure (solid black line) exhibits much more dynamism than the ethnolinguistic fractionalization (dashed black line) measure.Footnote 95 The importance of considering second-language speakers is evident in the middle row. In each of the four countries (China, Ecuador, Hungary and India), the L1 + L2 population is generally higher than that of just the mother tongue population. Even in a country like Hungary, where 90 per cent of the population is ethnically Hungarian, the population of Hungarian speakers is even more widespread. Most of the remaining 10 per cent also know Hungarian.
Ethnolinguistic fractionalization versus L1 + L2 official language population

Finally, the bottom row highlights the need to identify the official language. In all four countries (Haiti, Indonesia, Togo and Yugoslavia/Serbia), the solid black line for the L1 + L2 official language population is drastically different from the dashed black line. Haiti, for example, is according to all demographic indicators a very homogeneous country. Yet the population of French speakers is less than 10 per cent. Alternatively, Yugoslavia’s ups and downs are due to territorial changes.
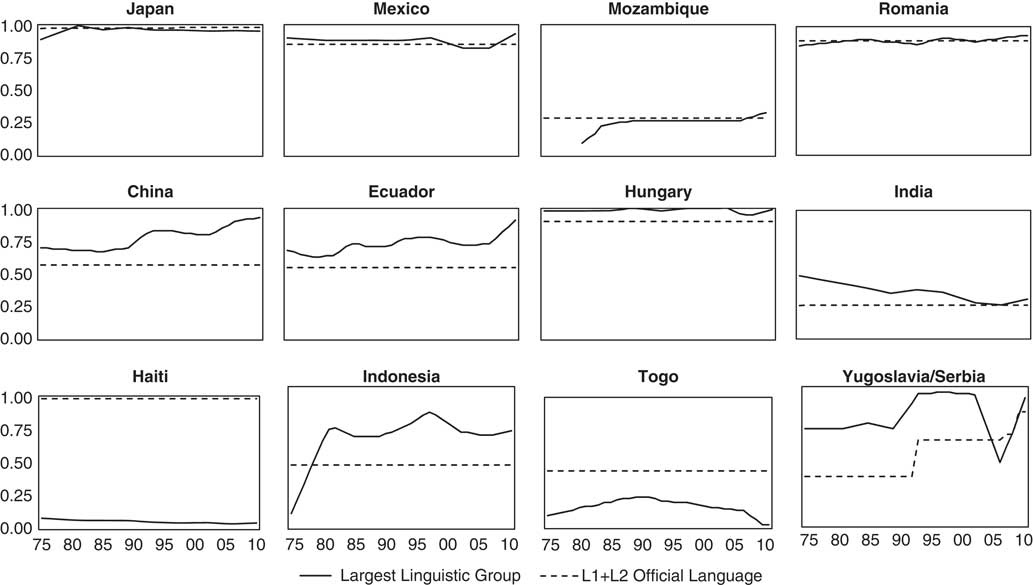
An alternative measure is the size of the largest linguistic group, as measured by the Ethnic Power Relations (ETH) database.Footnote 96 As the size of the group increases, the extent of preference congruity, the density of networks and the incentives to co-operate all increase as well. All else being equal, a country whose largest ethnic group is big has higher levels of growth than a country whose largest ethnic group is small. One advantage of the ETH measure over other demographic measuresFootnote 97 is that it is dynamic. The correlation between L1 + L2 Official Language and ETH is 0.490. Figure 3 compares the two measures across the same sample of countries as the previous figure.
Largest linguistic group size versus L1 + L2 official language population

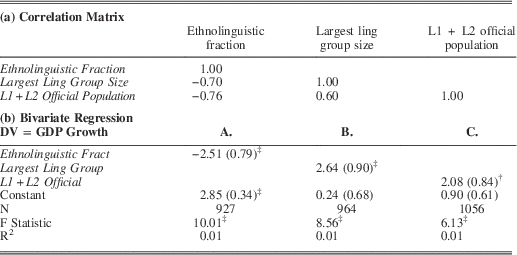
There are three important distinctions between the L1 + L2 Official Language and ETH measures. First, the largest ethnic group in the ETH database is not always linguistic in nature. Of the 733-plus politically relevant ethnic groups, there are groups that are religious (for example, Muslims in Bosnia), racial (for example, whites in the United States) or geographical (for example, Mainland Chinese in Taiwan). There are even groups that are identified by their larger national identity (for example, Uruguayans in Uruguay). In contrast, our L1 + L2 Official Language measure focuses strictly on languages. Secondly, the language of the largest ethnic group need not also be that of the state. The ETH measure focuses strictly on the population that speaks the language of the largest ethnic group; in contrast, our measure looks at the official language. Thirdly, even if the linguistic boundary of the largest group is congruent with that of the state, our measure includes second-language speakers. Table 1 shows the correlation between the three variables and the estimated coefficient of each variable in a bivariate regression.
Comparing ELF, Largest Linguistic Group, and L1 + L2 Official Population

Note: standard errors clustered by country. ‡p≤0.01
Control Variables
Regime type
Democracies are characterized by low barriers to entry and exit and low costs for participation.Footnote 98 This link between government and citizenry constrains the former to adopt policies that reflect the latter’s preferences. On the one hand, this link can be conducive to growth, because democracies invest more in human capitalFootnote 99 and are better at protecting properties.Footnote 100 On the other hand, the link between government and citizenry can also mean democratic governments are more likely to be captured by particularistic pressures.Footnote 101 This can be especially problematic if the demands are short termed and detrimental to long-term growth. To measure regime type, we employ the twenty-one-point Polity index, where a −10 (minimum) indicates complete authoritarianism and a 10 (maximum) indicates complete democracy.
GDP per capita
At the most basic, economic growth necessitates capital.Footnote 102 To this end, we also include GDP per capita to directly reflect the wealth of the average citizen and indirectly measure the market size. Wealthier countries attract more foreign investors,Footnote 103 have stronger knowledge-based economiesFootnote 104 and invest more in research and development.Footnote 105 However, poorer countries – by definition – have more room to grow. Mathematically, a $5,000 increase from a prior GDP per capita of $10,000 is much more impressive than an increase from $50,000. The GDP per capita data come from Penn World TableFootnote 106 and has been rescaled to the 10,000 unit.
State capacity
It is possible that both linguistic standardization and economic growth are driven by a strong state. If this were the case, then whatever relationship we observe between the two interested variables would be simply spurious. To address this concern, we employ two different measures of state capacity. The first is about military capacity. TillyFootnote 107 famously wrote, ‘war made the state, and the state made war’. Growth is simply not sustainable without a functioning state. To this end, we use a country’s Composite Index of National Capability (CINC) score as reported in the Correlates of War Project’s National Material Capabilities dataset. The CINC score captures a country’s total population, urban population, iron and steel production, primary energy consumption, military expenditure and military personnel as a ratio of the world’s totals in these areas. While the CINC score focuses primarily on military capacity, the components tap into the potential labor force and the available resources for economic expansion.Footnote 108
The second measure of state capacity assesses administrative capacity. Growth has been linked to strong bureaucracies that are embedded and autonomous,Footnote 109 developmental oriented,Footnote 110 and characterized by meritocratic recruitment and promotion.Footnote 111 To this end, we use data from Hendrix and Young.Footnote 112 Administrative capacity measures both (1) ‘the degree to which the country’s bureaucracy is characterized by regular, meritocratic recruitment and advancement processes; insulation from political pressure; and the ability to provide services during government changes; and (2) the strength and impartiality of the judicial system and popular observance of the law’.
Colonial legacies
Another important variable is (Western) colonial legacy.Footnote 113 Here we are interested in two specific types. The first is the British, who were more likely to have left growth-conducive institutions in their colonies.Footnote 114 British colonies also have an English-language legacy. While the British colonies were not the only ones to have these advantagesFootnote 115 – and certainly not all British colonies benefited from having them – their general presence could be confounding our effects. The other legacy of interest is the non-existent one. Countries that were never colonized did not have the practice and policies – both good and bad – imposed upon them for a prolonged period of time. It also means there is no natural Western lingua franca to designate as an official language. The expectation is that growth rates in these countries are lower than those of the British colonies. We use data coded by Hadenius and Teorell.Footnote 116
STATISTICAL EVIDENCE
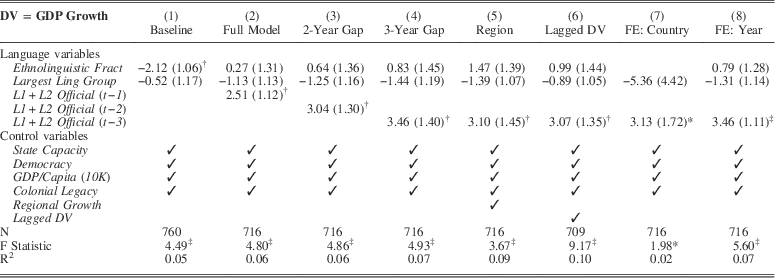
We estimate our models using GLS regression with standard errors clustered by country. The results are presented in Table 2. We begin with an empty model that looks at the effect of ethnolinguistic heterogeneity without controlling for the size of L1+L2 official language speakers. The results in Model 1 are consistent with extant research. The large negative coefficient (β=−2.12; SE=1.06) suggests heterogeneous countries have lower economic growth rates than their homogeneous counterparts. In fact, a shift in ethnolinguistic heterogeneity from the mean (0.36) to one standard deviation above the mean (0.66) can decrease growth rates from 1.67 per cent to 1.06 per cent. Interestingly, the size of the largest linguistic group has no significant effect on growth rates (β=−0.52; SE=1.17). Moreover, the coefficient is in the wrong direction.
Economic Effects of Language

Note: standard errors clustered by country. *p ≤ 0.10, †p ≤ 0.05, ‡p ≤ 0.01.
In the next three models, we include our measure of L1+L2 official language population. Because of the gap between the time of research and that of printing, Ethnologue publication years can be one to three years behind the reported date – if a date is reported at all. For example, data for Ecuador published in the 1984 edition are from 1981, and data for the same country in the 2000 edition are from 1998. To account for this lag in publication time, which also varies across countries – and to assess whether it matters – we run three models, each with a different gap between research and publication years for all countries. In Model 2, we use a measure of L1+L2 official with a one-year lag, and in Model 4 we use a measure with a three-year lag.
Here, we see the importance of our variable. When controlling for this population of interest, the previously significant effect of ethnolinguistic fractionalization drops. Largest Linguistic Group remains statistically non-significant. This pattern is consistent across all three models. Additionally, while neither heterogeneity measure is significant, the coefficient for L1+L2 Official Language is a shift from the mean (0.62) to one standard deviation above the mean (0.94), which corresponds to a substantial bump in growth rate (1.84 per cent versus 2.96 per cent).
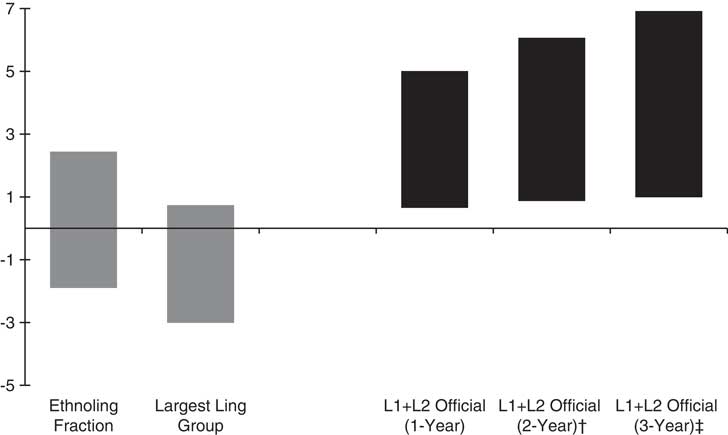
Again, this article is not strictly about the economic implications of language relative to other state capacity variables. It is not our objective to identify the one variable that singularly accounts for the largest R2. Instead, the primary purpose is to test the impact of the two functions of language – marker of ethnolinguistic identity and vehicle of communication. To this end, we see that the effect of L1 + L2 Official Language is indeed the most pronounced of all the language variables; this effect only increases as the gap between research and publication years increases (see Figure 4).
Marginal effects of language Note: marginal effects of Model 2 (one-Year Gap) unless otherwise noted; 90 per cent confidence interval. †Model 3 (two-Year Gap), and ‡Model 4 (three-Year Gap).

These results hold even when we consider spatial autocorrelation (Model 5). When considering neighboring growth rates, we find some regional effects. Eastern Europe, for example, has (1) a legacy of a state-planned economy and (2) incentives to cut deficits as a precondition for joining the European Union. Latin American economies stagnated with import substitution;Footnote 117 many also experienced presidential democracy-to-military regime changes.Footnote 118 The abundance of oilFootnote 119 in the Middle East/North Africa has incentivized monarchies to avoid modernization.Footnote 120 Similarly, the abundance of natural resources in sub-Saharan Africa, coupled with neo-patrimonial institutions,Footnote 121 has stunted development. In contrast, countries in Western Europe/North America went through the process of state building (and the Industrial Revolution) much earlier than the rest of the world. Governments in East Asia and Southeast Asia have enjoyed ‘miraculous’ levels of growth.Footnote 122
Secondly, we also recognize that growth rates in a given year can be contingent on those from the previous year. In Model 6 we include a lagged dependent variable to correct for temporal autocorrelation. The coefficient for the lag is highly significant and singularly accounts for 5 per cent of the variance in the sample. While this figure is much larger than the effect of any language variable, our objective is not to explain growth per se but to contest that the economic effects of language can manifest through efficiency. Even when controlling for the lag, we see evidence supporting our claim. The coefficient for L1 + L2 Official Language – but not for ethnolinguistic heterogeneity – is still significant and positive (β=3.07; SE=1.35).
Finally, even when running the models with fixed effects, we find the results continue to hold. Model 7 includes country fixed effects, and Model 8 includes year fixed effects. Note that with country fixed effects, the variable for ethnolinguistic fractionalization drops from the model because it is a time-invariant measure.
Among the control variables, state capacity has a consistent, significant effect. Countries with greater military capabilities – that is, those with more people, more of whom reside in urban areas and with more primary energy for consumption – have more resources to spur growth. Related, countries with strong administrative and bureaucratic infrastructure also experience higher growth. A one standard deviation from the mean for each of the two capacity measures can increase growth from half a percentage point to one whole point.
Colonial legacy matters as well, specifically one that is British. This is consistent with prior expectations: unlike most of the other continental Europeans, the British established in their colonies institutions that were more amenable to growth. Upon independence, these states inherited administrative apparatuses, economic infrastructures and education curriculums that were conducive to promoting growth.Footnote 123 Growth rates in former British European colonies are about twice those in continental European colonies. And while the coefficient for No Colonialism is not significant, its magnitude and direction suggest British colonies have the highest growth rates and that some colonial legacies have made a country’s economy worse.
Parsing out the English (and other Major Trade Languages) Effect
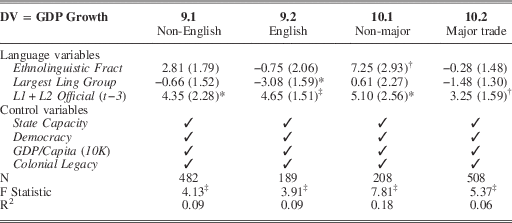
Table 2 highlights the importance of a large official language speaking population – even if the language is spoken only as a second language. There are, however, other considerations. The first is the effect of English, the global lingua franca.Footnote 124 A country that has a large English-speaking population and a high growth rate may have such economic success not because of a large official language speaking population per se but because the language is English. Having an English-proficient population means the population can access and understand scientific research – usually written in English. The country can also attract more foreign investors who want to keep transaction costs – including linguistic ones – to a minimum. To ascertain whether English is driving the noted effects, we split the sample into two subsamples. The first is a non-English speaking subsample. This includes all countries that were never colonized by an English-speaking country. The second is an English-speaking subsample: this includes those colonized by the British (for example, Singapore) or another English-speaking country such as the United States (for example, the Philippines), and those with a large native English population (for example, Australia).
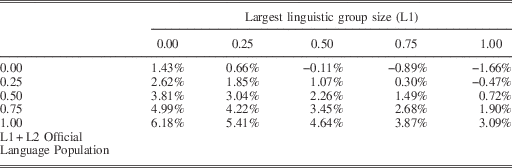
The results can be found in Table 3. It seems that the coefficient for L1 + L2 Official Language is significant in both subsamples. While the magnitude is larger in the English model, it is statistically no different from that of the non-English model. This suggests that – consistent with MelitzFootnote 125 – what matters more for economic growth is not the choice of English per se but the act of educating a large population in the official language. This is not to say the English language has no instrumental value. Note that while the coefficients for Largest Linguistic Group are not significant, they are in the negative direction in the English model. It seems that a large majority can actually be detrimental to a country’s economy when English is an available language in the government’s linguistic repertoire. English ends up being in competition with the majority language. As illustrated in Table 4, as the proportion of the linguistic group increases from the theoretically implausible 0 to a maximum of 1, growth rates correspondingly decrease from 3.81 per cent to 0.72 per cent – given that half the population speaks the official language. In contrast, we see the opposite effect as the size of the official language population increases from 0 (−0.11 per cent) to 1 (4.64 per cent).
The English (and Major Trade Languages) Effect

Note: standard errors clustered by country. *p ≤ 0.10, †p ≤ 0.05, ‡p ≤ 0.01.
Effects of Language in English-Speaking Countries

There are several scenarios to explain Table 4. The first is that English is chosen as the official language but is taught insufficiently in schools. As a result, people rely on the majority language. This leaves a large population unable to access the government – as is the case in many African countries.Footnote 126 Alternatively, English may be adequately taught in schools, but – as is the case in PakistanFootnote 127 – people prefer to speak their own language. Another scenario is that the government chooses the majority language but people prefer to learn and use English. In this scenario, there is a disconnect between the state and society. We see this in MalaysiaFootnote 128 and the Philippines.Footnote 129 A final scenario is a country such as Kenya, where the society is genuinely multilingual and the official languages are used in official communications.Footnote 130
As an alternative, we follow Selmier and OhFootnote 131 and examine the effects of not just English but all the major trade languages – that is, Arabic, English, French and Spanish. A language is considered major if it is spoken by more than 100 million people and is considered an official language in more than ten countries. Specifically, in this case, we identify countries that either have a majority of native speakers of one of the aforementioned languages or have been colonized by an English-, French- or Spanish-speaking country. Again, we split the sample into two.
The results in Model 10 are substantively consistent with those from the English model. At first glance, the coefficient in the non-major trading languages model is sizable (β=5.10; SE=2.56). Yet this effect is statistically indistinguishable from that of the major trading language model (β=3.25; SE=1.59). We therefore conclude that there are benefits to educating a large population in a common language, even if that language is neither English nor another major trade language.
Testing the Mechanism of Transaction Cost Reduction
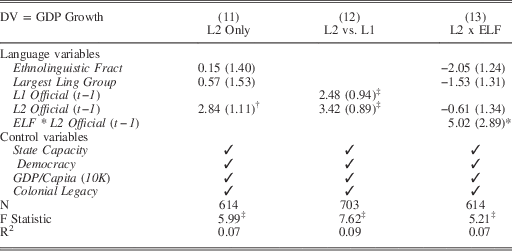
To further isolate the mechanism of transaction cost reduction, we separate the L2 speakers from the mother tongue ones. Doing so will ensure that whatever effects we observe between language and growth is not because of group preferences but because of efficiency. We begin with a model where we consider only the L2 official language speaking population. In Model 11 (see Table 5), we see the coefficient of interest is positive (β=2.84) and significant at the 0.05 level. And while this coefficient is smaller than that of L1 + L2 Official in Model 4 (β=3.46) – recall, that variable included mother tongue speakers – the difference between the two coefficients is not statistically significant.
Alternatively, we run a model that explicitly compares the effects of L1 and L2 official language speaking populations. If our argument about language-promotes-growth-via-efficiency is to have any bearing, the two coefficients should be statistically non-distinguishable. However, if efficiency is not a primary mechanism, we should either see (1) the coefficient for L1 Official significantly larger than that of L2 Official or (2) the coefficient for L2 Official simply is not significant at any meaningful level.
The results in Model 12 lend support to our claim. In fact, at first glance, the coefficient for L2 (β=3.42; SE=0.89) is larger than that of L1 (β=2.48; SE=0.94). The coefficients, however, are statistically no different. These results bode well for policy makers. Even in the most ethnically diverse environments, as long as governments can put resources into the learning of official languages – even as a second language for those who do not speak it at home – the effects can mimic a homogeneous country where everyone speaks that language.
And finally, we assess whether the size of L2 official language speakers has a moderating effect on ethnolinguistic fractionalization. A priori, we would expect a large L2 official speaking population to have a positive effect on growth. But we contend that this effect is even more pronounced in countries where ethnic diversity is high. In such settings, the presence of an official language that transects multiple mother tongues can have a sizable impact on reducing transaction costs.
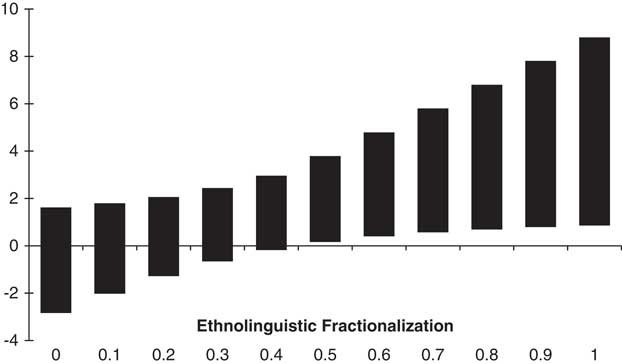
To run the model, we dichotomize the L2 official size at its sample mean, and then take the interaction between this dichotomy and the continuous Ethnolinguistic Fractionalization measure. The results in Model 13 suggest there is some moderating effect. To avoid interpreting these results as unconditional, we look at the marginal effects.Footnote 132 And indeed, Figure 5 corroborates our expectations. It seems that when countries have an ELF score of greater than 0.5 – that is, more than two equal-sized groups – they benefit substantially from having one common language spoken by all. This is the case even if the language is a second language for half the population.
Marginal effects of L2 official language population Note: 90 per cent confidence interval.

Observable Implications: Minority Presence in the Economy
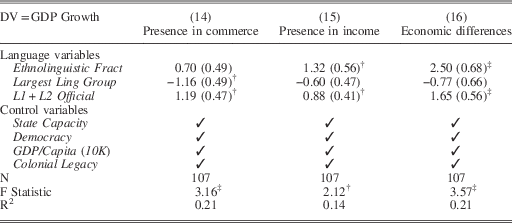
If knowing the official language (even as a second language) can reduce transaction costs, we should observe a growing presence among the non-L1 speakers in the economy over time. To this end, we use several measures from the Minority at Risk (MAR) database. The database identifies a global population of ‘at-risk’ communal groups and accordingly (among others), the nature of the economic inequality – that is, whether these groups are severely disadvantaged. For the purposes of this article, we are interested in three variables. The first looks at differences in income; another focuses on minority presence in commercial activities. In the database, both variables are scaled from −2 (significant differential in favor of the minority group) to 2 (significant differential against the minority group). A value of 1 would suggest some indeterminate differential against the minority group. The third variable is about general economic differential; it ranges from −2 (minority is economically advantaged) to 4 (extreme economic differentials between majority and minority).
Here we are not looking at whether minorities are disadvantaged per se. Instead, we are interested in whether minorities who can speak the official language have been able to reduce the gap over time. To this end, we first identify countries where the official language is not the mother tongue of an at-risk minority group. Next, we consider the population of a country’s L1 + L2 speakers in 1996 – one of the Ethnologue years and exactly one decade before the most recent years of MAR reporting on economic differential. We then construct a variable to capture changes in minority income inequality, presence in commerce and economic differential. Note that this variable has been constructed such that higher values indicate increasing equality. Finally, we examine the effects of the L1 + L2 official language speaking population on these changes.
Testing Effects of Transaction Cost

Note: standard errors clustered by country. *p ≤ 0.10, †p ≤ 0.05, ‡p ≤ 0.01.
The results in Table 6 are normatively reassuring. First, while it seems that countries dominated by one large majority group do worse in addressing the pay gap, those that are demographically diverse seem to exhibit evidence of closing the economic gap between majorities and minorities. But these positive effects can be strengthened – and the negative ones even ameliorated – by a large L1 + L2 official language speaking population. Increasing the L1 + L2 official population from 0.61 (sample mean) to 0.93 (one standard deviation above mean) translates into a general improvement from substantial to slight differentials. Here, we cannot quantify how much improvement to expect in part because the MAR measures are ordinal categories based on subjective coding. But we are nonetheless reassured by the larger patterns observed in Table 6.
Minority Presence in the Economy

Note: standard errors clustered by country. *p ≤ 0.10, †p ≤ 0.05, ‡p ≤ 0.01.
Together, the results across these different models tell an important story. Despite theoretical claims that ethnolinguistic heterogeneity impedes economic growth because of intergroup tensions, we find no evidence of this effect once we (1) shift the focus to the official language, (2) take into consideration second-language speakers and (3) examine this population over time. When people – regardless of their ethnic identities – can converse in the state language, this reduces transaction costs in economic exchanges. This efficiency – by no means an English-only story – in turn facilitates economic growth, as also evidenced by deceasing minority inequality.
DISCUSSION
This research has important policy implications for governments. Contrary to conventional wisdom, heterogeneous countries are not stuck in some sort of ‘growth tragedy’.Footnote 133 While governments in these countries may not have the easy benefits of their homogeneous counterparts, they do have instruments to mimic these effects. One such instrument is promoting the learning of the state language. When a group of people – regardless of ethnic identities – can interact in the same language, this minimizes transaction costs. Admittedly, the choice of official language is a political process.Footnote 134 But once that choice has been made, it is imperative that governments support the learning of this language in the classrooms. It also requires keeping all pupils – boys and girls – in school through secondary education. This policy recommendation is congruent with that of the World Bank: education is necessary for growth. What this article suggests is another reason why governments should prioritize education.
This article also challenges us to reconsider our understanding of ‘diversity’. First, there has been a conceptual tendency to treat language and ethnic identity as synonymous. This is problematic. While language can be an ethnic marker, it is also importantly a tool for communication. Moreover, language is additive. Individuals can speak their mother tongues and acquire proficiency in other languages over time. Not everyone who can speak a language identifies with that language. In other words, not all languages are ethnic markers. Secondly, using language as an identity measure ignores the complexity of ethnicity and its possible politicization. It is possible that ethnic tensions are manifesting along other dimensions. In other words, not all ethnic markers are languages.
The findings in this article suggest areas for future research. One of particular interest is to explain why some countries are more successful at educating the population in the official language than others. Although promoting the learning of the state language is an available instrument to produce economic outcomes akin to ethnolinguistic homogeneity, it is nonetheless a politically difficult endeavor. Whether this is a story about coalitional politics, state capacity or something else requires further examination. Another avenue is to test whether proficiency in the official language affects individual attitudes towards political institutions. When people do not know the official language, they cannot engage meaningfully with the stateFootnote 135 – and vice versa. For example, in a courtroom, if defendants cannot speak the state language, they cannot be tried by a jury of their peers even if interpreters were appointed. Such experiences can leave them to evaluate the institution negatively.Footnote 136 In contrast, if individuals can speak the official language, they have both linguistic and psychological channels through which to interact with the state. Understanding how people evaluate the state – and what the state can do to change these evaluations – are important.