I. INTRODUCTION
One-part epoxy formulations remain the most widely used adhesives in structural applications,Reference Goulding, Pizzi and Mittal1 with ease of use,Reference Webster2 good environmental stability,Reference Flick3 and adequate creep resistance.Reference Goertzen and Kessler4 The shelf life of these one-part epoxies at 25 °C is a very important parameter as far as technical application is concerned. A longer shelf life can be obtained by encapsulating the accelerator in a carrier material, which retards the influence on the epoxy matrix and increases the shelf life of one-part formulations.Reference Rätzke, Shaikh, Faupel and Noeske5 Moreover, the characteristic properties of the cured composites must not be compromised by such an encapsulation. The formulation has to combine a high T g, low curing temperature, and long shelf life. The glass transition temperature, T g is a key property of these composites when it comes to high temperature applications. The T g depends on the combination of resin, hardener, and accelerator. The properties of epoxy composites are influenced by factors at the molecular level, such as backbone structure of epoxy resin and curing agent, nature of the covalent bond developed between the epoxy resin and the curing agent during the cross-linking, and the density and the extent of cross-linking, i.e., the degree of curing.Reference Mark6
The free-volume concept is an interesting approach to study not only the uncured state of the epoxiesReference Dlubek, Pointeck, Shaikh, Hassan and Krause-Rehberg7 but also the glass transition and related properties of their cured composites.Reference Jean, Mallon and Schrader8 In a qualitative sense, free volume may be considered simply as the volume unoccupied but accessible by the molecules of the material. This unoccupied volume strongly influences the mobility of segments of polymer molecules and the permeability of the polymer to gaseous or liquid media.Reference Rudel, Kruse, Rätzke, Faupel, Yampolskii, Shantarovich and Dlubek9 The concept of free volume may be considered as rather simplistic in the light of advances in modern polymer physics, but it has the advantage of ease of visualization and, in this particular case, lends itself to quantitative analysis.
Pressure-Volume-Temperature (PVT) measurements can be used to determine the free volume where the equation of state is measured in a closed system. This has been demonstrated before using different amorphous Teflon materials. Thereby, the temperature dependence of the free volume in Teflon AF1600 and AF2400 has been investigated.Reference Dlubek, Pionteck, Rätzke, Kruse and Faupel10 Although PVT measurements give information exclusively about the total free volume and its temperature dependence, both Xe-129 nuclear magnetic resonance spectroscopyReference Suzuki and Yamada11 and positron annihilation lifetime spectroscopy (PALS)Reference Rätzke, Shaikh, Faupel and Noeske5, Reference Shantarovich, Freeman and Yampolski12–Reference Emmler, Heinrich, Fritsch, Budd, Chaukura, Ehlers, Rätzke and Faupelet14 measurements provide information about the average microscopic size of free-volume entities. A comparison on selected techniques concerning investigations on the free volume of polymers is given elsewhere.Reference Emmler, Heinrich, Fritsch, Budd, Chaukura, Ehlers, Rätzke and Faupelet14, Reference Jansen, Macchione, Tocci, De Lorenzo, Yampolskii, Sanfirova, Shantarovich, Heuchel, Hofmann and Drioli15 Over the past decade PALS has emerged as one of the entrusted tools to characterize the free volume in amorphous polymers.Reference Jean, Mallon and Schrader8, Reference Dlubek and Seidel16 The PALS method uses the positronium (Ps), a quantum mechanical particle with the mass of two electrons and the size of a hydrogen atom, as a probe to measure the size of subnanometer holes in amorphous solids or liquids.Reference Jean, Mallon and Schrader8, Reference Mogensen17 Ps is formed in molecular matter and localized at local volumes (denoted as holes). The long-lived ortho state of Ps (o-Ps) is very sensitive to the size of the hole. Its lifetime decreases from 142 ns in infinite large holes (self-annihilation in a vacuum) to the low nanosecond range in subnanometer size holes. The decrease in lifetime occurs since o-Ps may annihilate with an electron other than its bound partner, and with opposite spin, during a collision with a molecule in the hole wall (pick-off annihilation).Reference Rudel, Kruse, Rätzke, Faupel, Yampolskii, Shantarovich and Dlubek9, Reference Mogensen17 The key point is that the o-Ps lifetime mirrors the hole size at the moment of annihilation, which can also be made quantitatively [see experimental part, Eq. (4)]. The method used in the present investigation is sensitive to holes from ∼0.1 to ∼1 nm. Based on investigations on polyimides, some of us have shown a good correlation of the experimentally observed o-Ps lifetimes and the respective volume hole sizes calculated from that with the evaluation of hole sizes from corresponding computer simulations.Reference Nagel, Schmidtke, Günther-Schade, Hofmann, Fritsch, Strunskus and Faupel18–Reference Kruse, Kanzow, Rätzke, Faupel, Heuchel, Frahn and Hofmann20 However, one should note that depending on the experimental method and definition, different parts of the free volume are determined and relevant for particular properties. The o-Ps intensity is often used as a measure for the hole concentration, which is questionable, as the intensity, to a first approximation, is the product of hole concentration and Ps formation probability, where the latter is also affected by the side groups and constituents of the polymer.Reference Jean, Mallon and Schrader8, Reference Shantarovich, Freeman and Yampolski12 The PALS technique is now regularly used to identify changes of free volume in various membranes, in nanocomposites and low molecular weight substances,Reference Rudel, Kruse, Rätzke, Faupel, Yampolskii, Shantarovich and Dlubek9, Reference Lima de Mirande, Kruse, Rätzke, Fritsch, Abetz, Budd, Selbi, McKeown, Ghanem and Faupel21–Reference Dlubek, Shaikh, Rätzke, Faupel, Pionteck and Paluch23 and in epoxides.Reference Wang, Nakanishi, Jean and Sandreczki24–Reference Faupel, Kanzow, Günther-Schade, Nagel, Sperr and Kögel28
In our previous work,Reference Rätzke, Shaikh, Faupel and Noeske5 a suitable kinetic model [Johnson–Mehl–Avrami–Kolmogerov (JMAK)] was applied to predict shelf lifetime and storage stability of a prototype epoxy precursor mixture.Reference Christian29 The Avrami equation is a widely accepted model to study phase transformations in the solid state, e.g., crystallization of amorphous materials or austenite to martensite transformations. According to the Avrami equation, for solid-state transformations displaying the kinetic behavior, the fraction of transformation X is a function of time t.Reference Sperling30

where “n” is the Avrami exponent, a parameter that indicates the dimensionality of growth together with nucleation type.Reference Abetz31 The overall rate constant for transformation is denoted as ‘k’ (its value includes contributions from both nucleation and growth), which is in turn temperature dependent via an Arrhenius law. A detailed overview is given, e.g., in Ref. Reference Christian29. The Avrami equation was originally obtained by statistical geometrical considerations dealing with the problem of how a sample volume gets covered by growing objects of a certain shape. Thereby it is assumed that these start at random points, either all at once or at random times. It is the objective of the Avrami treatment to relate the Avrami exponent, n and the rate coefficient k, to the shape of the particles, their growth rate, and the time distribution of the nucleation events. The basic idea of our previous articleReference Rätzke, Shaikh, Faupel and Noeske5 was to apply this model of phase transformation to the isothermal transformation of epoxy precursors during isothermal storage below the usual curing temperature. Thus, we use the term nucleation for the initiation of the cross-linking and growth for the following reactions.
Curing of epoxies is related to macroscopic and microscopic shrinkage.Reference Somoza, Salgueiro, Goyanes, Ramos and Mondragón32 Thus, the o-Ps lifetime τ 3 is a measure for the degree of transformation X, i.e., the degree of curing. Hence, we derive from the PALS data:

where τ is the actual o-Ps lifetime and τ 0 and τ ∞ are the initial and the o-Ps lifetime of the fully cured system, respectively. Lu et al.Reference Lu, Shim and Shim33 considered in a broad sense that crystallization can be considered as a physical form of cross-linking and in some aspects the behavior of amorphous cross-linked polymers at a higher degree of curing reaction is similar to that of crystallization. Therefore, it is possible to predict the curing process using the Avrami equation. In our article,Reference Rätzke, Shaikh, Faupel and Noeske5 we could show that this model is at least a suitable approximation and gives a lower limit for the storage stability of one component epoxies, although the details of the process for polymers (differentiation between cross-linking and isothermal glass transition) were beyond the scope of our previous approach.
In the present study, PALS is used as a method to detect the changes of the free volume for revealing differences in the kinetics of the chemical vitrification of reactive epoxy–dicyandiamide (Dicy) systems during the storage at 60 °C. With this method, the influence of free accelerator or of accelerator encapsulated in micro- or nanozeolites on the reaction kinetics can be monitored by comparing an precured epoxy adhesive (EP) mixed either with free accelerator to formulate EPacc or with the same concentration of accelerator immobilized in the micro- or nanozeolite fillers (EPμ-filled, EPn-filled).34 This is helpful to study whether the precured formulations of EPacc, EPμ-filled, and EPn-filled feature different reaction kinetics at 60 °C. Such a difference was found for the same formulations at 25 °CReference Gaukler, Müller, Krüger and Possart35, Reference Gaukler, Müller, Krüger and Possart36 by infrared (IR) spectroscopy. For that reason, IR spectroscopy is used as a method to monitor the chemical epoxy conversion during the storage at 60 °C, too. The IR and PALS data are compared and discussed.
Additionally, the properties of fully cured EP, EPacc, EPμ-filled, and EPn-filled as well as EP filled with the unloaded zeolites (EPμ-zeo and EPn-zeo) are investigated by PALS. For the whole series of samples, the volume of the average hole is calculated using the model originally developed by Tao.Reference Tao37 In addition, the glass transition temperatures, T g and the temperature at which the extrapolated free volume goes to zero, T 0, and the thermal expansion coefficients of the glassy (α g) and the rubbery (α r) phases are deduced and discussed.
II. EXPERIMENTAL
A. Preparation of the epoxies
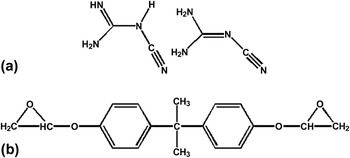
The EP consists of diglycidyl ether of bisphenol A (CAS-No. 1675-54-3; DOW, DER 332) and Dicy (Dyhard100SF, CAS-No. 461-58-5; Alzchem Trostberg GmbH, Trostberg, Germany) in the mass ratio of 100:6.7. Figure 1 gives the chemical structures. To prevent the solid Dicy particles from sedimentation, the mixture is precured at 150 °C for 1 h. This step partially dissolves the Dicy and increases viscosity due to the formation of oligomers. The corresponding IR spectroscopic oxirane conversion is 15%. This prepolymer is degassed in vacuum and homogenized (3200 min−1, 2 × 30 s) by a Speedmixer (DAC 150 FV; Hauschild Engineering, Hamm, Germany) in ambient air at 40 °C. EPacc is made of the prepolymer and the accelerator (0.5 wt%, substance not revealed for proprietary reasons) by mixing in the Speedmixer under the same conditions. Micro- and nanozeolites as host systems for the accelerator were tailored by Fraunhofer IFAM (Bremen, Germany), synthesized by NanoScape (Martinsried, Germany), and loaded with accelerator by Fraunhofer IFAM. In a similar manner, EPμ-filled and EPn-filled are obtained by dispersing the microzeolite with encapsulated accelerator (2.9 wt%, corresponding to 0.5 wt% of free accelerator) or the nanozeolite with encapsulated accelerator (2.9 wt%, corresponding to 0.5 wt% of free accelerator) in the prepolymer.
Chemical structures of (a) dicyandiamide showing tautomers and (b) diglycidyl ether of bisphenol-A.

B. IR spectroscopy
Uncured samples of EPμ-filled and EPn-filled were stored in ambient air at 60 °C. At selected times, they are characterized by a Fourier transform infrared spectrometer Bruker IFS 66v/s (Bruker, Ettlingen, Germany) in the ATR mode (attenuated total reflection; Harrick Seagull reflection unit, ZnSe hemisphere, p-polarized light, incident angle 65°, spectra information depth from 0.3 μm at 4000 cm−1 to 2.8 μm at 400 cm−1, reference spectrum: air). The influence of temporal variations of humidity is minimized by purging the customized sample compartment with dried CO2-reduced air (dew point: −70 °C, CO2 content <200 ppm). The peak height of the epoxy ring vibration at 915 cm−1 is taken as a quantitative measure of curing. That band intensity is divided by the peak height of the well-separated phenyl band at 1510 cm−1 as the internal standard:

C. Positron annihilation lifetime spectroscopy
The positron decay in amorphous polymers usually shows three decay channels, which are attributed to the annihilation of para state of Ps (p-Ps) (τ 1), free (not Ps) positrons (e+, τ2), and o-Ps (τ 3; τ 1 < τ 2 < τ 3).Reference Dlubek and Seidel16 As in amorphous polymers the holes are distributed in size, we use a well-established computer program (LT 9.0)Reference Kansy38 which takes this into account using a log-normal distribution of lifetimes for evaluating the spectra. The main point for the success of PALS in polymer physics is the fact that one of the measured quantity, the o-Ps lifetime, can be converted to an average hole size. A quantum mechanical model for the calculation of hole volume sizes has been developed by Tao.Reference Tao37 There the Ps is assumed to be confined in a sphere and a potential well with infinite wall height. Furthermore, the model postulates an electron layer at the pore wall, with which the o-Ps can interact and decay (pick-off annihilation). Calculation of the overlap integral of the Ps probability density function with this electron layer yields a direct relation between the Ps lifetime and the hole radius:

This formula includes the spin-averaged lifetime of 0.5 ns in the electron layer, the hole radius r h, and the thickness of the electron layer δ r, which has been calibrated using substances with known pore sizes.Reference Jean39 This conversion of o-Ps lifetime τ 3 to hole size is generally applied to all polymers, although the electron structure of the holes might differ from polymer to polymer or during reaction. The changes in chemistry are usually also seen in the o-Ps intensity I 3.Reference Jean, Mallon and Schrader8
All our positron annihilation lifetime experiments are performed with a conventional fast–fast coincidence setupReference Jean, Mallon and Schrader8, Reference Mogensen17 using a homemade temperature-controlled sample holder (accuracy of ±1 K), under high vacuum conditions (10−5 mbar) as described in more detail in a recent work.Reference Rudel, Kruse, Rätzke, Faupel, Yampolskii, Shantarovich and Dlubek9 The time resolution was 285 ps (full width at half maximum, 22Na source), and the analyzer channel width set to 25.3 ps. All samples were sandwiched around a ∼1 MBq positron source: 22NaCl, deposited between two 7-μm-thick Kapton foils. Each measurement lasted 2 h leading to a lifetime spectrum with the high number of ∼5 × 10⁶ counts.
For reducing the number of fitting parameters, we assumed that the short p-Ps and e+ lifetimes appear discrete (σ 1 = σ 2 = 0). The experimentally obtained spectrum is deconvoluted with the resolution function and fitted with a nonlinear least squares method to the data. Additionally, background and resolution of the machine, a sum of two Gaussian curves was taken into account. The reduced chi-squares of the fits, χ2/df, were in the acceptable range (1.0–1.1), showing the high quality of the fit.
1. Series 1, in-situ cured samples
The first series of precursors included EPacc, EPμ-filled, and EPn-filled, where the resin, hardener, and functional zeolite fillers were thoroughly mixed at room temperature (RT) and after ∼1 h of preparation were measured in the PALS apparatus. To prevent sticking of the source to the samples, each sample was held in an aluminum container of 1-mm width and 8- × 8-mm2 area with a window made of foils of 25-μm-thick Kapton. There were several isothermal scans at for different sets of samples. For each sample the first spectrum was always measured at RT followed by an isothermal run at 60 °C.
2. Series 2, ex situ fully cured samples
In a second series, samples were fully cured before the PALS analysis. The samples were cured in Au-coated aluminum pans (curing regime for EPacc, EPμ-filled, and EPn-filled: with β = 10 K/min to 170 °C, followed by isothermal curing at 170 °C for 45 min; curing regime for EP, EPμ-zeo, and EPn-zeo: with β = 10 K/min to 170 °C, followed by isothermal curing at 170 °C for 240 min) and then covered by Kapton foils with the help of double sticking Kapton tape (on the edges of the aluminum pans). Then, first PALS measurements were done at 303 K, followed by annealing at 373 K for 2 h, which was done for the in-situ conditioning of the material and subsequently cooled (∼30 min) down to RT. A complete temperature scan was then performed isothermally between 103 and 473 K in steps of 10 K.
III. RESULTS AND DISCUSSION
A. Part I: Prepolymerized series during curing (IR, PALS, and JMAK)
1. Comparison of IR and PALS
Uncured samples of EPacc, EPμ-filled, and EPn-filled were stored at 60 °C in ambient air. The decrease of the epoxy band at 915 cm−1 is monitored by IR-ATR spectroscopy at selected times. It is mainly attributed to the formation of oligoether chains via anionic ring opening initiated by the accelerator–epoxy zwitterionic adduct.Reference Ashcroft and Ellis40 Additionally, the oxirane rings can be consumed by reactions with the amine groups of dissolved Dicy and by oxirane hydroxyl reactions.
The IR spectroscopic oxirane conversion  due to storage at 60 °C are quantified by the difference of the actual oxirane band height at t storage and the initial height after prepolymerization (t storage = 0), Eq. (3):

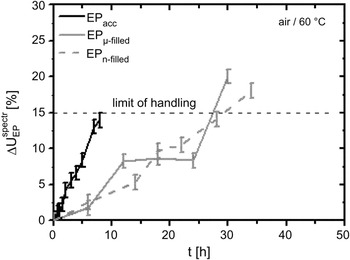
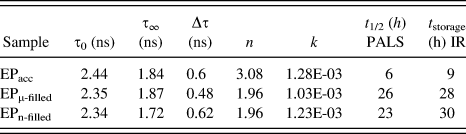
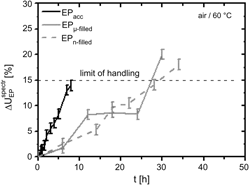
The results obtained from Eq. (5) are given in Fig. 2. The adhesive exceeds the viscosity limit for appropriate handling in the laboratory at  . Accordingly, our measure of shelf life is the period that the given adhesive needs to reach this viscosity limit. The shelf life (t storage) determined from IR measurements at 60 °C is 9 h for EPacc, 28 h for EPμ-filled, and 30 h for EPn-filled (see Table I). The different kinetics of epoxy conversion shows that the shelf life of EPacc is smaller by a factor of three at 60 °C as compared to EPμ-filled and EPn-filled. This illustrates the distinct effect of free accelerator and accelerator immobilized inside the micro- and nanozeolites. The rise of
 is the same for EPμ-filled and EPn-filled. These results indicate that the pseudobarrier of the accelerator release (cf. Ref. Reference Gaukler, Müller, Krüger and Possart35) which stabilizes EPμ-filled and EPn-filled at 25 °C, has to be overcome during the storage at 60 °C.
Infrared (IR) spectroscopy data for EPacc, EPμ-filled, and EPn-filled as a function of storage time t at 60 °C.

List of the calculated Avrami parameters and shelf life (t 1/2 from PALS and t storage for 15% of IR spectroscopic oxirane conversion) for the complete series of measurements.

PALS, positron annihilation lifetime spectroscopy; IR, infrared, EP, epoxy adhesive.
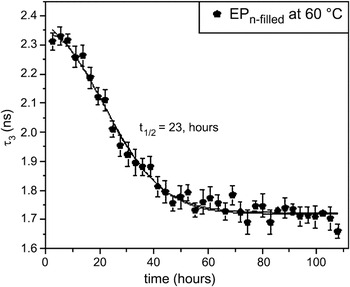
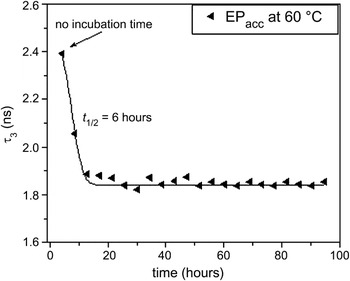
The idea of the present investigation is to compare the two methods. Figure 3 presents a typical set of isothermal PALS investigations. The plateau of the o-Ps lifetime τ 3 observed in the early stages of the low temperature investigations indicates that the mixture is still in its prepolymerized state. In the following, the o-Ps lifetime shows a sharp decrease until finally a saturation limit is reached. One should note that τ 3 is decreasing in the course of the process, reflecting a decrease in hole size, i.e., the microscopic free volume. On the other hand, macroscopic free volume change and a good correlation between the two is observed for cross-linking of epoxies.Reference Somoza, Salgueiro, Goyanes, Ramos and Mondragón32 Thus, we tentatively attribute the decrease in lifetime to the cross-linking of the system. To make the comparison of the two methods more quantitative, we define and calculate timescales for the degree of curing. For the PALS data, this is done by using the JMAK kinetics [Eqs. (1) and (2)].
The ortho-positronium (o-Ps) lifetime as function of time at 60 °C for the EPn-filled sample. There is a clear plateau for the first three data points. The decrease in lifetime after 8 h until saturation after 60 h. (Please note the measurement time for each data point is ∼2 h.)

2. JMAK fits to PALS data
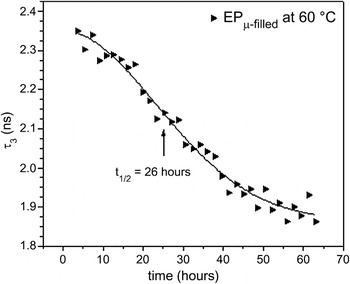
Figures 3, 4, and 5 show the JMAK fits according to Eqs. (1) and (2) to the PALS data, respectively, for the EPacc, EPμ-filled, and EPn-filled. The corresponding results are summarized in Table I, in particular t 1/2 for half of the hole size reduction due to curing.
Positron annihilation lifetime spectroscopy (PALS) data for EPacc sample measured at 60 °C.

Fit of Johnson–Mehl–Avrami–Kolmogerov (JMAK) kinetics with n = 1.96 and corresponding reaction constant to the PALS data for EPμ-filled sample.

Our JMAK fitting analyses indicate almost similar values of the reaction constant ‘k’ for all the systems. Whereas an approximate value of n = 3, which according to Ref. Reference Mandelkern41 refers to the three-dimensional linear growth for steady state homogenous nucleation, i.e., all nuclei are activated at time t = 0. Furthermore, we obtained an approximate value of n = 2 for both microencapsulated (EPμ-filled) and nanoencapsulated (EPn-filled) systems. A value of n = 2 refers to two-dimensional linear growth for steady state homogenous nucleation, with all nuclei activated at time, t = 0.Reference Mandelkern41
The values of n = 2 for the micro- and the nanoencapsulated systems indicate that the vitrification kinetics is same for these two systems and is independent of the size of module for the accelerator. However, the samples without encapsulation of the accelerator react differently.
One of the main ideas of the present investigation was the comparison of the time scales of cross-linking seen by PALS and IR. Although differently derived from the experiments (t 1/2 half of the time of change of o-Ps lifetime, t storage up to 15% spectroscopic conversion of oxirane), it is possible to at least look at the relative behavior of the two timescales with encapsulation of the accelerator in the modules. As can be seen from the last two columns, they behave similarly, which indicates that the IR spectroscopy and the free volume are sensitive to the same phenomenon, namely the chemical cross-linking and isothermal chemical glass transition of the epoxy.
B. Part II: Fully cured epoxy samples (PALS)
1. Long-term exposure to positron irradiation
A time and temperature dependence with minimum in I 3 near T g has been reported for several polymers and is generally agreed to be the result of cumulative irradiation.Reference Srithawatpong, Peng, Olson, Jamieson, Samha, McGervey, Maier, Halasa and Ishida42 The effect of long-term exposure to the positron source during positron annihilation lifetime measurements was explored by monitoring any change in the o-Ps intensity (I 3) as a function of exposure time and temperature for fully cured systems.
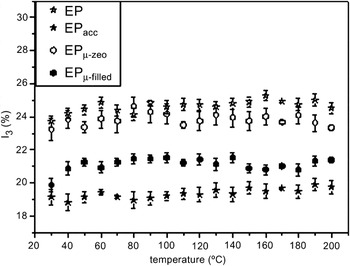
For the complete series of cured samples, the o-Ps intensity within the error bars remains more or less unchanged, which suggest no real irradiation effects. However, as shown in Fig. 6, the intensities of EP and EPμ-zeo are higher as compared to the samples with accelerator. This will be discussed in the following. For the sake of clarity the intensity data of EPn-zeo and EPn-filled systems is not shown here.
Plots of ortho-positronium intensities (I 3) for all the samples, indicating that there is no real temperature dependence but definitely the intensities of EP and EPμ-zeo are relatively higher as compared to other samples with accelerator. (EPn-zeo and EPn-filled intensities not shown here for clarity).

2. Inhibition of o-Ps
As mentioned above, we observed that for every sample where the accelerator is incorporated into the formulation, the intensity of o-Ps is lowered. We attribute this effect to the process of “positronium inhibition.” Although this interpretation eventually means that the values obtained for the fractional hole free volume f g are questionable for the scientific understanding of our results, it is very important to discuss every effect on the available data. The Dicy hardener has N-atoms in its structure and so does the accelerator used here. So Ps inhibition can occur due to higher concentration of N-atoms in the formulations with accelerator. For polyimides this is a known effect, also for polymers with other electron acceptors, even in low concentration.Reference Kruse, Rätzke, Faupel, Sterescu, Stamatialis and Wessling43 Hence, the intensity of o-Ps formation is reduced by a few percent in the accelerated epoxies as compared to the systems without accelerator (see Table II). Thus, there is an uncertainty of ∼10% in intensity and consequently in our fractional free volume data [Eq. (6), see below].
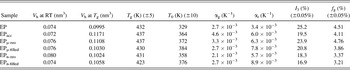
List of all the parameters evaluated with the help of PALS data for cured series.

The error bars are from statistical analysis, but please note the possible systematic error for I 3 and f g from the text.
RT, room temperature.
3. Microvolumetric glass transition temperature T g and the coefficient of thermal expansion
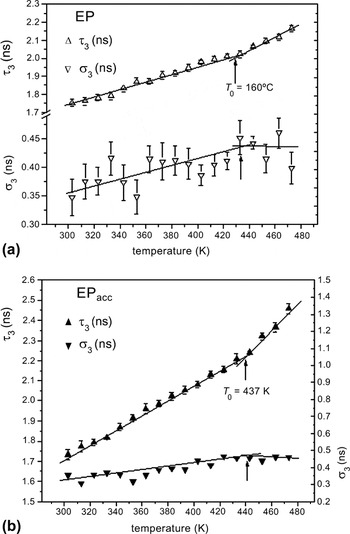
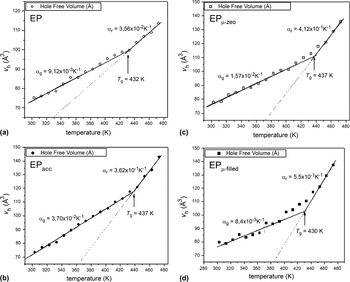
One of the aims of the present investigations was to see whether the different preparation routes and the influence of the accelerator affect the free volume and the glass transition temperature of the fully cured epoxy systems. Thus, PALS investigations have been performed in a series of samples as function of temperature after complete curing. The free volume is sensitive to the changes in temperature, thus the thermal expansion of the glassy or rubbery polymer can be explained by a change in free volume. Figures 7(a) and 7(b) show typical sets of data, the mean τ 3 ≡ <τ 3> [<τ i> = ∫τ α i(τ) dτ] and the mean dispersion σ 3 [square root of the variance σ i2 = ∫(τ − <τ i>)2α i(τ) dτ] of the o-Ps lifetime distribution α 3(τ) = α 3(λ)λ 2. The τ 3 varies between 1.8 and 2.5 ns for all samples and shows a typical glass transition behavior, with a distinct increase in its slope at T g, which is closely followed by σ 3. All data, converted to hole volume via Eq. (4) are summarized in Figs. 8(a)–8(d) for the pure epoxi and the filled ones.
The temperature dependence of o-Ps lifetime and its distribution for the two cured epoxy composites (a) without (EP) and (b) with (EPacc) accelerator are shown here.

Hole volume V h, calculated with the help of Eq. (4), assuming spherical holes. (a) EP, (b) EPacc, (c) EPμ-zeo, and (d) EPμ-filled.

From these measurements we derive several important values to characterize the different epoxy formulations. In the first column, the average hole size at RT is listed, which is roughly equal for all samples and in the usual range for epoxides (see Ref. Reference Kanzow, Zaporojtchenko, Nabika, Mizuhata, Deki and Faupel44). In the second column, the average hole size at the glass transition temperature from PALS measurements is depicted. This seems to be smallest for the pure epoxy and larger for the samples including zeolites. This is to be expected as the particles disturb the regular arrangement of the chains. However, for this discussion of V h at T g it has to be taken into account that the coefficients of thermal expansion above and below T g and the glass transition itself vary nonsystematically within the different samples (Table II). We had either expected a lower coefficient of expansion while including nanoparticles due to the restricted mobility or a much higher one due to the increase in free volume, but neither the accelerator nor particles (no matter whether micrometer or nanometer in size) show any systematic trend. Additionally, it has to be mentioned that the coefficients of thermal expansion as determined here are microscopic ones which are usually a factor of 10 higher than the corresponding macroscopic ones (see Ref. Reference Harms, Rätzke, Faupel, Schneider, Wöllner and Richter45).
Concerning the glass transition temperature determined from the o-Ps lifetime, although the variation within the samples is ∼15 K, there is no systematic trend of change in glass transition with incorporation of micro- and nanomodules. This discussion shows that the microscopic properties of the epoxy nanocomposites with respect to free volume are not affected by the accelerator or the zeolites significantly.
4. Determination of fractional hole free volume f g (at T g)
The fractional free volume (%) is expressed as an empirically fitted equation asReference Jean, Mallon and Schrader8:

where the fractional hole free volume is denoted by f g (at T g) and V h (in cubic angstrom) is the volume of holes calculated by using the spherical radius (r h) of Eq. (4) from τ 3 (in nanosecond), I 3 (in percent) is its intensity, and A is empirically determined to be 0.0018 nm−3 from the specific volume data.Reference Jean, Mallon and Schrader8 For the sake of comparison, we assume the same value here for A. The uncertainties in V h and I 3 have already been discussed (see “Inhibition of o-Ps”). All these errors should not affect relative comparison of our samples. Thus, the fractional free volume in the different epoxies is of the order of 4%. This is seemingly smaller than determined for thermoplasts by other methods,Reference Elias46 probably due to the effects discussed above.
5. Effect of cross-linking on the fractional free volume
Polymers with strong intermolecular interactions exhibit high glass transition temperatures because high energy is required to allow for segmental motions in the chains. Chemical cross-links constitute the strongest intermolecular interactions. As indicated in Table II, comparing respective systems with and without accelerators, i.e., EP (4.5%) with EPacc (4.1%), EPμ-zeo (4.8%) with EPμ-filled (3.9%), and finally EPn-zeo (3.4%) with EPn-filled (3.2%), it can be seen that for every sample where the accelerator is incorporated in the epoxy resin formulation, the o-Ps intensity (I 3) and eventually the fractional hole volume at T g is also decreased. This can be attributed to the effect of the highly reactive accelerator, resulting in higher degree of cross-linking and therefore a lower fractional hole volume as compared to the systems without accelerator. It is well known that if the cross-link density increases, then the free volume should decrease, and this consequently increases the glass transition temperature T g because the molecular mobility is more hindered.Reference Riande and Diaz-Calleja47 However, only the comparison of EP and EPacc agrees with this interpretation. The systems with encapsulated accelerators (i.e., EPμ-filled and EPn-filled) have a lower T g although they have lower values of the fractional hole free volumes. This might be an indication for a reduction in the apparent activation energy for the segmental motions due to the presence of the zeolite particles.
IV. CONCLUSIONS
We have reported an in-depth analysis for the precursor and the cured series of one-component epoxy resin formulations. The shelf life calculated as vitrification time by PALS is in good agreement with the shelf life calculated as epoxy conversion observed by the IR spectroscopy. JMAK fits to the PALS data indicate that the microencapsulated (EPμ-filled) and the nanoencapsulated (EPn-filled) systems show the same vitrification kinetics, with an Avrami exponent of approximately n = 2. Furthermore, the cured series of their epoxy composites indicate no real difference in the hole volume at RT.
ACKNOWLEDGMENTS
This research was funded by the German Federal Ministry of Education and Research (BMBF) within the project FKZ 03X0026. A complete report is available in Ref. Reference Gröppel48.