
Introduction
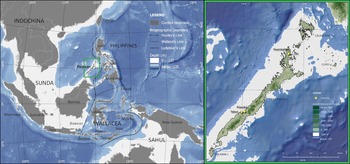
Island Southeast Asia has emerged as a key region for the investigation of hominin evolutionary trends and human adaptations to tropical environments, including rainforest ecosystems and maritime island settings (O'Connor et al. Reference O'Connor, Louys, Kealy and Samper Carro2017; Roberts & Stewart Reference Roberts and Stewart2018). Early records of modern human settlement in Southeast Asia show evidence for the occupation of tropical rainforests in Borneo and Sumatra (Barker et al. Reference Barker2017; Westaway et al. Reference Westaway2017) during Marine Isotope Stages (MIS) 3 and 4, respectively (c. 71 000–30 000 years ago). During this period, environments across the region changed dramatically, necessitating adaptation by human populations. A globally important period of change was during the Last Glacial Maximum (LGM; 30 000–19 000 years ago), when certain parts of Southeast Asia experienced increasing aridity and the expansion of open environments (e.g. Wurster et al. Reference Wurster2019). A number of archaeological sites in the Malay Peninsula and Sulawesi demonstrate abandonment in response to this increasing aridity, suggesting that some populations may have relocated to coastal areas (O'Connor & Bulbeck Reference O'Connor, Bulbeck, Cummings, Jordan and Zvelebil2014). Many of these LGM coastlines and locales across Southeast Asia, which were exposed during the sea-level lowstand, are currently submerged (Sathiamurthy & Voris Reference Sathiamurthy and Voris2006). This partially explains why regional archaeological data for the LGM are relatively scarce and less known compared with Terminal Pleistocene and Holocene sequences (O'Connor & Bulbeck Reference O'Connor, Bulbeck, Cummings, Jordan and Zvelebil2014). For this reason, a rare and well-preserved Philippine LGM record affords a valuable opportunity to investigate human responses to extensive palaeoenvironmental changes in tropical ecosystems. In this article, we examine these adaptations at the site of Pilanduk Cave, Palawan Island (Figure 1). We then synthesise the data from this site in the context of the wider Palawan subsistence record in order to analyse the cultural and adaptive plasticity that has been attributed to Late Pleistocene Homo sapiens (Roberts & Amano Reference Roberts and Amano2019). The extensive and flexible behavioural repertoire of modern humans manifests in the colonisation of various environments and habitats, including the tropical and maritime ecosystems of Island Southeast Asia. The study of these changing ecosystems provides temporal depth to the investigation of how human adaptations varied in the tropics.
Map of Southeast Asia (left) and Palawan Island (right) showing present-day land distribution, biogeographic regions, biogeographic boundaries, and the location of Pilanduk Cave and other Palawan sites mentioned in the text. The −120m isobath approximates the possible extent of landmasses during the Last Glacial Maximum, including that of the Greater Palawan landmass (© J. Ochoa and J. Villasper).
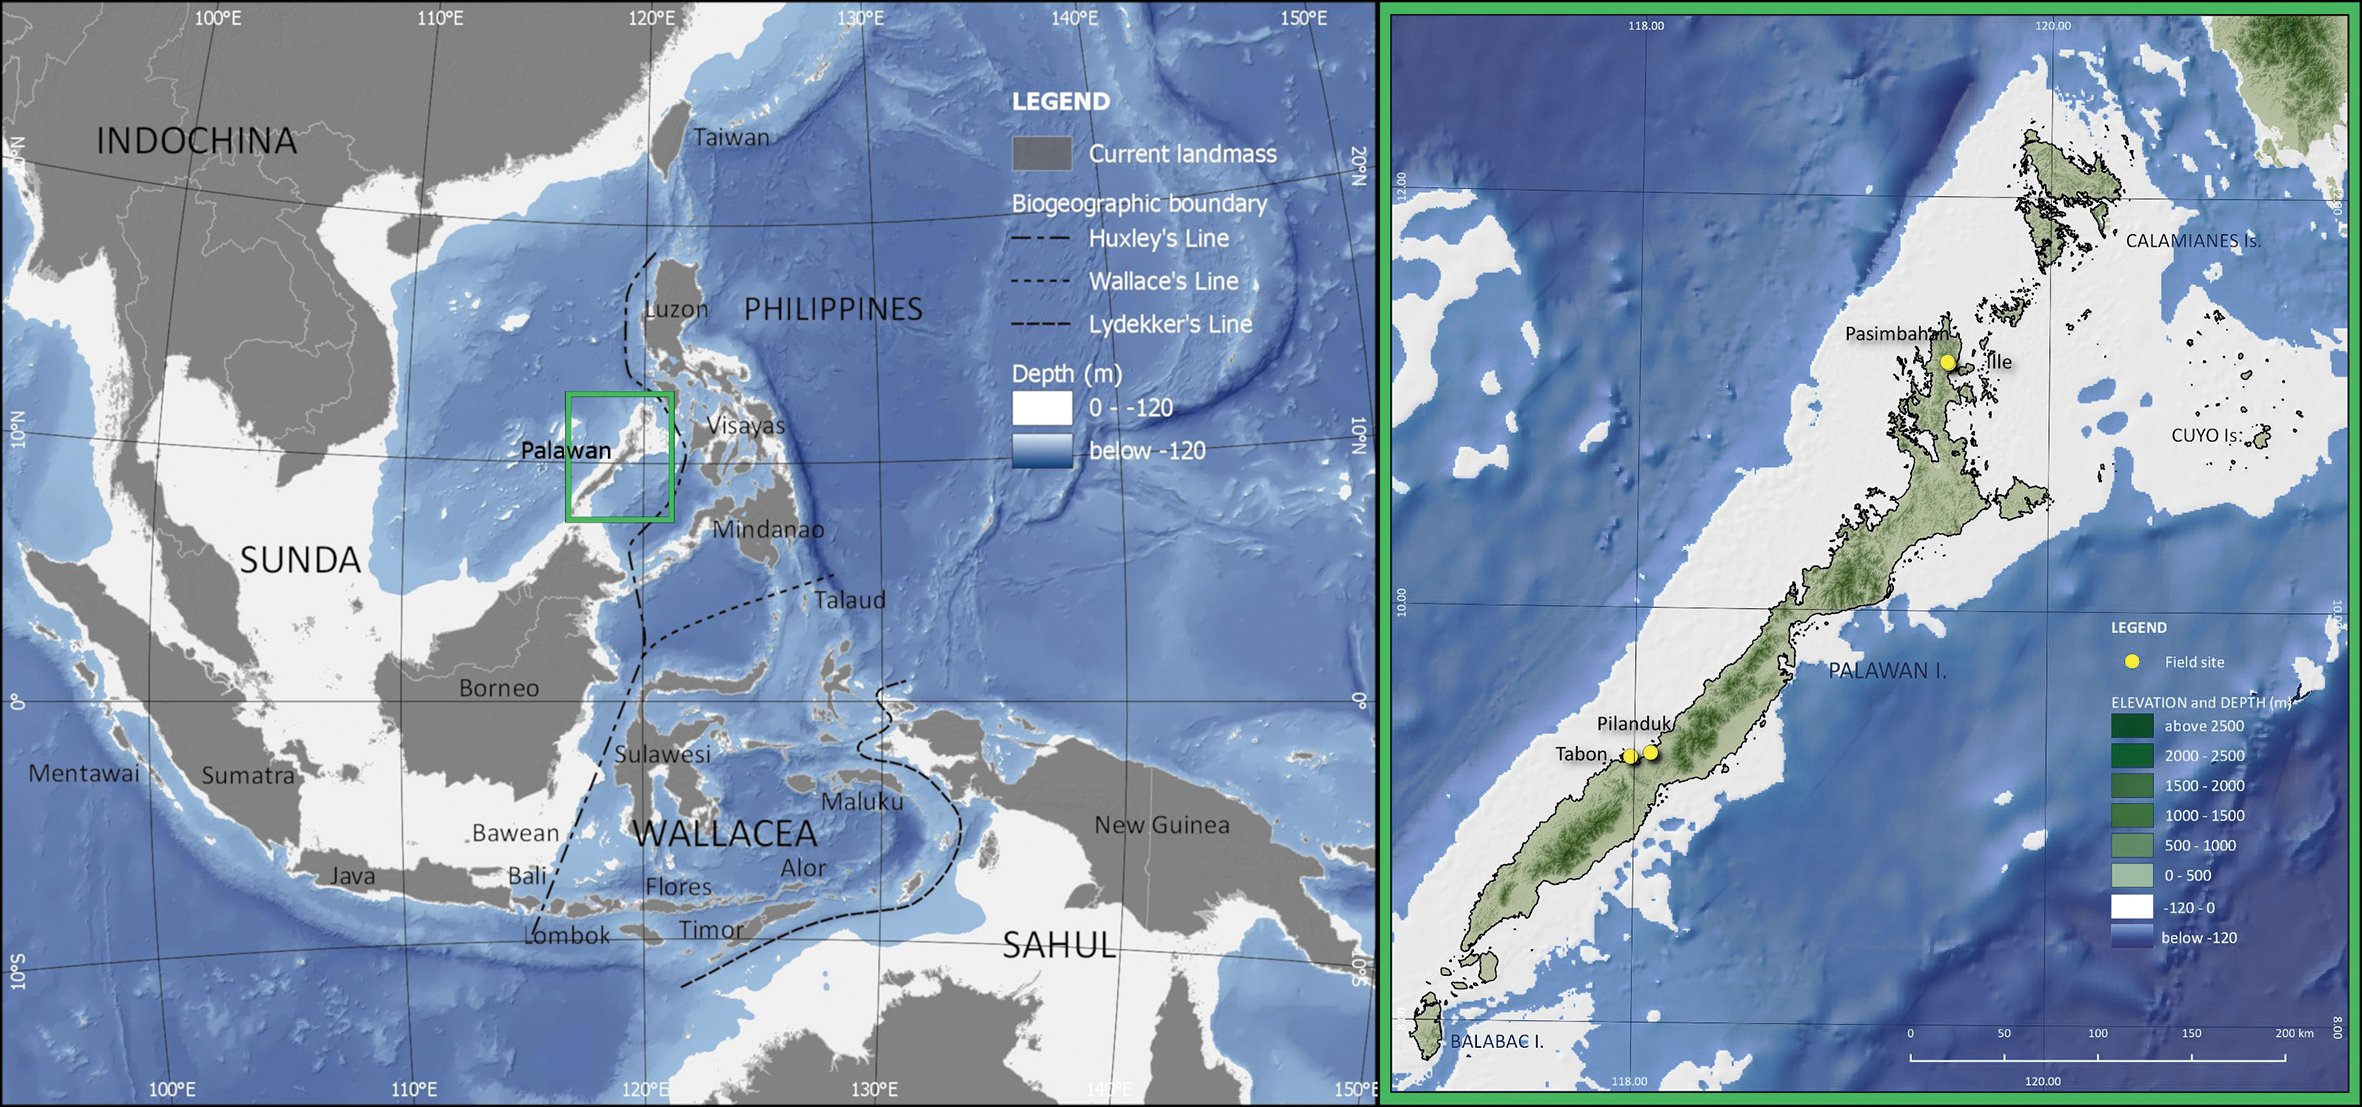
The LGM was a period of drastic climatic and environmental change across the globe (Lambeck et al. Reference Lambeck2014). In Southeast Asia, the Sunda Shelf was exposed and Sundaland reached its maximal extent during the LGM, when it is estimated that sea levels were as low as −123±2m bpsl (metres below present-day sea level; Figure 1) (Sathiamurthy & Voris Reference Sathiamurthy and Voris2006; Hanebuth et al. Reference Hanebuth, Stattegger and Bojanowski2009). With the exposure of this continental shelf, a reorganisation of oceanic currents and atmospheric systems took effect across the Indo-Pacific Warm Pool, and sea surface temperatures decreased by 2–3°C compared with the present day (De Deckker et al. Reference De Deckker, Tapper and van der Kaars2003; Gagan et al. Reference Gagan, Hendy, Haberle and Hantoro2004). A ‘savanna corridor’ hypothesis has long been proposed for central Sundaland and the western Philippines (Heaney Reference Heaney1991), which states that, during the LGM, a wide expanse of savanna extended down the Malaysian Peninsula and across the submerged landmass between Borneo and Java. LGM palaeoenvironmental data appear to support such a scenario (Bird et al. Reference Bird, Taylor and Hunt2005; Wurster et al. Reference Wurster2019), although other scholars suggest the continued persistence of closed tropical rainforests in parts of the exposed Sunda Shelf (Wang et al. Reference Wang, Sun, Wang and Stattegger2009). Other areas in Southeast Asia retained stretches of lowland tropical forests during the LGM, such as at the Niah Caves of Borneo (Barker et al. Reference Barker2017) and Trang An in northern Vietnam (Rabett et al. Reference Rabett2017).
On Palawan, palaeoenvironmental records document drier conditions during the LGM, which is bracketed by wetter and more humid conditions characterised by closed forest during MIS 3 and the Holocene. These conditions are attested by stable isotope analysis of ancient guano deposits from three caves across the island. In Tabon Cave, analysis of three Pleistocene phases of guano deposits reveals environments that were predominantly characterised by closed forest during MIS 3 (Choa Reference Choa2018). The youngest of these sequences corresponds in age with a Tabon archaeological layer dated to c. 39 000 cal BP. In Makangit Cave in northern Palawan and Gangub Cave in the south, stable isotope data signal a much drier climate and savanna conditions, dominated by C4 vegetation, during the LGM (Bird et al. Reference Bird2007; Wurster et al. Reference Wurster2010). These data also indicate that closed rainforest expanded again c. 13 500 cal BP and that, by the Early Holocene, the savanna vegetation was replaced by closed tropical forest—similar to that of the present day. Palaeogeographic reconstructions also indicate that Palawan was connected by land to adjacent, smaller islands (Balabac, Cuyo and Calamianes) during the LGM, forming the landmass known as ‘Greater Palawan’ (Figure 1). A narrow land-bridge connection with Borneo may have been possible with a sea-level drop of at least −135 m (Robles et al. Reference Robles2015); estimates by Lambeck et al. (Reference Lambeck2014) indicate a sea-level lowstand of approximately −134m at c. 21 000 cal BP.
Pilanduk Cave and Palawan Island archaeology
Palawan is the fifth largest island in the Philippine archipelago. It lies on the north-eastern tip of the Sunda Shelf, west of Huxley's Line, the biogeographic boundary demarcating Sunda from Wallacea (Figure 1). The oldest known human fossils on Palawan are from Tabon Cave and are ascribed to Homo sapiens (Fox Reference Fox1970; Détroit et al. Reference Détroit2004). Direct dating of these human remains has yielded ages ranging from 16 500±2000 to 47 000±11 000 years BP (Détroit et al. Reference Détroit2004). Additional radiometric dates obtained by Choa (Reference Choa2018) for the Tabon stratigraphy have yielded ages of c. 39 000–33 000 cal BP for what Fox (Reference Fox1970) categorised as Flake Assemblages II and III. Palawan is currently the only island in the Philippine archipelago with Pleistocene H. sapiens fossils. In northern Palawan, Ille Cave and Pasimbahan Cave have produced archaeological sequences spanning the last 14 000 years and 10 000 years, respectively (Lewis et al. Reference Lewis2008; Ochoa et al. Reference Ochoa2014).
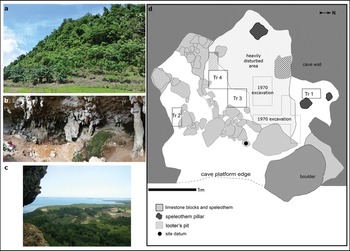
Pilanduk Cave is one of a few Philippine sites that has produced a large and well-preserved archaeological assemblage of Late Pleistocene date. The cave is located in Negmisi Peak (Magmisi or Devel Peak) at 165m asl and situated near the Iwahig River (Figure 2). Negmisi and Pilanduk are within the scope of the ancestral domain of the Indigenous Pala'wan (Certificate of Ancestral Domain Title no. RO4-QUE-O110-143) in Barangay Maasin of Quezon Municipality. The site is currently less than 1km from the coast (Figure 2c). Pilanduk is a vernacular term for the mouse-deer (Tragulus nigricans) but is also sometimes used to refer to the Calamian hog deer (Axis calamianensis). The first archaeological excavation at the cave was conducted in 1969–1970 by a team led by Jonathan Kress. Three radiocarbon dates taken from shell samples (of unreported taxon) are provided by Kress (Reference Kress2000). The deepest layer, Layer IV, is dated at 25 470±1000 BP. The younger layers, Layers II and I, date to 18 340±370 BP and 18 260±650 BP, respectively. Kress (Reference Kress1978) reports that, after the Late Pleistocene occupation, the site was rarely used again until the Late Holocene, when it was used as a jar-burial site. During its LGM occupation, the site would have been further inland—at approximately 40km from the coast—due to the MIS-2 sea-level lowstand (Robles et al. Reference Robles2015) (Figure 1).
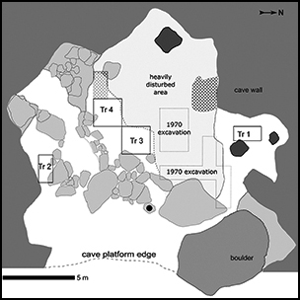
a) Negmisi Peak viewed from the east by the village road; b) Pilanduk Cave as viewed from the north-east; c) view near the peak of Negmisi, showing the present-day near-coast environment; d) plan of the 2016 excavation, showing the four trenches and reconstructed location of the 1970 trenches from Kress (Reference Kress2000) (photographs by J. Ochoa; plan drawn by M. Lara, A. Peñalosa and J. Ochoa).

The lithics, pottery and shells recovered in the 1970 excavation were described by Kress in three separate publications (Kress Reference Kress and Wood1977, Reference Kress1978, Reference Kress2000). Regarding the vertebrate assemblage, there are no published faunal counts, although Kress (Reference Kress and Wood1977) noted that deer bones dominate the Palaeolithic layers. For the mollusc assemblage, Kress (Reference Kress2000) identified 31 species, with 90 per cent being freshwater and terrestrial taxa. This pattern is taken to corroborate the inland environment of the Palaeolithic levels of the sequence. There has been a need to verify the dates reported by Kress, however, due to the limited stratigraphic data available for Pilanduk, and the limitations of the radiocarbon dating method at the time of Kress’ excavation in the 1970s, particularly as applied to molluscs.
Re-excavation and chronology of Pilanduk Cave
In order to validate the Late Pleistocene age of the site, in October 2016, a re-excavation of Pilanduk Cave was undertaken by an archaeological team composed of members from the National Museum of the Philippines, the University of the Philippines and the local Pala'wan of Barangay Maasin, Quezon Municipality. Four excavation units were opened (Trenches 1–4) (Figure 2). The online supplementary material (OSM) provides details of the excavation and zooarchaeological methods. Trench 3 reached a depth of 1.2m and provided the reconstructed stratigraphic sequence for the site (Figure 3). We identified three main archaeological layers: a Late Holocene layer and two distinct LGM midden layers. The uppermost layer (Layer 1; includes context 110 in Trench 3) contained an earthenware ceramic assemblage and human remains, which also cut into underlying Pleistocene midden deposits (context 111); in Trench 3, the matrix was partly comprised of loose, yellowish-brown silt (Figure 3). We observed this layer in all four trenches. This uppermost layer was highly disturbed and admixed, containing LGM midden deposits, Late Holocene artefacts, human remains that are of a distinctly different preservation state from that of the Late Pleistocene bones, and backfill resulting from recent looting. The Pilanduk stratigraphy is unusual in that there appears to be little sediment accumulation after the LGM occupation, with the LGM deposits visible only a few centimetres beneath the present-day surface level in the cave. The ceramic assemblage comprises at least five large ceremonial vessels, three lids and eight small vessels (Figure S1). On the basis of the associated presence of fragmented human remains, some of these vessels appear to have been used as burial jars, which were interred within the upper LGM midden accumulation. These results coincide with the earlier findings of Kress (Reference Kress1978), which showed that jar-burial remains were present in the uppermost levels of the site. A total of 126 human bone fragments were identified in the uppermost layer. These human remains clearly differ in their state of preservation from that of the animal bones from the LGM midden, with the latter being mineralised and showing varying degrees of heat alteration. Direct dates have not yet been obtained for this layer, but ceramic vessels show affinities to jar-burial assemblages found across Palawan, loosely designated as ‘Late Neolithic’ and ‘Metal Period’ (c. 2500 to 2000 BP) (Fox Reference Fox1970) (Figure S1).
Photograph (a) and drawing (b) of south wall of Trench 3, showing the three major layers, corresponding context numbers (e.g. c.110) and stratigraphic position of radiocarbon dates (cal BP). Scale in cm (© J. Ochoa).

The second archaeological layer (contexts 111, 112 and 117 in Trench 3; see Figure 3) consisted of a dense midden deposit dominated by faunal remains, found across the cave; in Trenches 3 and 4, the layer comprised a matrix of greyish-brown silt. This layer was also observed in Trenches 1 and 2. Layer 2 contained most of the archaeological material from the site, including numerous lithics and faunal remains. An initial study of the lithic artefacts shows that brown chert was the main raw material used (Table S1; Figure S2). The presence of cores, flakes and waste by-products of varying sizes in Layer 2 (Table S1) suggests that all knapping stages are represented. Extensive evidence for burning in this layer includes bone charring and calcination, and the ubiquitous presence of ash deposits and wood charcoal. These deposits potentially represent the remains of ancient hearths. Kress (Reference Kress and Wood1977, Reference Kress2000) also reported the abundance of lithic and faunal material in the LGM deposits excavated in trenches located in the centre of the cave (Figure 2d). These deposits potentially correspond to Layer 2.
The third archaeological layer (context 118) consisted of a yellowish-brown silt matrix with angular limestone fragments, and noticeably fewer ash deposits, bones and lithics compared with the overlying layer. Layer 3 was observed only in Trench 3, since this unit reached lower depths compared with the adjacent Trench 4. For Trenches 1 and 2, which are on the opposite sides of the central cave area (Figure 2d), bedrock was reached after Layer 2, and Layer 3 was not observed.
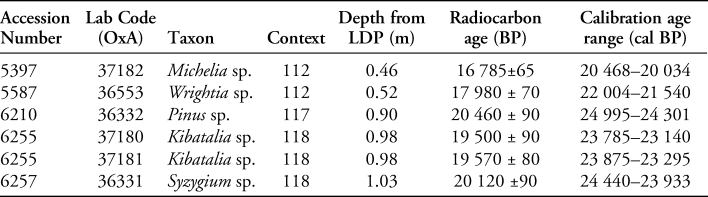
Radiocarbon dates for Layers 2 and 3 were obtained from wood charcoal (Table 1). All dating samples were hand-collected specimens recovered in situ (all dates were calibrated using OxCal v4.3.2 and the IntCal13 calibration curve (Reimer et al. Reference Reimer2013; Bronk Ramsey Reference Bronk Ramsey2017)). Two charcoal samples from context 112 (Layer 2) produced dates that range from c. 20 000 to 22 000 cal BP. Two samples from context 118 (Layer 3) produced ages within the range of c. 23 000–24 500 cal BP. A sample from the base of context 117 produced an age range of 24 995–24 301 cal BP (OxA-36332). The sedimentary composition, lithics and faunal remains of context 117 are very similar to those of contexts 112 and 111, and differ from those of context 118; the real age of the materials from context 117 could therefore be close to that of materials from context 112. The age bracket obtained for context 117, however, overlaps with a date from context 118 (OxA-36331). This suggests that the context 117 sample, which was taken at the base of this deposit, may have migrated or be derived from the underlying layer. Nonetheless, the new dates obtained from the 2016 excavation confirm the LGM dating of the site, as previously reported by Kress (Reference Kress2000).
Radiocarbon dates for Pilanduk Cave. All samples are from Trench 3 wood charcoal specimens. Ages were calibrated using OxCal v4.3 and IntCal13, and are at 95.4% probability (Reimer et al. Reference Reimer2013; Bronk Ramsey Reference Bronk Ramsey2017). LDP = local datum point.

Vertebrate assemblage
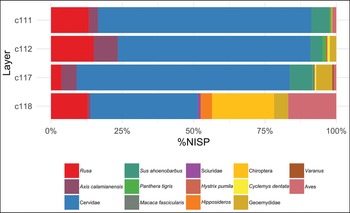
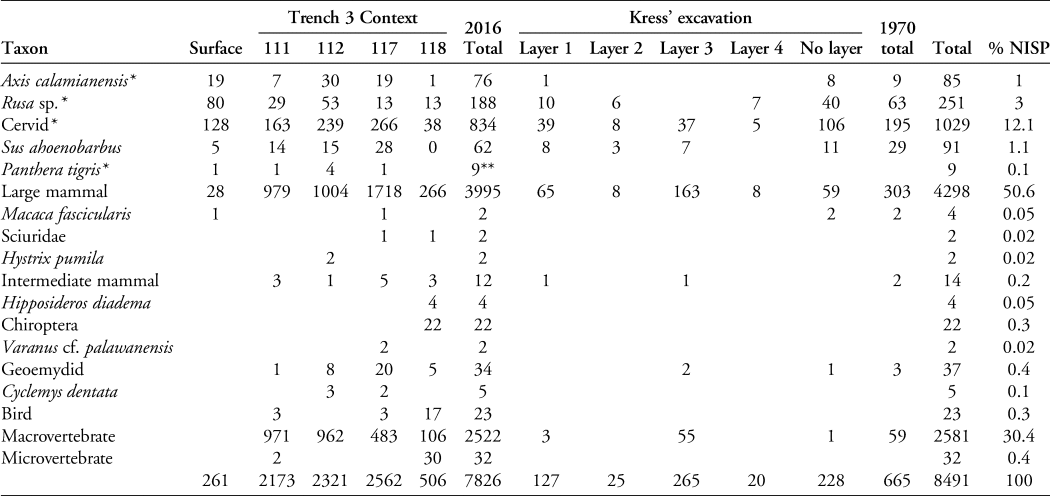
A total of 8491 terrestrial vertebrate specimens have been analysed from Pilanduk Cave, of which 7826 are from the 2016 re-excavation of the site (Table 2). The remaining 665 fragments come from reanalysis of the 1970 assemblage, although few of these fragments transpired to have sufficient stratigraphic information for temporal analysis. Analysis of the 2016 assemblage focused on the Trench 3 stratigraphic sequence, as this unit had the longest sequence of all the trenches. Seven mammalian taxa and two reptile taxa were identified (Table 2). The Pilanduk evidence currently represents the oldest known fossil records of these nine taxa. Cervid remains dominate the LGM assemblage (Figure 4). Two species are represented: a sambar-type deer (Rusa sp.) and the Calamian hog deer (Axis calamianensis). Morphometric and morphological traits of antlers, teeth and post-crania were used to distinguish the two cervid species, as reported by Ochoa (Reference Ochoa2019). The large cervid (Rusa sp.) is the more abundant of the two species. Fossil measurements for the Palawan Rusa fall at the upper end of the size range of R. marianna, whose modern conspecifics have body weights ranging from 40 to 96kg (see Ochoa & Piper Reference Ochoa, Piper and Monks2017; Ochoa Reference Ochoa2019). Axis calamianensis is a much smaller deer, with modern individuals weighing 23–40kg. The LGM faunal assemblage is dominated by long bone shaft fragments and axial skeleton specimens of large mammals; although these cannot be definitively ascribed to taxon, most specimens are in the size category of the large cervid (Rusa sp.). All other taxa occur in much smaller numbers; nonetheless, these confirm the LGM presence and support the native status of these species on Palawan. This includes rare fossil finds (n = 9) of tiger (Panthera tigris).
Relative taxonomic abundance (%NISP) of vertebrate taxa at Pilanduk Cave across four major archaeological contexts (c). NISP = number of identified specimens. NISP data are in Table 2 (© J. Ochoa).

Number of identified specimens (NISP) per context from the 2016 Pilanduk Cave excavation and per layer from Kress’ excavation in 1970.

* Locally extinct taxa.
** Two tiger specimens were from Trench 4.
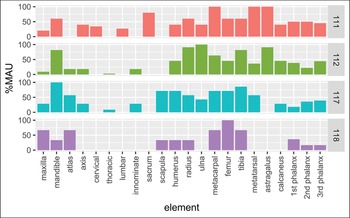
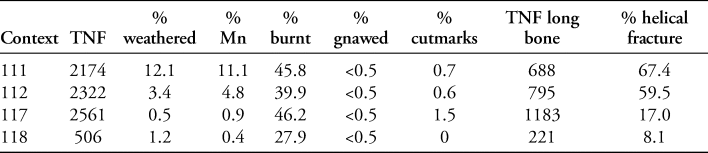
The tiger's presence may call into question the anthropogenic origin of the assemblage. Only 13 bone fragments (0.16 per cent), however, display carnivore gnawing marks. Based on various butchery and heat-induced modifications, the overall taphonomic evidence suggests that the LGM vertebrate assemblage is primarily human-derived (Table 3). Skeletal element representation in the Layer 2 midden (contexts 111, 112 and 117) indicates that all deer body parts are represented in the assemblage (Figure 5). Butchery marks observed on cervid and large mammal remains include helical fractures on long bone fragments, impact scars, cut marks and chop marks (Table 3; Figure S3). Heat alteration on bones is also observed, with a high percentage (40–46 per cent) of bones from Layer 2 displaying charring and calcination (Table 3). The taphonomic evidence suggests that whole deer carcasses were brought in, consumed and discarded by human occupants of the cave, and that the LGM occupation levels of this site were used for deer processing and consumption (Ochoa Reference Ochoa2019).
Skeletal element frequencies for deer in Pilanduk Cave, shown as %MAU (minimal animal unit) for Trench 3 archaeological contexts (© J. Ochoa).

Summary of vertebrate taphonomic data for Pilanduk Cave, expressed as percentages of total number of bone fragments (TNF) per archaeological context in Trench 3. Weathered = surface weathering; Mn = presence of manganese oxide staining; burnt = charred and calcined bones; gnawed = presence of animal gnawing; cutmarks = presence of cutmarks; TNF long bone = total number of long bone fragments; helical fracture = long bone fragments with helical fractures.

Mollusc assemblage
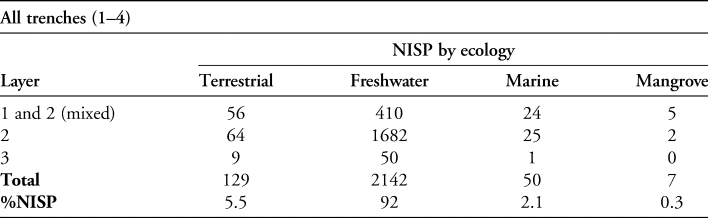
A total of 2461 shell artefacts and fragments were analysed from the four trenches of the 2016 excavation, of which 2329 (95 per cent) were identified to taxon (Tables 4 & S2). Although a few shell artefacts from the uppermost layer appear to belong to the jar-burial assemblage, most of the mollusc remains derive from the LGM midden deposits (Layers 2 and 3). A total of 24 taxa were identified (Table S2). Freshwater mollusc taxa predominate, comprising 92 per cent of the entire assemblage (Table 4). Most of the freshwater gastropods have broken tips, possibly indicating consumption. A similar pattern of species composition was reported by Kress (Reference Kress2000) and this reflects the inland riverine environment of the site used by its LGM occupants. Marine and estuarine molluscs are found in small percentages in the LGM midden, indicating the procurement and long-distance transport of these shells into the Palawan interior.
Number of identified specimens (NISP) for molluscs from the 2016 Pilanduk excavation, aggregated by habitat ecology. Uppermost layers are mixed, but most specimens are from Layer 2 midden deposits. For additional NISP data, see Tables S2 and S3 in the OSM.

Discussion
The Pilanduk Cave record shows inland foraging strategies focused primarily on deer hunting and the procurement of freshwater molluscs. The LGM occupation of the cave occurred during a period when Greater Palawan was at its maximum extent and the site was much further inland (Figure 1). To date, Pilanduk provides the only substantive subsistence record known for the LGM for the entire Philippine archipelago. This record can be contextualised within the wider Palawan archaeological context to provide an approximately 40 000-year sequence of changing environments and subsistence patterns, from the MIS-3 record of Tabon Cave (Choa Reference Choa2018) to the Terminal Pleistocene and Holocene records of Ille and Pasimbahan Caves (Lewis et al. Reference Lewis2008; Ochoa et al. Reference Ochoa2014). Across this sequence, we observe modern human occupation of the following insular environments: tropical rainforests during MIS 3 (based on the Tabon record); open savanna during MIS 2 (Pilanduk record) and the Terminal Pleistocene (Ille record); and tropical rainforests once more during the Holocene (Ille and Pasimbahan records). Environmental reconstructions for Tabon indicate the presence of closed forest at c. 39 000 cal BP (Choa Reference Choa2018), and lithic residue analysis indicates that the cave's occupants employed foraging strategies that utilised tropical rainforest plants (Xhauflair et al. Reference Xhauflair2020).
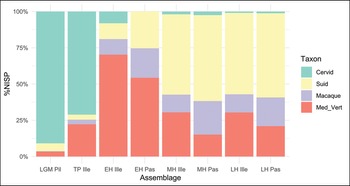
In the LGM record of Pilanduk, specialised hunting of deer is observed, and this interior lowland foraging strategy appears to have persisted until the Terminal Pleistocene c. 14 000 years ago, as evidenced by the Ille record (Figure 6). During the Holocene, notable shifts in subsistence practices are observed in the Ille and Pasimbahan records (Figure 6), wherein arboreal and other medium-sized forest game species became more abundant, utilisation of coastal and marine resources increased as a reflection of the changing landscape, wild pig replaced deer as the main large-game prey and deer became increasingly rare until their extinction (Lewis et al. Reference Lewis2008; Robles et al. Reference Robles2015; Ochoa & Piper Reference Ochoa, Piper and Monks2017). The LGM data from Pilanduk stand in contrast to this Holocene record, which exhibits a broad-spectrum subsistence regime adapted to tropical rainforest habitats in response to environmental changes during the Pleistocene–Holocene transition.
Stacked percentage plot of NISP (number of identified specimens) counts for cervids, suids, macaques and other medium-sized vertebrates (Med_Vert) in the Palawan record, aggregated by temporal period from Pilanduk (Pil), Ille and Pasimbahan (Pas) Caves. The ‘Med_Vert’ category includes terrestrial and arboreal rainforest mammal and reptile taxa. LGM = Last Glacial Maximum; TP = Terminal Pleistocene; EH = Early Holocene; MH = Middle Holocene; LH = Late Holocene. Ille and Pasimbahan faunal data are from Ochoa (Reference Ochoa2009) and Ochoa et al. (Reference Ochoa2014) (© J. Ochoa).

The savanna environment reported for Palawan during the LGM (Bird et al. Reference Bird2007; Wurster et al. Reference Wurster2010) was possibly more suitable for the three locally extinct large mammals of the island—the tiger and two deer species. In turn, Pilanduk was occupied by humans focused on hunting large game prey, particularly the Rusa deer. The last fossil occurrence for the Palawan Rusa is from the Early Holocene, while the hog deer is last recorded during the Late Holocene (Ochoa & Piper Reference Ochoa, Piper and Monks2017). The hog deer now only retains a relict distribution in the Calamianes, a small cluster of islands immediately north of Palawan (Figure 1). We do not yet have ecological information for the Palawan Rusa; however, the Calamian hog deer is known to prefer grasslands and open woodlands (Widmann & Lastica Reference Widmann and Lastica2015). At other sites across Southeast Asia, drier conditions during the LGM led to abandonment and relocation to other locales (O'Connor & Bulbeck Reference O'Connor, Bulbeck, Cummings, Jordan and Zvelebil2014); in the case of Pilanduk, the cave served as an LGM occupation site, abandoned thereafter, and reused as a jar-burial site much later, in the Late Holocene.
What stands out in the records for Palawan and Island Southeast Asia are the multiple niches that modern humans have occupied—a diverse corpus of adaptations dubbed by Roberts and Stewart (Reference Roberts and Stewart2018) as the ‘generalist specialist’ niche. This hypothesis underscores the ecological plasticity of Pleistocene H. sapiens populations, who colonised a diversity of habitats (‘generalist’) and also developed specialised adaptations to environmental extremes or to specific ecosystems (‘specialist’). Firstly, where tropical rainforests are present in Island Southeast Asia, H. sapiens appears to have utilised successfully a wide range of rainforest resources. Such broad-spectrum foraging economies are evident at lowland sites where rainforest habitats were present, from the earliest phases of modern human colonisation of the region (c. 70 000–50 000 years ago; Barker et al. Reference Barker2017; Westaway et al. Reference Westaway2017) to the Holocene, when rainforests expanded once more. Secondly, the continuous occupation of the region also necessitated adaptations to other ecological niches in the face of drastic environmental change. Where grassland/savanna environments expanded during the LGM, we observe shifts in foraging behaviour that targeted specific resources, as exemplified by the Pilanduk record. Thirdly, maritime occupation in Island Southeast Asia also required adaptation to a more limited terrestrial faunal resource base, and a reliance on coastal, estuarine and marine resources (Hawkins et al. Reference Hawkins2017; Shipton et al. Reference Shipton, O'Connor and Kealy2020). Within this context, the Palawan archaeological sequence clearly attests and lends long-term detail to the ecological plasticity attributed to modern human foragers. It also contributes to our understanding of the versatile and shifting adaptations of the foragers that have colonised the insular tropics of Southeast Asia.
Acknowledgements
We wish to thank the Indigenous Pala'wan community and Indigenous Political Structure of Maasin (Quezon), especially Panglima Eddie Seniaga Sr. and IPMR Narciso Seniaga. We thank the local government of Barangay Maasin and Quezon Municipality, headed in 2016 by Mayor Joselito Ayala and Barangay Captain Nelson Cabrestante. At the National Museum of the Philippines, we thank Jeremy Barns, Ana Maria Theresa Labrador, Mary Jane Louise Bolunia, Clyde Jago-on, Antonio Peñalosa, Gerard Palaya, Nida Radam and Larry Pronto. The 2016 excavation of Pilanduk Cave was carried out with the permission of the National Museum. We thank Jonathan Kress, whose prior research made this project possible. At the University of the Philippines and Palawan Island Palaeohistory Research Project, we thank Victor Paz, Helen Lewis, Llenel de Castro, Jeanne Ramos, Lursh Almojano and Luisa Narciso. At the University of Cambridge, we thank Graeme Barker, Preston Miracle and Jessica Rippengal. We also thank the two anonymous reviewers who helped us to improve this article.
Funding statement
We gratefully acknowledge research funding from the University of Cambridge Fieldwork Fund, the Evans Fund, the Anthony Wilkins Fund, the Wenner-Gren Foundation (Dissertation Fieldwork Grant) and Newnham College.
Supplementary information
To view supplementary material for this article, please visit https://doi.org/10.15184/aqy.2022.88.