Introduction
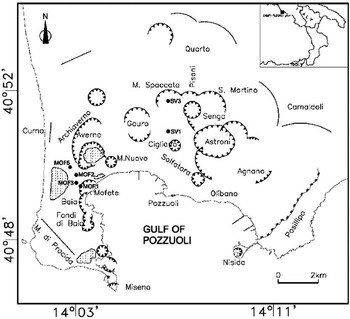
Campi Flegrei is an active volcanic area marked by a quasi-circular caldera depression, of which more than 50% has been submerged by the sea, formed by huge ignimbritic eruptionsReference Rosi and Sbrana1 (see Figure 1). The eruptive history of this area started over 200,000 years BP,Reference De Vivo, Rolandi, Gans, Calvert, Bohrson, Spera and Belkin2 and the last eruption occurred in 1538, forming an approximate 200 m cone called ‘Monte Nuovo’, literally ‘New Mountain’.Reference Dvorak and Mastrolorenzo3 The caldera has recently experienced intense deformation, which started in 1969 and (until the end of 1984) had resulted in more than 3.5 m cumulative uplift after 15 years. A maximum uplift rate of 1 m/year in the period 1982–1984 caused the temporary evacuation of 30,000 people from the centre of Pozzuoli and exposed more than 500,000 to the risk of pyroclastic flows (in fact, several million in the case of an ignimbritic eruption) (see, for example, Ref. Reference De Natale, Troise, Pingue, Mastrolorenzo, Pappalardo, Battaglia and Boschi4).
Sketch map of the Campi Flegrei caldera, located in the Naples area (Southern Italy). Also shown are the main volcanic craters and the caldera borders (continuous lines).

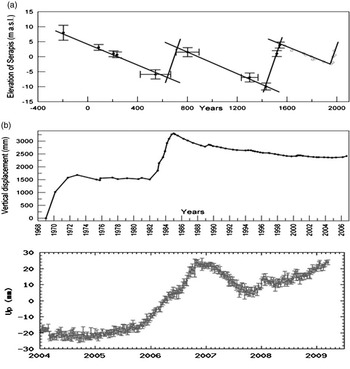
The movement of the ground in this caldera has been well known since Roman times (about 2000 years BP), since large (up to tens of metres) up and down ground movements were well recorded, as marine ingression levels, by Roman and Middle-Ages edifices located on the coastReference Dvorak and Mastrolorenzo3 (Figure 2). Recent volcanological research has pointed out the key role of complex magma-water-gas interactions in the peculiar eruptive styles and in the large up and down crustal deformations.Reference De Natale, Troise, Pingue, Mastrolorenzo, Pappalardo, Battaglia and Boschi4–Reference Lima, De Vivo, Spera, Bodnar, Milia, Nunziata, Belkin and Cannatelli6 However, several questions remain, related to the precise mechanisms of such interactions, the main magma chamber depth, the thermal state of the volcanic sub-structure and the rheological behaviour of the volcanic rocks.
(a) Sketch of vertical movement history at Macellum in Pozzuoli, known as Serapis Temple (after Ref. 15). Black circles represent the constraints found from radiocarbon and archaeological measurements by Morhange et al.;Reference Morhange, Bourcier, Laborel, Gialanella, Goiran, Crimaco and Vecchi11 white circles (post-1538) represent inference from Dvorak and Mastrolorenzo;Reference Dvorak and Mastrolorenzo3 (b) Vertical ground displacements as recorded at the benchmark in Pozzuoli harbour by levelling data in the period 1969–2006; (c) uplift data in the period 2004–present recorded at a continuous GPS close to Pozzuoli harbour.

Thus, the role of deep drilling at this area is crucial. It could give a fundamental, precise insight into the shallow substructure, the geometry and character of the geothermal systems and their role in the unrest episodes, as well as explain magma chemistry and the mechanisms of magma–water interaction. The choice of Campi Flegrei as a target for the deep study of large calderas is justified by the evidence – from previous drillings and from recent deformation and seismicity observations – that it has structures of volcanological interest that are considerably shallower than other well-studied similar calderas (i.e. Long Valley, USAReference Hill, Sorey, Ellsworth and Sass7). Besides the scientific importance of the project for volcanology, and for risk mitigation in the large city of Naples, the Campi Flegrei Deep Drilling Project (CFDDP) will also be a unique opportunity to test and apply new techniques for geothermal exploitation. The possibility to study in detail the whole aquifer system, from the shallow reservoirs to the deep ones in supercritical conditions, will be crucial in evaluating the expected geothermal potential and for considering the best ways of exploitation.
In the modern framework of economic growth, which strongly depends on the ability of countries to adopt a sustainable development with renewable energy sources, geothermal energy represents, for Italy, a formidable green energy source. It could be able, in one or two decades, to supply a considerable amount of energy both for electricity and for heating/cooling.
The intensive and rational use of a high-quality energy source, such as the geothermal one, in a country like Italy, which is characterized by intense volcanism and tectonics, is in fact the most obvious and environment-friendly choice. A choice somewhat opposed to an expensive, highly polluting and dangerous alternative such as nuclear energy – an energy source that is hardly compatible with the geologically active nature of the land. However, with the technological improvement of EGS (Enhanced Geothermal Systems), geothermal energy can become a real worldwide alternative to fossil fuels.
The Campi Flegrei and the caldera volcanism
Campi Flegrei caldera is a typical example of the most explosive volcanoes on the Earth: the large-collapse calderas. These areas include famous volcanoes such as Yellowstone (USA), Santorini (Greece), Long Valley (USA), Rabaul (Papus New Guinea), Galapagos (Ecuador). Large-collapse calderas are all formed by so-called ‘ignimbritic eruptions’, which are at the higher side of the eruption power spectrum, and so represent global catastrophes. Fortunately, being one of the most serious threats to mankind, they are very rare.Reference Rossano, Mastrolorenzo and De Natale8 As well as the extreme ‘ignimbritic eruptions’, calderas may give rise to almost all the eruptive spectrum, from quiet lava effusion to Strombolian, Vulcanian and Plinian explosive eruptions – which represent all the gradations in explosive power.Reference Rosi and Sbrana1, Reference Barberi, Cassano, La Torre and Sbrana9 However, the most typical eruptive style of almost all the calderas is the so-called ‘hydromagmatic’ one, in which rising magma from deep reservoirs intercept large shallow aquifer systems, thus generating an explosive mixture that is able to finely fragment the magma and leave the typical deposits known as ‘tuff’.Reference Sheridan and Wohletz10 The erupted mixture of fragmented magma and water impacts the ground in the form of ‘pyroclastic flows and surges’ – the most dangerous products of explosive eruptions. Their velocities are of the order of hundreds of km/h, and they are able to completely destroy any form of life where they pass due to the dynamic overpressure and high temperature (300–600°C) (see, for example, Ref. Reference Rossano, Mastrolorenzo and De Natale8).
Collapse calderas are also affected by large ground deformations, both as uplift and subsidence. At Campi Flegrei, the level of secular deformation in the last 2000 years spanned a range of more than 20 m (see Figure 2).Reference De Natale, Troise, Pingue, Mastrolorenzo, Pappalardo, Battaglia and Boschi4 Secular ground deformation is typically subsidence, at a rate of 1.5–2.0 cm/year, except for some fast uplift periods lasting some decades. A fast uplift period lasting about 40–80 years certainly preceded the only historical eruption of Mt. Nuovo, in 1538, which was a minor eruption (about 0.02 cubic km of erupted material). Another uplift period has recently been hypothesizedReference Morhange, Bourcier, Laborel, Gialanella, Goiran, Crimaco and Vecchi11 on the basis of radio-carbon dating of the time of death of some marine molluscs present on the marble columns of the Serapis Temple ruins in the Roman ‘Macellum’ (market) (Figure 2). This indicated a period of emersion of molluscs well above the sea level (ground uplift). The last uplift period started in 1969, and, except for the relative subsidence period of 1985–2004, seems still to be in progress, with variable rates (from 1 m/year in 1984 to about 1–2 cm/year today). Since the 1990s, volcanological research has pointed out that a key role in the rising and falling ground motion could be played by the complex interaction between magmatic heat and shallow geothermal systems.Reference De Natale, Troise, Pingue, Mastrolorenzo, Pappalardo, Battaglia and Boschi4, Reference De Natale, Pingue, Allard and Zollo12 What has been observed and inferred at Campi Flegrei seems to be common to all collapse calderas, so that the complex interaction between magma and aquifers is likely to be the key mechanism affecting both the peculiar eruptive style and the large deformations occurring during unrests. The main unanswered problems for understanding the volcanic mechanisms at calderas can be found in the following questions.
(1) What is the depth of the magma reservoirs and what the rheological state of residual magma from the caldera formation (i.e. liquid, solid or ‘mushy’)?
(2) What are the mechanisms of complex magma–water–gas interaction leading to ground movements, seismicity and eruptions?
(3) What are the typical precursory patterns before eruptions and how could we recognize them?
(4) How could we recognize, among the precursory patterns, the ones preceding ignimbritic eruptions, which are a real threat to mankind, and how could we protect ourselves from them?
The role of deep drilling at calderas: the CFDDP
Modern volcanological research, conducted with classical geophysical methods of ‘indirect’ inference, i.e. seismic, gravimetric, geodetic, etc, has reached its limits in the understanding of mechanisms of eruptions and unrest at calderas. Although such methods, particularly for Campi Flegrei, shed light on several aspects of this important and intriguing kind of volcanic activity, they were not able to give convincing answers to the still open questions mentioned in the previous paragraph. A decisive step forward is then only possible by direct observation of the volcanic sub-structure and of magma–water interaction mechanisms. Direct observation can only be made by deep drilling. However, given the present technological limits for crustal drilling, related mainly to the maximum depth and the thermal state, deep drilling at calderas is not an easy task, especially considering that the most interesting depths to study should be those at which the temperature reaches 500–600°C. Such depths would then encompass the limit of critical water temperature, of brittle–ductile transition, and likely penetrate the ductile carapaces, probably located some kilometres above the magma chamber, and containing the magmatic gases exsolved by it.Reference Fournier13
In view of the interrelated technological problems given by depth and temperature, the ideal case would be to drill into a very active caldera, with the most interesting volcanic structure and high temperature located at relatively shallow levels. This is exactly what Campi Flegrei represents; compare for instance the very hot temperatures found by the previous drillings of AGIP-ENEL14 with the rather low temperatures found at Long Valley (USA) calderaReference Hill, Sorey, Ellsworth and Sass7 during similar experiments. The critical water temperature has been found here in the range of 2.5–3.0 km, brittle–ductile transition should be slightly deeper, and magmatic gases – likely responsible for the recent spectacular unrest – should be located between 4 and 5 km.Reference De Natale, Troise, Pingue, Mastrolorenzo, Pappalardo, Battaglia and Boschi4 In addition, understanding in detail the volcanic hazard of Campi Flegrei caldera has enormous positive implications for society, because the area is one of the most densely populated in the Western countries, making volcanic risk here by far the highest in the world. These considerations pushed the volcanological community to identify Campi Flegrei as the ideal site for one of the most important and technologically demanding scientific experiments in geophysics and volcanology.
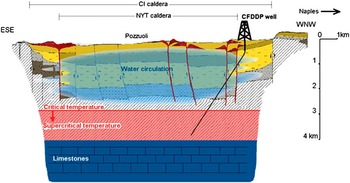
The CFDDP main goal is deep drilling, reaching a depth of about 4 km.The scheme of the deep well, with the main boundaries it should encounter, is reported in Figure 3. The well will sample, vertically, the shallowest part (500–700 m) of the structure located at the caldera borders (i.e. where the shallow structure has not been substantially altered by the collapse and subsequent filling with recent eruptive products). Below such depths, the well will be deviated, at an angle of 25°, so that it is pointing towards the centre of Gulf of Pozzuoli, which is also the centre of caldera. Along its way, the well will sample the most seismically active layers (1–3 km) and the geothermal system for its whole depth; it will cross the limit of critical temperature (2.5–3.0 km) and will approach and cross the brittle–ductile transition, ending, at about 4 km, to sample the layers, likely saturated by magmatic gases exsolved by an underlying magma chamber, embedded in the ductile layer. At the maximum depth, the drilling should encounter temperatures exceeding 500°C, and this would shed light on three key questions linked to the volcanological interpretation of Campi Flegrei and similar calderas. First, the drilling should penetrate the layer that is considered, by almost all authors (see, for example, Refs Reference De Natale, Troise, Pingue, Mastrolorenzo, Pappalardo, Battaglia and Boschi4,Reference Bellucci, Woo, Kilburn and Rolandi15–Reference Trasatti, Casu, Giunchi, Pepe, Solaro, Tagliaventi, Berardino, Manzo, Pepe, Ricciardi, Sansosti, Tizzani, Zeni and Lanari17), to be responsible for the uplift and unrest of the last 40 years. Furthermore, direct drilling could solve the important question, posed by recent active seismic soundings in the area, regarding the nature of the sharp increase in P- and S-wave velocity in the depth range 3.5–4.0 km. Judenherc and ZolloReference Judenherc and Zollo18 ascribed such high velocities to the top of a limestone layer, although Vinciguerra et al.Reference Vinciguerra, Trovato, Meredith, Benson, Troise and De Natale19 argued that such high velocities are more consistent with solidified magma (mush), which could explain the location of the large volumes of magmas (some hundreds of km3 at least) which should be still present in the shallow magma chamber after the last ignimbritic eruptions (39,000 and 15,000 years ago). More importantly, however, the deepest part of drilling, between 3 and 4 km deep, will be crucial to measure the thermal gradient below the geothermal system, i.e. at depths at which there is no convecting liquid water that can alter the typical, mostly linear, thermal gradient expected for pure conductive heat propagation. Measuring such a thermal gradient, it will be possible to linearly extrapolate it to give a precise and almost direct estimate of the depth at which rocks reach the typical magmatic temperature (about 950°C for these magmas), representing the top of the shallow magma chamber at Campi Flegrei (see Figure 4).
(A colour version of this figure is available online at www.journals.cambridge.org/erw) Sketch map of likely Campi Flegrei substructure, which will be sampled by CFDDP deep well. The reconstruction is mostly based on geophysical and geological data, affected by large uncertainties. The depth limit for critical water temperature, on the contrary, is very well constrained by previous wells in the area.14

(A colour version of this figure is available online at www.journals.cambridge.org/erw) Sketch map showing the temperature-depth functions found at the past Campi Flegrei wells in the area of San Vito,14 together with different linear gradients that can be hypothesized at depths higher than those at which temperature reaches the critical point for water. Below such depths, purely conductive geothermal gradients should be linear, so that the depth at which temperature reaches the magmatic one (about 950°C for Campi Flegrei magmas) can be extrapolated by measuring the thermal gradient below the maximum aquifer depth (i.e. below 3 km). The figure shows the depth of the magma chamber inferred from seismic tomography.Reference Zollo, Maercklin, Vassallo, Dello Iacono, Virieux and Gasparini24

Geothermal energy: a clean and accessible source for the near future
When speaking about ‘renewable’ energy, people generally think of solar and wind energy. However, the most powerful natural source of heat is the one stored in the Earth's interior. Temperatures in the Earth interior range from 4000–6000°C at the inner core, to 500–900°C at the mantle-crust boundary, located at an average depth of 30 km. However, given the actual technological limits, we can only drill to the shallowest part of the crust to access this huge heat reservoir. The maximum depth of crustal drilling reached 12.2 km in the Kola peninsula,Reference Kozlovsky20 but, in a very hot environment, we can only drill to maximum depths corresponding to limiting temperatures of 500–600°C. Geothermal energy has been widely used since ancient times, mainly for thermal uses. Geothermal energy for electricity production was first exploited in Italy, in the Larderello (Tuscany) area, in 1904. The most productive geothermal fields are those in which temperatures of 200–300°C can be reached at depths lower than 3 km, and where water and/or steam are present in large amounts. The average geothermal gradient in the shallow crust is about 30–40°C/km, but values up to 100–150°C/km can be reached in volcanic areas, whereas many areas have gradients in excess of 50°C/km. The total amount of heat stored in the shallow crust is of the order of 5.4 × 10⁹ EJ. Using 0.1% of it would satisfy the world energy consumption for 13,500 years.
In principle, therefore, geothermal heat could cover all the energy needs of mankind almost forever. In practice, there are some technological problems, mainly related to economic considerations, which limit the use of geothermal resources, and they mainly concern electric energy production. The heating and cooling of edifices can be obtained easily and efficiently in every area of the world with so-called ‘geothermal heat pumps’, requiring just 15–20°C of temperature, with or without water, and very shallow holes (generally less than 100 m); these systems preserve about 75% of the energy that would be needed with classical surface heat pumps. Geothermal temperatures of minimum value between 30°C and 80°C can be used to heat greenhouses, edifices, pools etc. Temperatures in excess of 80°C can be used to produce electricity. The systems for geothermal-electrical production can be subdivided in three large categories, which are also linked to the temperature ranges:
(1) 80°C < T < 180°C (low–average enthalpy resources): this range of temperature is appropriate for use with binary plants (Rankine or Kalina cycle), with typical power in the range 0.1–10 MWe. These systems, characterized by an overall efficiency of about 10%, are also suitable for heat co-generation, typically for heating a single edifice to small towns.
(2) 180°C–390°C (high enthalpy conventional resources): temperatures in this range can be exploited with dry steam, flash and hybrid plants, with typical power in the range 10–100 MWe. These systems, characterized by high efficiency up to more than 30%, also allow heat co-generation for large towns. Above 200°C, these resources are generally limited to volcanic areas.
(3) 390°C–600°C (supercritical unconventional resources): temperatures in this range, limited to volcanic areas, generally involve superheated dry steam plants, with power per unit volume of fluid up to one order of magnitude larger than conventional resources.
Besides the temperature range, the methods of exploitation of geothermal energy can be further subdivided in two large categories:
(a) natural hydrological systems, which use the natural aquifers;
(b) EGS (‘Enhanced’ or ‘Engineered’ Geothermal Systems), which use the high temperature of rocks with artificial water injection and, generally, with the enhancement of the permeability of the hot reservoir.
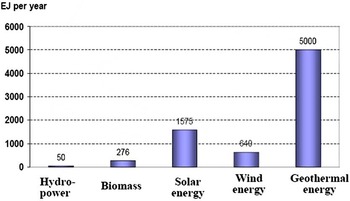
Obviously, the use of natural geothermal fluid (water and/or steam) is limited to those systems in which there is sufficient permeability and fluid flow to supply the power plants at the required power. With the use of the EGS techniques on the other hand, it is possible to use geothermal energy virtually everywhere, provided that feeding wells can be drilled that reach the depth of the required temperature. In fact, the economic feasibility of an EGS power plant is limited to those areas with a geothermal gradient higher than about 40–50°C/km. In such conditions, the maximum drilling depths to feed power plants are around 4–5 km. It is worth noting that similar geothermal gradients are rather common on the Earth, so that a large part of the Earth's crust could be geothermally exploited by EGS. It is interesting to note (Figure 5) that geothermal energy has by far the largest potential with respect to all the other renewable energy sources, with about 5000 EJ per year – three times more than solar, and an order of magnitude more than wind. A USGS report, in 2008, estimated an electrical power potential for the USA of up to 530 GW, if adequate investments into research on EGS technologies are programmed.21 In some regions of Europe, such as Italy, characterized by intense volcanism, intensive geothermal exploitation would be economically very favourable because a huge amount of energy can be extracted with well-tested technologies, in hot geothermal areas with natural hydrological systems.
(A colour version of this figure is available online at www.journals.cambridge.org/erw) Worldwide technical potential of renewable energy sources (EJ per year). Source: World Energy Assessment.25

The role of geothermal research in a sustainable society
One of the crucial problems for the next century will be to change the dependence of the world – and mainly of the most advanced countries – from fossil fuels. More generally, humankind needs to find a new relation with the environment, able to manage the implicit risks and resources of nature and to respect its equilibria in order to make sustainable the life of several billions, to tens of billions, of people. The main problem posed by the massive use of fossil fuels is, as we know, CO2 emissions, which can led to dramatic climate change in few tens of years. Another big problem is the decrease of fossil resources on the Earth due to our massive overuse. This problem could perhaps be overcome for some decades through the use of technology that could make feasible the extraction of oil and other fossil fuels from deposits that are, today, not exploitable. Coal deposits, for instance, could last much longer than oil, thus leading to the massive use of such very polluting fuels as at the beginning of the industrial era. However, the former problem, namely the greenhouse effect generated by the massive use of fossil fuels, poses a real threat to humankind, so that the most compelling challenge will be confronted in the next decades, mainly on the grounds of sustainable energy.
What are the real alternatives to fossil fuels? In principle, any kind of energy can be used, but, in practice, the most sustainable energies are not continuous, i.e. the output depends on the day/night cycle or on meteorological conditions, such as solar and wind energies. Nuclear fission energy is even more polluting than fossil fuels, not for the greenhouse effect but for the never solved (and probably not solvable) problem of scoriae and, moreover, of uranium enrichment. Furthermore, uranium deposits are even more spatially concentrated and close to exhaustion than oil. The most favourable alternative would certainly be nuclear fusion, a really clean and practically inexhaustible source, but it is still very far from being technologically viable, and will be, for several decades, in an initial experimental phase. Energy production from discontinuous sources, such as sun and wind, can be very effective for peak supply in conjunction with a constant base load, but the problem is to find alternative sources for such a constant base load. A constant energy base load could, in principle, be generated by energy stored from discontinuous sources. However, the actual technologies for energy storage are very inefficient, so that significant time and devoted research will be needed to improve energy storage in order to keep constant the energy produced by such discontinuous sources as sun and wind. It turns out that the most effective source of constant energy output, and one that is now already technological available, is geothermal energy. Despite this undeniable evidence, the use of geothermal energy is not, actually, increasing at a rate comparable with solar and wind energies. This is due to two main factors: the first is that the use of geothermal energy is technologically much more demanding and implies high and not precisely predictably risks of failure of finding economically viable resources; the second is that the EGS technology, allowing us to produce energy everywhere, still needs research to become mature and economically viable. The first problem has mainly to do with the need to drill at considerable depths, which is expensive and subject to mining risks. Furthermore, when searching for natural geothermal systems, the risk of finding low permeability and low water supply is difficult to predict exactly, and so exposes the investor to a certain degree of unpredictable risk. The most important problem for the real worldwide use of geothermal energy is, however, related to the requirement to improve the EGS technology in order to solve some poorly understood problems and make it more economically viable. This would require some investments in research, which would anyway be well worth doing because the technology is close to be mature and has been well demonstrated.
The main problems of EGS, which can be only solved by dedicated research and building more demonstrators, are the following:
(1) understanding the mechanism of permeability increase by hydraulic and thermal fracturation;
(2) understanding the time duration of the system in relation to the amount of heat extracted from hot rocks;
(3) studying the possibility of creating artificial clean water circulation in tubes installed in rocks, to avoid problems linked to permeability enhancement and/or to avoid problems linked to aggressive chemicals often present in geothermal water and/or to avoid geothermal water withdrawal;
(4) understanding the risk of earthquake generation during forced pumping for permeability enhancement and effectively mitigating and controlling the risk.
Once these problems have been thoroughly studied through detailed research and practice, the EGS technology, which is already a demonstrated, although not completely mature, technology, can effectively become the main sustainable energy source of the future. In addition to solving specific problems for EGS technology, geothermal energy will become increasingly economically viable following a considerable increase in its exploitation, and with the possible decrease of costs of geothermal drillings due to the increase of the market, and technology improvement and diffusion. It is worth noting that, with regard to natural geothermal systems, electric energy production is already among the most attractive possibilities from an economic point of view.
CFDDP and geothermal research: perspectives for Italy
A detailed study of the aquifer systems in one the hottest areas in the world will give unique opportunities for a thorough understanding of the geothermal potential, as well as of the potential problems and innovative techniques. From previous drillings in the area,14 we know that the water reaches its critical temperature in the depth interval 2.5–3.0 km, depending on the area. Going deeper, we should find supercritical fluids, which are very effective for geothermal exploitation since they become superheated steam when brought at surface, thus able to generate very high electrical powers.Reference Fridleifsson and Elders22 In active volcanic areas, supercritical fluids exsolved from the shallow magma chambers should be located in the ductile layer formed by the high temperatures surrounding the magma.Reference Fournier13 The possibility to study supercritical temperatures and the presence of supercritical fluids is only one of the crucial research opportunities offered by the CFDDP project. The exploitation of supercritical fluids for electrical energy production represents one of the most important goals for future geothermal research. In Italy, where hot volcanic areas are abundant – not only on land but also offshore in the Southern Thyrrenian sea – supercritical fluid geothermy could allow the building of extremely powerful plants, of the size of nuclear or fossil fuels ones, both on land and on offshore platforms. With the presently mature and well-tested technologies, if adequately supported by Governments, Italy could achieve geothermal electric power of up to 10% of national electric supply in the next 10–15 years. The geothermal contribution to heating and cooling could even be proportionally much larger. With adequate investments in research on EGS and supercritical technologies, geothermal sources could represent a real alternative to fossil fuels.
CFDDP's contribution to geothermal research involves several areas, which are important not only for exploitation of the volcanic systems but also for the understanding of crucial EGS topics. One of the most important goals, during the drilling of both the pilot and the deep holes, is the possibility of studying the state of stress at depth, and the microfracturing induced during controlled pumping tests. This research area, specifically planned through a large EU-VII FP Project named GEISER (Geothermal Engineering Integrating Mitigation of Induced Seismicity in Reservoirs) will shed light on one of the most crucial problems for EGS developments, namely the risk of induced seismicity during reservoir permeability enhancement.Reference Giardini23 This problem has been badly perceived by people since the occurrence of the M = 3.4 Basel earthquake, likely induced by geothermal mining, which recently stopped the mining activities at this promising geothermal site.Reference Giardini23
Conclusion
The Campi Flegrei Deep Drilling Project will represent a considerable step forward in our knowledge of the most explosive volcanism on the Earth, occurring from large collapse calderas during extreme ignimbritic eruptions. The study of such volcanism, which represents a real threat to humankind due to its potential to generate global catastrophes, will be accomplished in the area with the highest volcanic risk in the world due to its population density – Naples, in Southern Italy. The main target of the project involves drilling of a deep hole, with a deviation of about 25° from the vertical, to sample the Campi Flegrei substructure, from its border to the innermost part, in the Gulf of Pozzuoli. The well will reach about 4 km of depth, where expected temperatures should be in the range 500–600°C. Such a combination of depth and temperature has never been achieved in volcano drilling; in fact it has only been planned in Iceland, into that country's peculiar ridge volcanoes which, in many aspects, are very different from the alkali-trachitic volcanism of Campi Flegrei and from other calderas. The challenging technological aspects of this project will be afforded with an innovative, recently realized rig, namely the InnovaRig from GFZ (Germany). Temperature measurements and analysis of deep samples will shed light on the structure and eruptive mechanisms of one of the most known and risky supervolcanoes in the world. One of the main targets of the project will be the direct analysis of the geothermal system, along its whole depth. It will be crucial for the reconstruction of the peculiar eruptive mechanisms of collapse calderas, dominated as they are by complex magma–water interaction, which is responsible for the typically large unrest episodes that are not directly followed by eruptions. The detailed study of the geothermal system of this caldera will also be a unique opportunity to investigate the best strategies and technologies for geothermal exploitation, in one of the ‘hottest’ areas of the world, characterized by geothermal gradients of up to 150°C/km. Understanding the best approaches to the geothermal exploitation of this peculiar area will also hopefully provide a new impetus to geothermal exploration and exploitation in Italy, a country characterized by intense volcanism and tectonics. Here, geothermal energy production – confined for a century only in a small area of Tuscany (Larderello-Amiata) – could really become a valid sustainable alternative to fossil fuels. As well as in Italy, together with Iceland, characterized as they are by very abundant energy resources from natural geothermal sources, geothermal energy could become the leading source of sustainable energy in Europe and all over the world, especially following the improvement of the EGS technology. EGS technology, in fact, allows the use of geothermal energy for heat and electricity production virtually everywhere, and has a potential much larger than any other sustainable energy source. The CFDDP can become a leading project for studying both natural geothermal techniques, including the most powerful ones using supercritical fluids, and several arrangements for the EGS techniques. These include the exploitation of high temperature rocks with closed circuits (tubing) for water circulation and very high temperature EGS fed by both water and CO2.
Campi Flegrei caldera, for more than 2000 years a cradle of civilization, is going to become, in the framework of the CFDDP, a large open air laboratory to study and experimentally investigate new ways to manage natural resources and risks, in order to potentially solve some of the most crucial problems for our future civilized societies.
Giuseppe De Natale, Physicist, PhD in Solid Earth Physics (University Paris 7), is Research Director at INGV-Osservatorio Vesuviano, Naples, Italy. He leads the Research Unit of Volcano Dynamics and Geothermics, and is Coordinator of the Campi Flegrei Deep Drilling Project. His research interests include seismology, geodesy, volcanology and geothermal analyses. He is the author of about 150 papers in peer-reviewed leading scientific journals and of several books and special issues in Geophysics and Volcanology, he is also coordinating Italian and European Projects and Technological Platforms in Geothermics. He has been a member of Academia Europaea since 2005.
Claudia Troise, Physicist, PhD in Solid Earth Physics (University of Naples), is Senior Researcher at INGV-Osservatorio Vesuviano, Naples, Italy. She is in charge of the Laboratories of Volcano Physics and Geothermal Exploration of the Naples Department, and is co-Coordinator of the Campi Flegrei Deep Drilling Project. She also leads some Geothermal Projects of the Institute, funded by public agencies and private companies. Her research interests include seismology, geodesy, volcanology and geothermal exploration. She is author of about 60 papers in peer-reviewed leading scientific journals and of several books and special issues on geophysics and volcanology.