INTRODUCTION
During the last glacial period, roughly 120–10 ka, high-amplitude, relatively short-duration climatic oscillations are evident in Greenland ice-core records (Johnsen et al., Reference Johnsen, Clausen, Dansgaard, Fuhrer, Gundestrup, Hammer and Iversen1992; Dansgaard et al., Reference Dansgaard, Johnsen, Clausen, Dahl-Jensen, Gundestrup, Hammer and Hvidberg1993; Andersen et al., Reference Andersen, Azuma, Barnola, Bigler, Biscaye, Caillon and Chappellaz2004). These so-called Dansgaard-Oeschger (DO) events were rapid, decadal-scale transitions from cold conditions (Greenland stadials, GS) to warm conditions (Greenland interstadials, GI), followed by a slow return to cold stadial conditions, within an interval of centuries to millennia (Wolff et al., Reference Wolff, Chappellaz, Blunier, Rasmussen and Svensson2010). In addition to Greenland ice cores, DO cycles have been observed in numerous geological archives in the Northern Hemisphere, including terrestrial and marine sediments (Wang et al., Reference Wang, Cheng, Edwards, An, Wu, Shen and Dorale2001; Voelker, Reference Voelker2002; Deplazes et al., Reference Deplazes, Lückge, Peterson, Timmermann, Hamann, Hughen and Röhl2013; Rousseau et al., Reference Rousseau, Svensson, Bigler, Sima, Steffensen and Boers2017).
The character of DO events in Chinese cave deposits differs from, and is more complex than, paleoclimatic records from northern, high latitudes. An annually laminated stalagmite record from northern China resembles the Greenland NGRIP (the North Greenland Ice Core Project) ice-core record in terms of the timing and duration of the abrupt transitions into DO 15.2 and 14 (Duan et al., Reference Duan, Cheng, Tan and Edwards2016). The onset of DO 12, however, is extended in stalagmite records from two caves in southwestern China, lasting from one to several millennia (Cai et al., Reference Cai, An, Cheng, Edwards, Kelly, Liu and Wang2006; Han et al., Reference Han, Li, Cheng, Edwards, Shen, Li and Huang2016). These regional differences may result from somewhat different forcing mechanisms. In northern China, monsoon climates are dominated by temperature changes in high, northern latitudes mediated via the westerlies (Duan et al., Reference Duan, Cheng, Tan and Edwards2016). Climates in southwestern China, however, are controlled by cross-equatorial airflows and temperature changes in the Southern Hemisphere (Cai et al., Reference Cai, An, Cheng, Edwards, Kelly, Liu and Wang2006; An et al., Reference An, Wu, Li, Sun, Liu, Zhou and Cai2015). In addition, statistical analysis of a single paleoclimatic record from Hulu Cave in eastern China showed that both Northern and Southern Hemisphere climates affected the pattern of monsoonal DO events, with different ratios of southern and northern climate signals evident (Rohling et al., Reference Rohling, Liu, Roberts, Stanford, Rasmussen, Langen and Siddall2009). Indeed, paleoclimatic records from caves have been regarded as correlating either with temperature changes in Greenland (Wang et al., Reference Wang, Cheng, Edwards, An, Wu, Shen and Dorale2001, Reference Wang, Cheng, Edwards, Kong, Shao, Chen and Wu2008; Burns et al., Reference Burns, Fleitmann, Matter, Kramers and Al-Subbary2003; Zhao et al., Reference Zhao, Wang, Edwards, Cheng and Liu2010; Deplazes et al., Reference Deplazes, Lückge, Peterson, Timmermann, Hamann, Hughen and Röhl2013) or in Antarctica (Cai et al., Reference Cai, An, Cheng, Edwards, Kelly, Liu and Wang2006; Chen et al., Reference Chen, Wang, Hai, Edwards, Wang, Kong and Liu2016; Han et al., Reference Han, Li, Cheng, Edwards, Shen, Li and Huang2016) on the millennial scale. Thus, further analysis of speleothem records from Hulu Cave can potentially provide insights into the regional nature of DO signals, since the site was likely influenced in part by moisture from the Indian monsoon subsystem during the last ice age (Pausata et al., Reference Pausata, Battisti, Nisancioglu and Bitz2011). In addition, due to the sparsity of high-resolution speleothem records, little evidence is available to conduct a detailed analysis of monsoon climates on the centennial scale during Marine Oxygen Isotope Stage (MIS) 3.
Whereas the broad anti-correlation between rainfall somewhere in the monsoon system and speleothem δ18O from Chinese caves is generally accepted, the specifics are controversial. Several studies have interpreted such records as resulting from differential Rayleigh fractionation of water vapor between tropical moisture sources and cave sites and/or changes in the seasonal duration or intensity of monsoon rainfall (perhaps related to the seasonal position of the subtropical jet), a set of processes often referred to as “monsoon intensity” (Wang et al., Reference Wang, Cheng, Edwards, An, Wu, Shen and Dorale2001; Cai et al., Reference Cai, An, Cheng, Edwards, Kelly, Liu and Wang2006, Reference Cai, Tan, Cheng, An, Edwards, Kelly and Kong2010; Kelly et al., Reference Kelly, Edwards, Cheng, Yuan, Cai, Zhang and Lin2006; Duan et al., Reference Duan, Wu, Wang, Edwards, Cheng, Kong and Zhang2015; Orland et al., Reference Orland, Edwards, Cheng, Kozdon, Cross and Valley2015; Tan et al., Reference Tan, Cai, An, Cheng, Shen, Gao and Edwards2017, Reference Tan, Cai, Cheng, Edwards, Gao, Xu and Zhang2018). The extent to which these processes correlate with rainfall amount has been confirmed in some localities through independent quantitative lake-level records of past rainfall variability (Zhang et al., Reference Zhang, Jia, Lai, Long and Yang2011; Goldsmith et al., Reference Goldsmith, Broecker, Xu, Polissar, Demenocal, Porat and Lan2017). A study of the 10Be record of Chinese loess deposits, a proxy of summer monsoon rainfall, suggested that orbital-scale monsoonal changes were also forced by differences in the proportions of moisture from Indian and East Asian monsoon sources (Beck et al., Reference Beck, Zhou, Li, Wu, White, Xian and Kong2018). This argument is consistent with some climate model simulations and interpretations based upon atmospheric reanalysis data (Maher, Reference Maher2008; Dayem et al., Reference Dayem, Molnar, Battisti and Roe2010; Wu et al., Reference Wu, Zhang, Li, Li and Huang2015). In the present study, we developed a new strategy for determining how the proportions of water vapor derived from remote and nearby sources affect speleothem δ18O records from China.
Proxies such as δ13C and trace element content of speleothems are effective indicators of palaeohydrological conditions under appropriate circumstances (Fairchild and Treble, Reference Fairchild and Treble2009 and references therein). However, compared to δ18O records, they have been underutilized in paleoenvironmental studies of speleothems in China. Nevertheless, in a specific cave environment, δ13C and trace elements can be applied as hydrological tracers at a local scale (Genty et al., Reference Genty, Blamart, Ouahdi, Gilmour, Baker, Jouzel and Van-Exter2003; Sinclair et al., Reference Sinclair, Banner, Taylor, Partin, Jenson, Mylroie and Goddard2012; Huang et al., Reference Huang, Wang, Cheng, Edwards, Shen, Liu and Shao2016; Zhao et al., Reference Zhao, Wang, Edwards, Cheng, Liu, Kong and Ning2016; Wang et al., Reference Wang, Wang, Shao, Liang, Zhang and Kong2018). Moreover, a relationship between δ13C and trace element ratios in speleothems has been observed; for example, owing to the impact of prior calcite precipitation (PCP) and CO2 degassing under low-flow conditions, metal/Ca ratios and δ13C are elevated in dripwater and hence in stalagmites (Treble et al., Reference Treble, Shelley and Chappell2003; Johnson et al., Reference Johnson, Hu, Belshaw and Henderson2006; Fairchild and Treble, Reference Fairchild and Treble2009; Stoll et al., Reference Stoll, Müller and Prieto2012; Chen and Li, Reference Chen and Li2018). Trace element enrichment can also be associated with warm and humid climatic conditions due to enhanced chemical weathering, and thus it reflects local hydrological dynamics (Borsato et al., Reference Borsato, Frisia, Fairchild, Somogyi and Susini2007; Zhou et al., Reference Zhou, Chi, Michael, Zhao, Yan, Alan and Feng2008). Hellstrom and McCulloch (Reference Hellstrom and McCulloch2000) showed that concentrations of Sr and Ba in speleothems were positively correlated with changes in the overlying vegetation cover, which confirms the effectiveness of carbon isotopes and trace elements for reconstructing local environmental changes. A recent study of a 3000-yr annually laminated stalagmite from Hulu Cave demonstrated the covariation of records of δ18O and Sr/Ca ratio on centennial to multi-decadal scales, which enabled the authors to interpret the δ18O record in terms of the monsoonal rainfall (Duan et al., Reference Duan, Wu, Wang, Edwards, Cheng, Kong and Zhang2015).
In this context, we conducted a multi-proxy study of a new 230Th/U-dated stalagmite from Hulu Cave (HL161), spanning the interval of 51.7–42.6 ka (relative to the present, defined as AD 1950). The δ18O record has an average resolution of ~10 yr, which enables us to identify fine-scale monsoonal variations during DO cycles 14–11. Our study has three aims: (1) to determine the timing and structure of the monsoonal response to DO events; (2) to reconstruct local hydrological processes; and (3) to provide a better understanding of the origin of speleothem δ18O records from caves in China.
SITE, MATERIALS AND METHODS
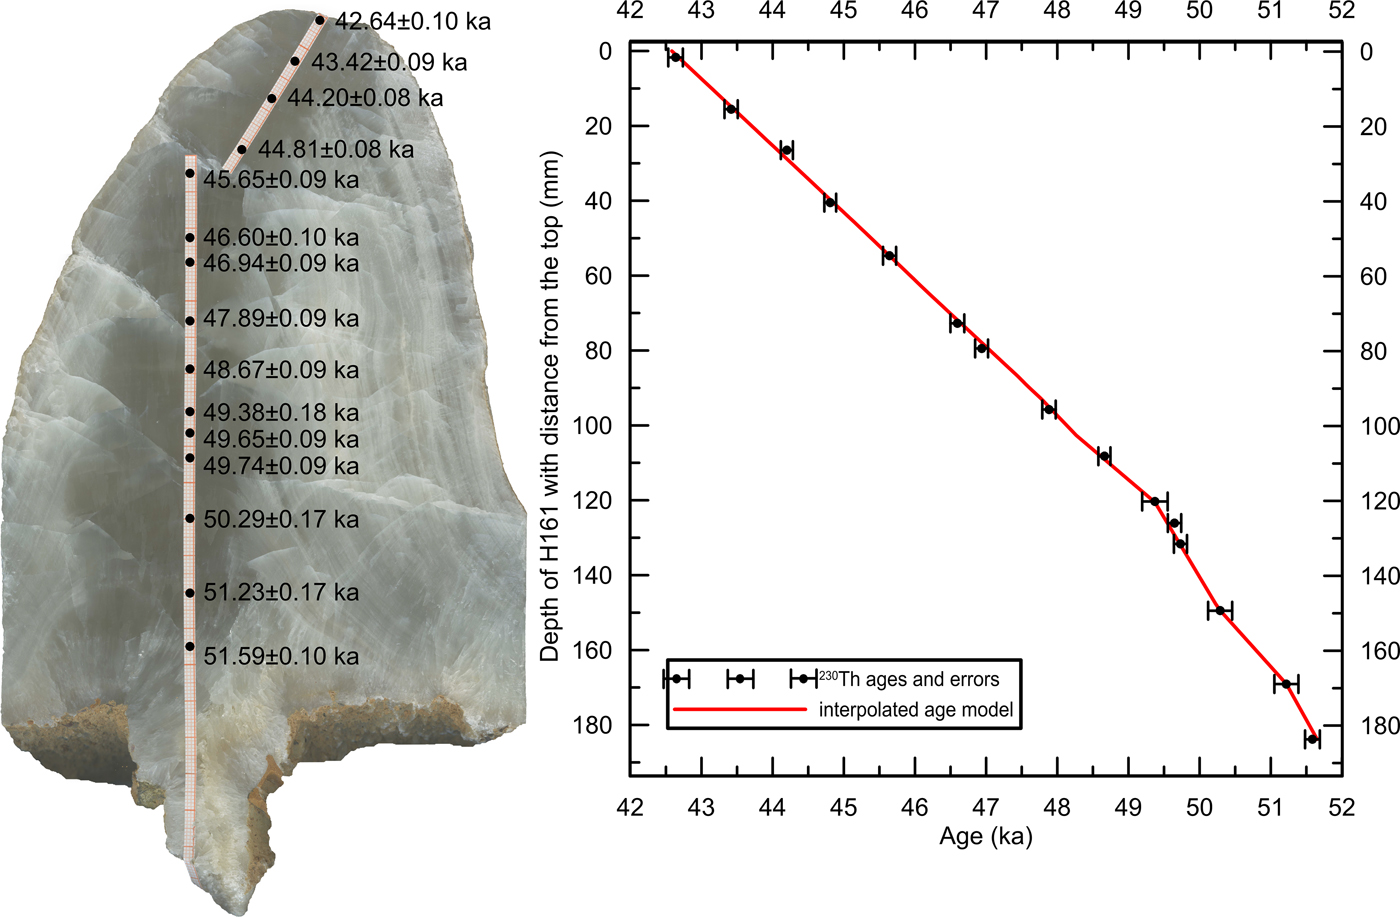
Stalagmite sample HL161 was found in a naturally detached state on the northern slope in Hulu Cave, Nanjing, in eastern China (32°30′N, 119°10′E, 86 m above sea level). A detailed site description is given in Wang et al. (Reference Wang, Cheng, Edwards, An, Wu, Shen and Dorale2001) and Duan et al. (Reference Duan, Wu, Wang, Edwards, Cheng, Kong and Zhang2015). The stalagmite, which has a length of 243 mm and an asymmetric shape, was sliced along its growth axis and polished; no depositional hiatuses are evident (Fig. 1).
(Color online) Chronology of stalagmite HL161. (a) Scanned image and location of fifteen 230Th samples. (b) The linearly-interpolated age model, including error bars for 230Th ages.

For 230Th/U dating, 15 subsamples of up to 100 mg were extracted using a 0.9-mm-diameter carbide dental drill. The procedures used for U/Th chemical separation and isotopic measurements are detailed in Shao et al. (Reference Shao, Pons-Branchu, Zhu, Wang, Valladas and Fontugne2017). The carbonate samples were weighed and dissolved in 7N HNO3 in Teflon beakers containing a known quantity of a 229Th-233U-236U triple spike. U and Th were preconcentrated by coprecipitation with iron hydroxide and then separated from each other and from other cations by passing the sample solution through a U-TEVA resin column. The U/Th fractions were then dried and diluted in a mixture of 0.1N HNO3 and 0.01N HF for isotopic analysis by a multi-collector inductively coupled plasma mass spectrometer (MC-ICP-MS, Neptune) at the School of Geography, Nanjing Normal University, using the methods described in Shao et al. (Reference Shao, Li, Huang, Liao, Arps, Huang and Chou2019). The U isotopic data were acquired by two static sequences. The first sequence measured 233U, 235U, 236U, and 238U in Faraday cups and simultaneously 234U on the secondary electron multiplier (SEM); and the second sequence measured 236U on the SEM and the other isotopes are in Faraday cups. Thorium measurements were carried out immediately after U measurements for the same sample. The 229Th and 230Th were alternately measured on the SEM and 232Th in a Faraday cup. Mass fractionation was corrected by comparing the measured 238U/235U to the natural value of 137.760 for HU-1 and 137.818 for unknown samples (Hiess et al., Reference Hiess, Condon, McLean and Noble2012). Hydride interferences, machine abundance sensitivity, and amplifier gains were evaluated every day prior to measurements. 230Th/U ages were calculated using half-lives of 75,584 yr and 245,620 yr for 230Th and 234U, respectively (Cheng et al., Reference Cheng, Edwards, Shen, Polyak, Asmerom, Woodhead and Hellstrom2013). The 230Th/U age uncertainty was estimated by Monte-Carlo simulations (n = 106). All of the speleothem ages have 2-sigma analytical errors of roughly 0.2–0.4% (Table 1).
230Th dating results for sample HL161 stalagmite from Hulu Cave, China.
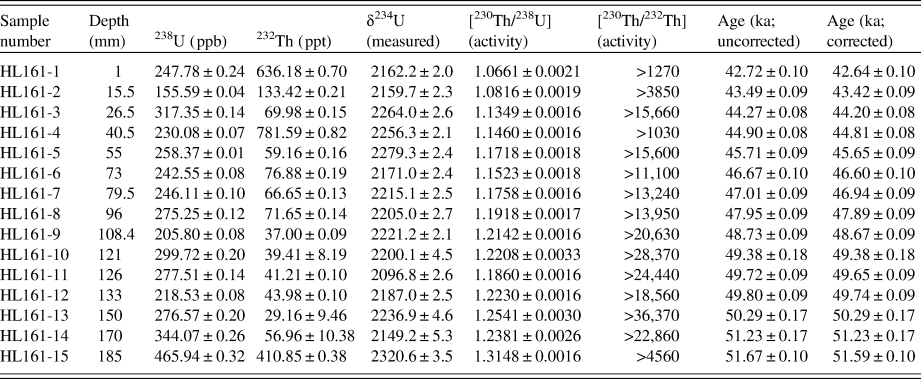
*Errors are 2-sigma analytical errors. Decay constant values are λ230 = 9.1705 × 10⁻⁶ yr−1, λ234 = 2.82206 × 10⁻⁶ yr−1, λ238 = 1.55125 × 10⁻¹⁰ yr−1. Corrected 230Th ages (ka before AD 1950) assume an initial 230Th/232Th atomic ratio of (4.4 ± 2.2) × 10−6.
Only the section from the top to 187-mm depth was used for stable isotope analyses, because the lower part was less densely crystallized. Powdered subsamples (each ~50 µg) were shaved at a resolution of 0.1 mm from along the growth axis with a knife. Every second sample (n = 969) was measured using a Finnigan-MAT 253 mass spectrometer coupled with a Kiel Carbonate Device at the School of Geography, Nanjing Normal University, China. All results are reported in parts per mil (‰) relative to the Vienna Pee Dee Belemnite. Repeated analyses of an international standard (NBS19) indicated long-term reproducibility, with precisions better than 0.06‰ for δ18O and 0.05‰ for δ13C at the 1-sigma level.
A total of 170 powdered samples were drilled with carbide dental burrs along the growth axis and used for trace element analyses at Chongqing Key Laboratory of Karst Environment, Southwest University, China. Each sample weighed 300 ± 50 µg and was dissolved in a solution of 3% HNO3 and 1% HF. Mg and Ca were analyzed using an inductively coupled plasma optical emission spectrometer (ICP-OES, Perkin-Elmer), and Sr and Ba were measured using a single-collector inductively coupled plasma mass spectrometer (SC-ICP-MS, Element XR). International standard SLRS-5 was used to determine the accuracy and precision of the analyses. The precisions are better than 3% for Ca, 3% for Mg, 5% for Ba, and 10% for Sr.
Trace element analyses of bedrock and dripwater samples were made using an inductively coupled plasma atomic emission spectrometry (ICP-AES, Perkin-Elmer Optima) in the Department of Civil and Structural Engineering, Hongkong Polytechnic University, China. Nine bedrock samples and three dripwater samples were collected from inside the cave. Powdered subsamples (~10 mg) were drilled in the unweathered part of each bedrock sample using carbide dental burrs. The subsamples were then digested with concentrated HNO3 and HClO4 (in a ratio of 4:1) and taken to complete dryness on a hot plate. The water samples were filtered through a Millipore membrane (0.45 µm) to remove fine particles, transferred to a polyethylene bottle, and then acidified with 0.2% HNO3. Details of the chemical extraction procedures and the ICP-AES analysis are given in Li et al. (Reference Li, Coles, Ramsey and Thornton1995). Reagent blanks, standard reference materials (NIST 1646a), and sample replicates were used to assess the accuracy and precision of the analyses. The precisions for the measured elements (Mg, Sr, and Ca) are generally <10%.
RESULTS
Chronology
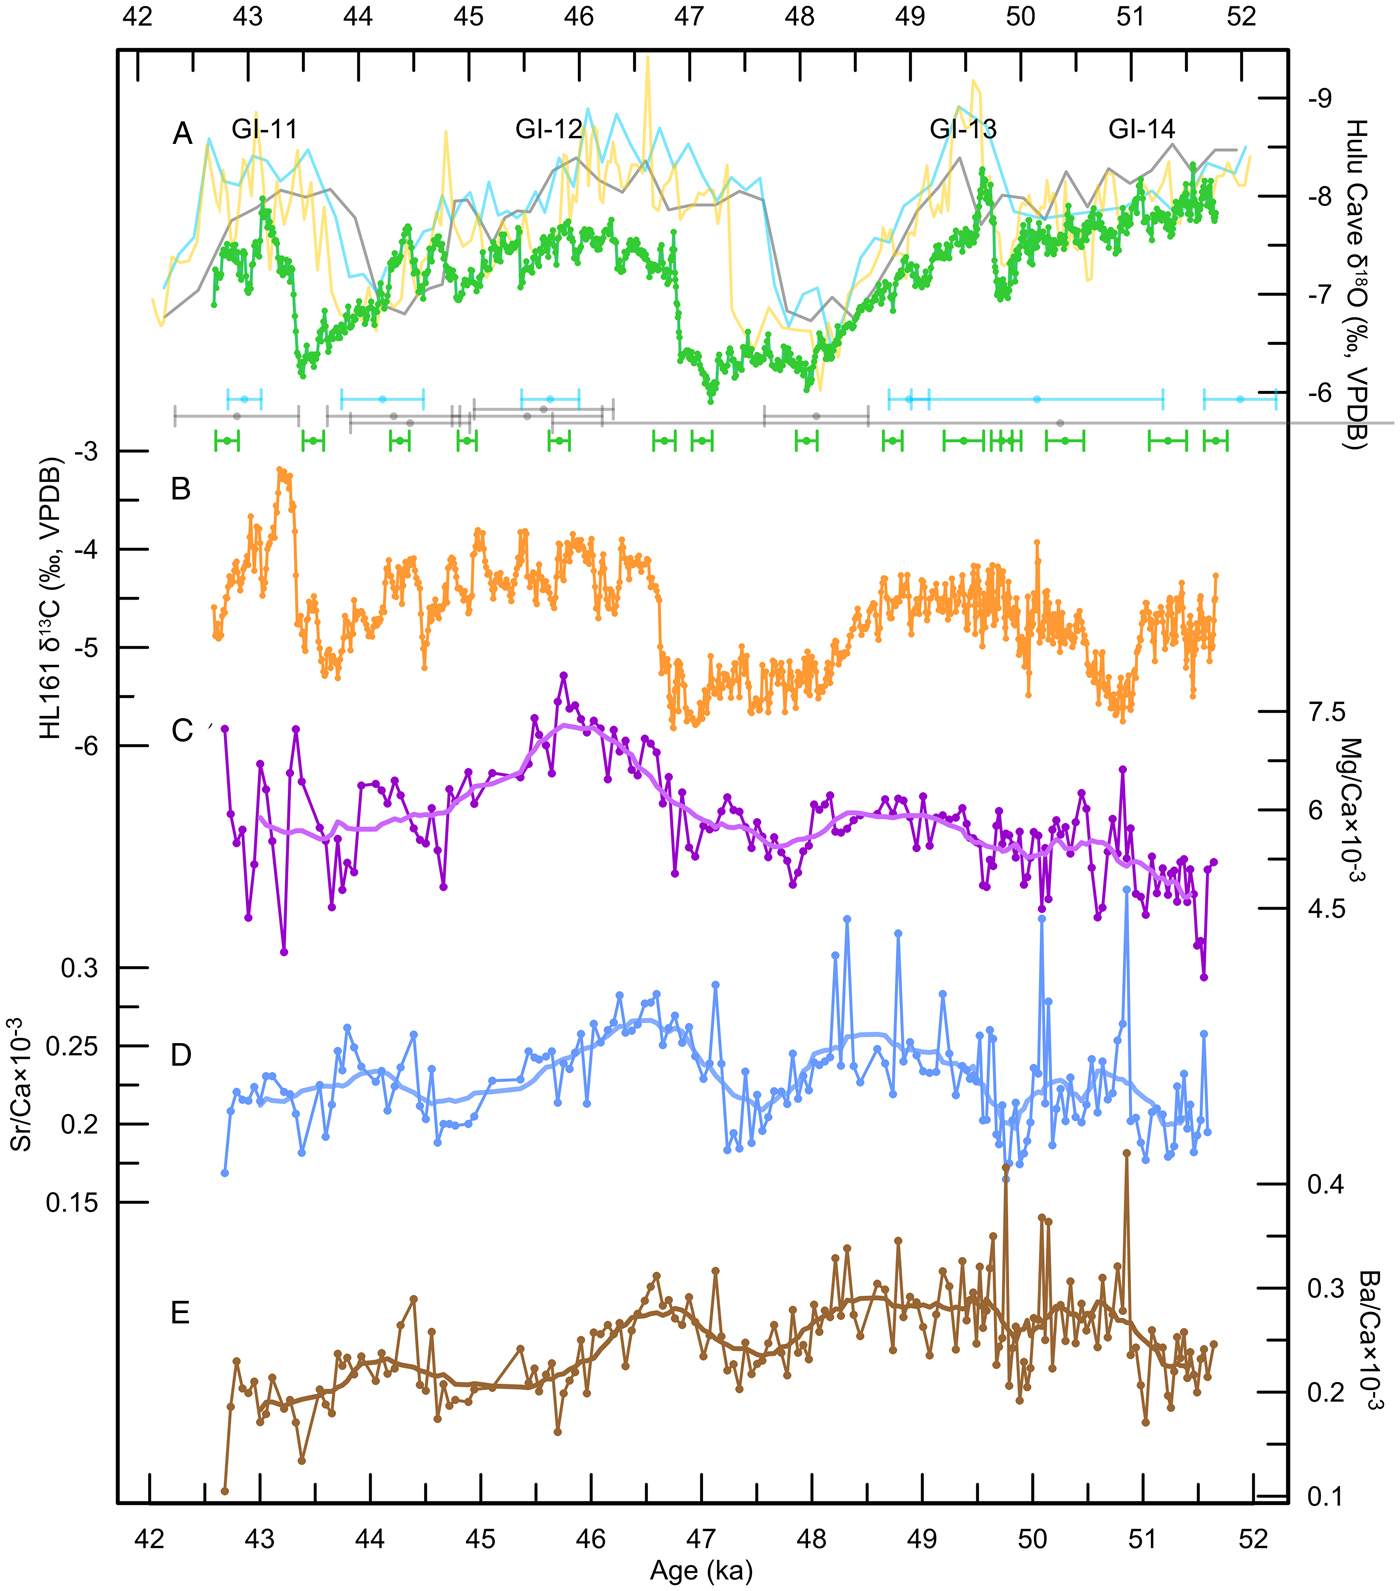
U-Th isotopic compositions and 230Th ages for stalagmite HL161 are presented in Table 1. Measured 238U concentrations range from 155–465 ppb and 232Th concentrations range from 29–781 ppt. The corrections for initial detrital 230Th are negligible, as indicated by the high values of the 230Th/232Th activity ratios (>1000). The age model for stalagmite HL161 was constructed by linear interpolation of the 230Th/U dates (Fig. 1) and the resulting chronology spans the interval of 51.7–42.6 ka, which includes DO 14–11. The average temporal resolution is ~10 yr for stable isotopes (δ18O and δ13C) and ~50 yr for trace elements (Mg/Ca, Sr/Ca, and Ba/Ca; Fig. 2). Thus, the records are well-suited for determining the paleoenvironmental evolution of the monsoonal region of China on millennial to centennial scales.
Multi-proxy records for stalagmite HL161. (A) δ18O records for stalagmite HL161 (green curve; this study), MSL (blue curve; Wang et al., Reference Wang, Cheng, Edwards, An, Wu, Shen and Dorale2001), MSD (grey curve; Wang et al., Reference Wang, Cheng, Edwards, An, Wu, Shen and Dorale2001) and a new composite record (yellow curve; Cheng et al., Reference Cheng, Edwards, Sinha, Spötl, Yi, Chen and Kelly2016). 2-sigma error bars for the records are also shown with corresponding colors. The previously published Hulu records are plotted for comparison with the record of stalagmite HL161. (B–E) are other multi-proxy records from stalagmite HL161. (B) δ13C. (C) Mg/Ca × 10−3. (D) Sr/Ca × 10−3. (E) Ba/Ca × 10−3. The bold lines in (C–E) are 13-point running averages of the raw data and show the long-term trends. (For interpretation of the references to color in this figure legend, the reader is referred to the web version of this article.)

Time series of the proxy records
The stable isotope records vary substantially during the studied period. δ18O varies from -8.3 to -5.9‰ (Fig. 2A) and δ13C from -5.8 to -3.2‰ (Fig. 2B). Three positive δ18O excursions, centered at 49.7, 47.5, and 43.4 ka, enable the entire profile to be divided into four negative phases. These four negative δ18O intervals correspond to GI 14-11 (Wang et al., Reference Wang, Cheng, Edwards, An, Wu, Shen and Dorale2001). Rapid δ18O shifts (within <100 yr), with amplitudes >1‰, mark the onset of GI 13, 12, and 11. The changes in δ13C exhibit an antiphased relationship with δ18O on the millennial scale, with 13C enrichment corresponding to 18O depletion. However, this relationship is muted during GI 14, during which a negative period is evident in the δ13C record, with no corresponding shift in the δ18O record.
The “Hendy test” and “Replication test” are used to assess whether calcite precipitation is in equilibrium (Hendy, Reference Hendy1971; Dorale and Liu, Reference Dorale and Liu2009). The negative correlation between δ18O and δ13C in stalagmite HL161 (R = −0.37, P < 0.01) indicates insignificant kinetic isotopic effects (Hendy, Reference Hendy1971). Moreover, the record strongly resembles the pattern of millennial-scale fluctuations previously recorded from Hulu Cave, within the dating uncertainties (Fig. 2A; Wang et al., Reference Wang, Cheng, Edwards, An, Wu, Shen and Dorale2001; Cheng et al., Reference Cheng, Edwards, Sinha, Spötl, Yi, Chen and Kelly2016). Thus, the record passes the “Replication test” (Dorale and Liu, Reference Dorale and Liu2009). Under isotopic equilibrium conditions, the δ18O records of the stalagmites of Hulu Cave reliably reflect the δ18O signal of meteoric precipitation. Modern observations of dripwater and rainwater at the cave site support this interpretation (Wang et al., Reference Wang, Wang, Shao, Liang, Zhang and Kong2018). Following the reasoning of previous studies (Wang et al., Reference Wang, Cheng, Edwards, An, Wu, Shen and Dorale2001, Reference Wang, Cheng, Edwards, Kong, Shao, Chen and Wu2008; Liu et al., Reference Liu, Wen, Brady, Otto-Bliesner, Yu, Lu and Cheng2014; Duan et al., Reference Duan, Wu, Wang, Edwards, Cheng, Kong and Zhang2015; Cheng et al., Reference Cheng, Edwards, Sinha, Spötl, Yi, Chen and Kelly2016; Wang et al., Reference Wang, Wang, Shao, Liang, Zhang and Kong2018), we conclude that the stalagmite δ18O record is a proxy of the East Asian summer monsoon (EASM), with intervals of δ18O depletion representing stronger monsoon. However, stalagmite δ18O records are likely to integrate the effects of complex hydroclimatic processes, including moisture sources, degree of Rayleigh fractionation, and seasonal duration and intensity of monsoon rainfall.
The concentrations of Mg, Sr, and Ba of stalagmite HL161 are expressed as ratios to Ca. The Mg/Ca, Sr/Ca and Ba/Ca ratios have the following ranges: 3.4 × 10⁻³ to 8 × 10⁻³, 0.1 × 10⁻³ to 0.4 × 10⁻³, and 0.2 × 10⁻³ to 0.3 × 10⁻³, respectively (Fig. 2C–E). The Sr/Ca and Ba/Ca ratios, in particular, are strongly positively correlated (R = 0.65, n = 170, P < 0.01). The trace element ratios exhibit a coherent pattern of long-term fluctuations (bold lines in Fig. 2C–E): relative stability from the beginning of the record until ~48 ka and then a slight increase followed by an overall decreasing trend until ~42.6 ka. Notably, the trace element ratios exhibit a long-term pattern of variation similar to that of δ13C, with higher values during GI periods, and vice versa.
DISCUSSION
Climatic teleconnection between the East Asian monsoon and North Atlantic regions
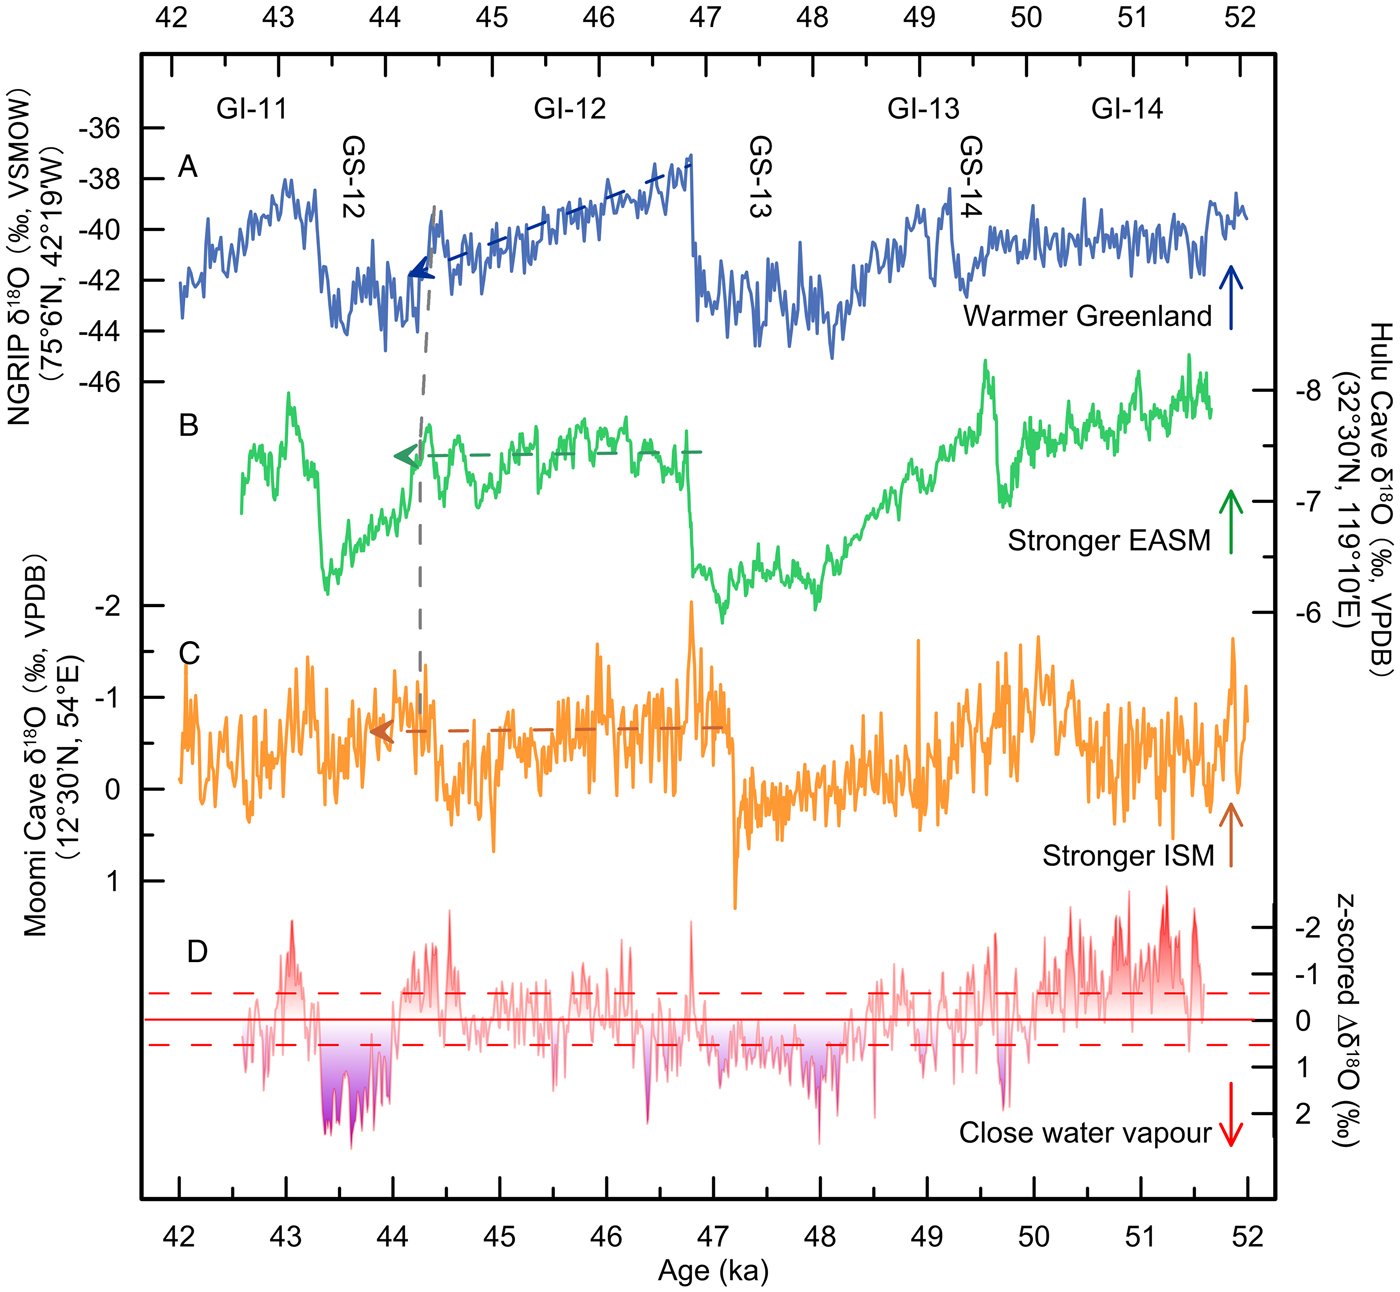
There are striking similarities between the δ18Ocalcite record from stalagmite HL161 and the Greenland NGRIP δ18Oice record (Fig. 3A and B; Andersen et al., Reference Andersen, Azuma, Barnola, Bigler, Biscaye, Caillon and Chappellaz2004). First, a stronger EASM indicated by depleted δ18Ocalcite values corresponds closely to Greenland interstadials and vice versa. This millennial-scale coupling of northern, high-latitude climates and low-latitude monsoons has been suggested by several other studies (Wang et al., Reference Wang, Cheng, Edwards, An, Wu, Shen and Dorale2001; Burns et al., Reference Burns, Fleitmann, Matter, Kramers and Al-Subbary2003; Carolin et al., Reference Carolin, Cobb, Adkins, Clark, Conroy, Lejau and Malang2013; Deplazes et al., Reference Deplazes, Lückge, Peterson, Timmermann, Hamann, Hughen and Röhl2013; Chen et al., Reference Chen, Wang, Hai, Edwards, Wang, Kong and Liu2016; Kathayat et al., Reference Kathayat, Cheng, Sinha, Spötl, Edwards, Zhang and Li2016). Second, abrupt monsoonal intensification closely tracks Greenland warming at the start of GI 13, 12, and 11. For example, the onset of GI 12 in the δ18Ocalcite record occurs over ~80 yr, which is close to the 60-yr transition of GI 12 in the δ18Oice record, according to Rampfit analysis of both records (Mudelsee, Reference Mudelsee2000). Third, the duration of GI 12 in the δ18Ocalcite record, which lasts ~2600 yr, is approximately equivalent to the duration of GI 12 estimated by Landais et al. (Reference Landais, Caillon, Goujon, Grachev, Barnola, Chappellaz and Jouzel2004) and Wolff et al. (Reference Wolff, Chappellaz, Blunier, Rasmussen and Svensson2010). In addition, one centennial-scale warming event which stands out from decadal oscillations in the Greenland δ18Oice record (referred to as a “rebound event” by Capron et al. [2010]) is also evident in low-latitude hydroclimatic records (dashed line in Fig. 3; see Deplazes et al. [2013]). These comparisons confirm that low-latitude monsoonal strengthening (weakening) corresponds to increased (decreased) Greenland temperature. Potentially, therefore, a common forcing mechanism exists for the DO cycles evident in both the North Atlantic and the Asian monsoonal regions. Potential mechanisms have been suggested to be associated with the Atlantic Meridional Ocean Circulation (Alley et al., Reference Alley2007) and/or astronomical forcing (Braun et al., Reference Braun, Christl, Rahmstorf, Ganopolski, Mangini, Kubatzki and Roth2005).
Comparison of δ18O records in the monsoonal regions with Greenland paleotemperature. (A) Greenland NGRIP δ18Oice record (Andersen et al., Reference Andersen, Azuma, Barnola, Bigler, Biscaye, Caillon and Chappellaz2004) plotted on the GICC05 timescale (Svensson et al., Reference Svensson, Andersen, Bigler, Clausen, Dahl-Jensen, Davies and Johnsen2008). (B) δ18Ocalcite record from stalagmite HL161 (this study). (C) δ18Ocalcite record from stalagmite M1-2 (Burns et al., Reference Burns, Fleitmann, Matter, Kramers and Al-Subbary2003). (D) Reconstructed water vapor source. △18O is calculated from the HL161 and M1-2 records and expressed as z-scores. Inferred periods of nearby water vapor sources (z-score △18O > 0.53) are shaded with standard deviations denoted by red dashed lines. The grey dashed line indicates a “rebound event” detected in the NGRIP δ18O ice record (Capron et al., Reference Capron, Landais, Chappellaz and Schilt2010). The blue dashed line denotes an overall cooling trend during GI 12, and the green and orange dashed lines indicate stable monsoon climates. (For interpretation of the references to color in this figure legend, the reader is referred to the web version of this article.)

Previous studies have shown that the GICC05 time scale for Greenland ice cores is systematically too young and that the age offsets increase further back in time (Wang et al., Reference Wang, Cheng, Edwards, An, Wu, Shen and Dorale2001; Fleitmann et al., Reference Fleitmann, Cheng, Badertscher, Edwards, Mudelsee, Göktürk and Fankhauser2009; Buizert et al., Reference Buizert, Cuffey, Severinghaus, Baggenstos, Fudge, Steig and Markel2014). The age offsets can be explained by the presence of uncertain annual layers (Andersen et al., Reference Andersen, Svensson, Johnsen, Rasmussen, Bigler, Rothlisberger and Ruth2005; Svensson et al., Reference Svensson, Andersen, Bigler, Clausen, Dahl-Jensen, Davies and Johnsen2008). Comparison with independent, well-dated time makers is an alternative means of evaluating the controversial GICC05 time scale. The onsets of GI 12 and 11 in the record from Hulu Cave are both in excellent agreement with equivalent GI events in the NGRIP record with nominal differences well within dating uncertainties. Our results are in accord with seven previous studies within dating errors (Burns et al., Reference Burns, Fleitmann, Matter, Kramers and Al-Subbary2003; Lachniet et al., Reference Lachniet, Johnson, Asmerom, Burns, Polyak, Patterson and Burt2009; Wagner et al., Reference Wagner, Cole, Beck, Patchett, Henderson and Barnett2010; Carolin et al., Reference Carolin, Cobb, Adkins, Clark, Conroy, Lejau and Malang2013; Moseley et al., Reference Moseley, Spötl, Svensson, Cheng, Brandstatter and Edwards2014; Chen et al., Reference Chen, Wang, Hai, Edwards, Wang, Kong and Liu2016; Dong et al., Reference Dong, Shen, Kong, Wang and Duan2018) and thus support the accuracy of the GICC05 time scale within the range of DO 12 and 11.
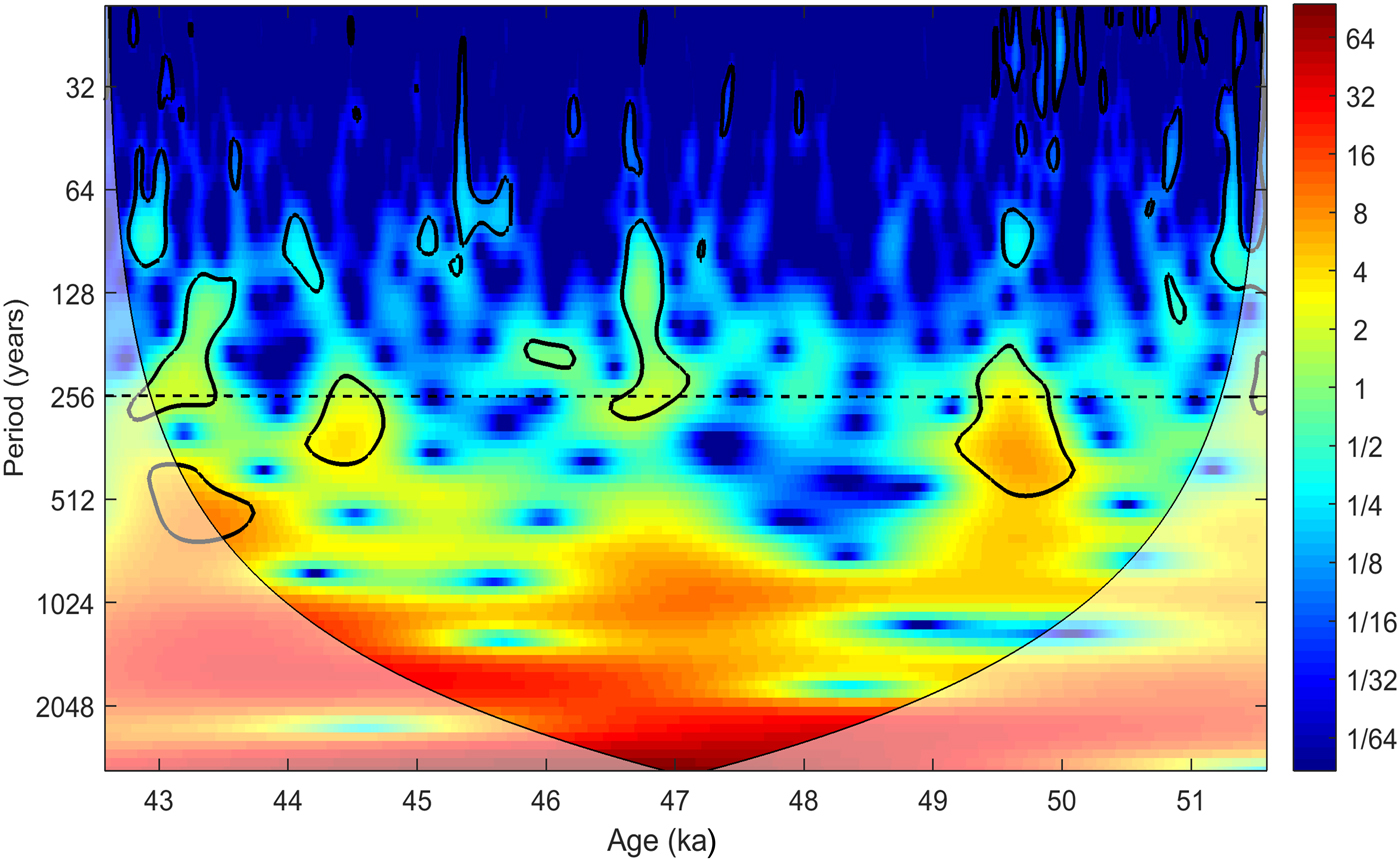
However, there are noticeable differences in the character of these high- and low-latitude climatic records. For example, during GI 12, Greenland temperature exhibits a decreasing trend (Fig. 3A), while the monsoon remains strong (Fig. 3B and C). In addition, the NGRIP δ18Oice record is characterized by decadal oscillations (10–50 yr; Boers et al., Reference Boers2018), which are different from the pattern of centennial monsoonal variability (~250 yr) superimposed on GI events (Fig. 4). This periodicity of monsoon instability approximates that of the de Vries solar cycle (Wagner et al., Reference Wagner, Beer, Masarik, Muscheler, Kubik, Mende and Laj2001), which may suggest a sensitive monsoonal response to solar activity under warm climatic conditions (Ji et al., Reference Ji, Shen, Balsam, Chen, Liu and Liu2005; Wang et al., Reference Wang, Cheng, Edwards, He, Kong, An and Wu2005).
Results of wavelet analysis of the δ18O record from stalagmite HL161. The horizontal dashed line indicates the ~250-yr band prominent during interstadials. Spectral power is shown by colors ranging from deep blue (weak) to deep red (strong). The 95% significance level against red noise is shown by the thick solid line. The spectra were estimated using the method of Grinsted et al. (Reference Grinsted, Moore and Jevrejeva2004; http://noc.ac.uk/using-science/crosswavelet-wavelet-coherence). (For interpretation of the references to color in this figure legend, the reader is referred to the web version of this article.)

The monsoon system is driven by two primary mechanisms: differential sensible heating between land and sea, and variations in latent heat exported from the southern subtropical Indian Ocean via cross-equatorial airflows (An et al., Reference An, Wu, Li, Sun, Liu, Zhou and Cai2015). A temporally variable relationship under different climatic conditions between the EASM and the Northern Hemisphere “pull” factors and Southern Hemisphere “push” factors was determined by Rohling et al. (Reference Rohling, Liu, Roberts, Stanford, Rasmussen, Langen and Siddall2009). According to their study, a southern “push” effect has a stronger control on millennial-scale monsoon variability during glacial states, and a northern “pull” effect has a stronger control during deglacial and interglacial states (Rohling et al., Reference Rohling, Liu, Roberts, Stanford, Rasmussen, Langen and Siddall2009). The striking similarity between the NGRIP and HL161 records in terms of their general trends and the abruptness of DO onsets indicates a rapid transmission via an atmospheric “pull” effect. Thus, we suggest that the “push” and “pull” processes affecting the variability of the cave δ18O signals are different between southwestern and eastern/northern China, leading to different DO patterns (Cai et al., Reference Cai, An, Cheng, Edwards, Kelly, Liu and Wang2006; Han et al., Reference Han, Li, Cheng, Edwards, Shen, Li and Huang2016; Duan et al., Reference Duan, Cheng, Tan and Edwards2016).
Dynamic changes of the westerly jet over China may be an important component of the climatic teleconnection between northern high latitudes and the Asian monsoonal region (Nagashima et al., Reference Nagashima, Tada, Matsui, Irino, Tani and Toyoda2007, Reference Nagashima, Tada, Tani, Sun, Isozaki, Toyoda and Hasegawa2011; Molnar et al., Reference Molnar, Boos and Battisti2010; Orland et al., Reference Orland, Edwards, Cheng, Kozdon, Cross and Valley2015). Notably, changes in the timing of the EASM are consistent with the shift of the westerly jet from a location to the south of the Tibetan Plateau to a location to the north (Molnar et al., Reference Molnar, Boos and Battisti2010; Orland et al., Reference Orland, Edwards, Cheng, Kozdon, Cross and Valley2015). In addition, the jet responds sensitively to northern high-latitude climate, including storm-track movements, sea-ice extent, and sea surface temperature (Laîné et al., Reference Laîné, Kageyama, Salas-Mélia, Voldoire, Rivière, Ramstein and Planton2009). During cold GS phases, the westerly jet may be weaker and its northward movement is delayed, essentially maintaining East Asia in a prolonged dry pre-monsoonal state (Orland et al., Reference Orland, Edwards, Cheng, Kozdon, Cross and Valley2015). The southern location of the westerly jet prevents isotopically light water vapor from penetrating into East Asia, resulting in heavier mean δ18O of rainfall. During the transition from GS to GI climate states, following the abrupt warming in northern high latitudes, a rapid northward movement of the jet may allow rapid and large-scale, low-level monsoonal flow into the interior of East Asia, with a corresponding rapid decrease in δ18Ocalcite values. This mechanism is supported by changes in the water vapor supply of EASM rainfall, as discussed below.
The high degree of similarity of the HL161 δ18O record to other records from Chinese and Indian caves confirms that the δ18O changes are of regional extent (Burns et al., Reference Burns, Fleitmann, Matter, Kramers and Al-Subbary2003; Chen et al., Reference Chen, Wang, Hai, Edwards, Wang, Kong and Liu2016; Kathayat et al., Reference Kathayat, Cheng, Sinha, Spötl, Edwards, Zhang and Li2016; Dong et al., Reference Dong, Shen, Kong, Wang and Duan2018). One possible contributor to δ18O variability is the water vapor supply from source regions (Dayem et al., Reference Dayem, Molnar, Battisti and Roe2010; Baker et al., Reference Baker, Sodemann, Baldini, Breitenbach, Johnson, van Hunen and Zhang2015; Wu et al., Reference Wu, Zhang, Li, Li and Huang2015). In this study, we removed the δ18O signals of remote water vapor sources from the HL161 record by comparing it with a high-resolution calcite δ18O record (M1-2) from Moomi Cave in Socotra Island. Socotra Island is located upstream of the EASM - the Indian Ocean (Baker et al., Reference Baker, Sodemann, Baldini, Breitenbach, Johnson, van Hunen and Zhang2015) and is solely influenced by the Indian summer monsoon (Fig. 3C; Burns et al., Reference Burns, Fleitmann, Matter, Kramers and Al-Subbary2003). The two caves are linked in that they are both under the control of large-scale monsoonal circulation (Wang et al., Reference Wang, Wang, Cheng, Fasullo, Guo, Kiefer and Liu2014). According to the reconstructed global gridded precipitation prediction map of δ18O (Terzer et al., Reference Terzer, Wassenaar, Araguásaraguás and Aggarwal2013), the δ18O values decrease progressively along the pathway of water vapor from Socotra Island (-2.9 to 0.0‰) to South China (-8.9 to -6.0‰). The difference between the average δ18O values at the two cave sites (6.8%) is well within the range of the δ18O difference (8.9 to 3.1‰) between the water vapor source (the Indian Ocean) and the site of rainout (Nanjing), which could have been caused by Rayleigh fractionation during transport (Dansgaard, Reference Dansgaard1964).
Accordingly, we subtracted the M1-2 δ18O record from the HL161 δ18O record, after tuning M1-2 to the HL161 chronology with the aid of the very distinctive GI 12. We then performed a z-score transform (standard deviation = 0.53) and the results are expressed as z-scored △δ18O (Fig. 3D). The △δ18O values represent changes in water vapor supply from relatively close sources, including the West Pacific Ocean and/or inland China. The record enables us to elucidate the control of the westerly jet over the water vapor source of the EASM rainfall (Fig. 3D). Three periods with positive values, centered at 49.7, 47.6, and 43.7 ka and corresponding respectively to GS 14, 13, and 12, are prominent within the record. The positive △δ18O values represent increased water vapor supply from nearby sources due to the delayed shift in the position of the westerly jet. We then applied Empirical Mode Decomposition (Huang et al., Reference Huang, Shen and Long1998; Huang and Wu, Reference Huang and Wu2008) to determine the water vapor contribution from the Indian Ocean and the West Pacific Ocean/inland China during GS 14 to 12 (excluding the incomplete events GI 14 and 11). The estimated average water vapor proportions derived from distant and sources near Hulu Cave are 56.7 and 43.3%, respectively. However, during GS states, the nearby water vapor source comprises a higher proportion, with values of 47.6, 52.9 and 69.0% for GS 14, 13, and 12, respectively.
Response of cave hydrological cycles to monsoonal changes
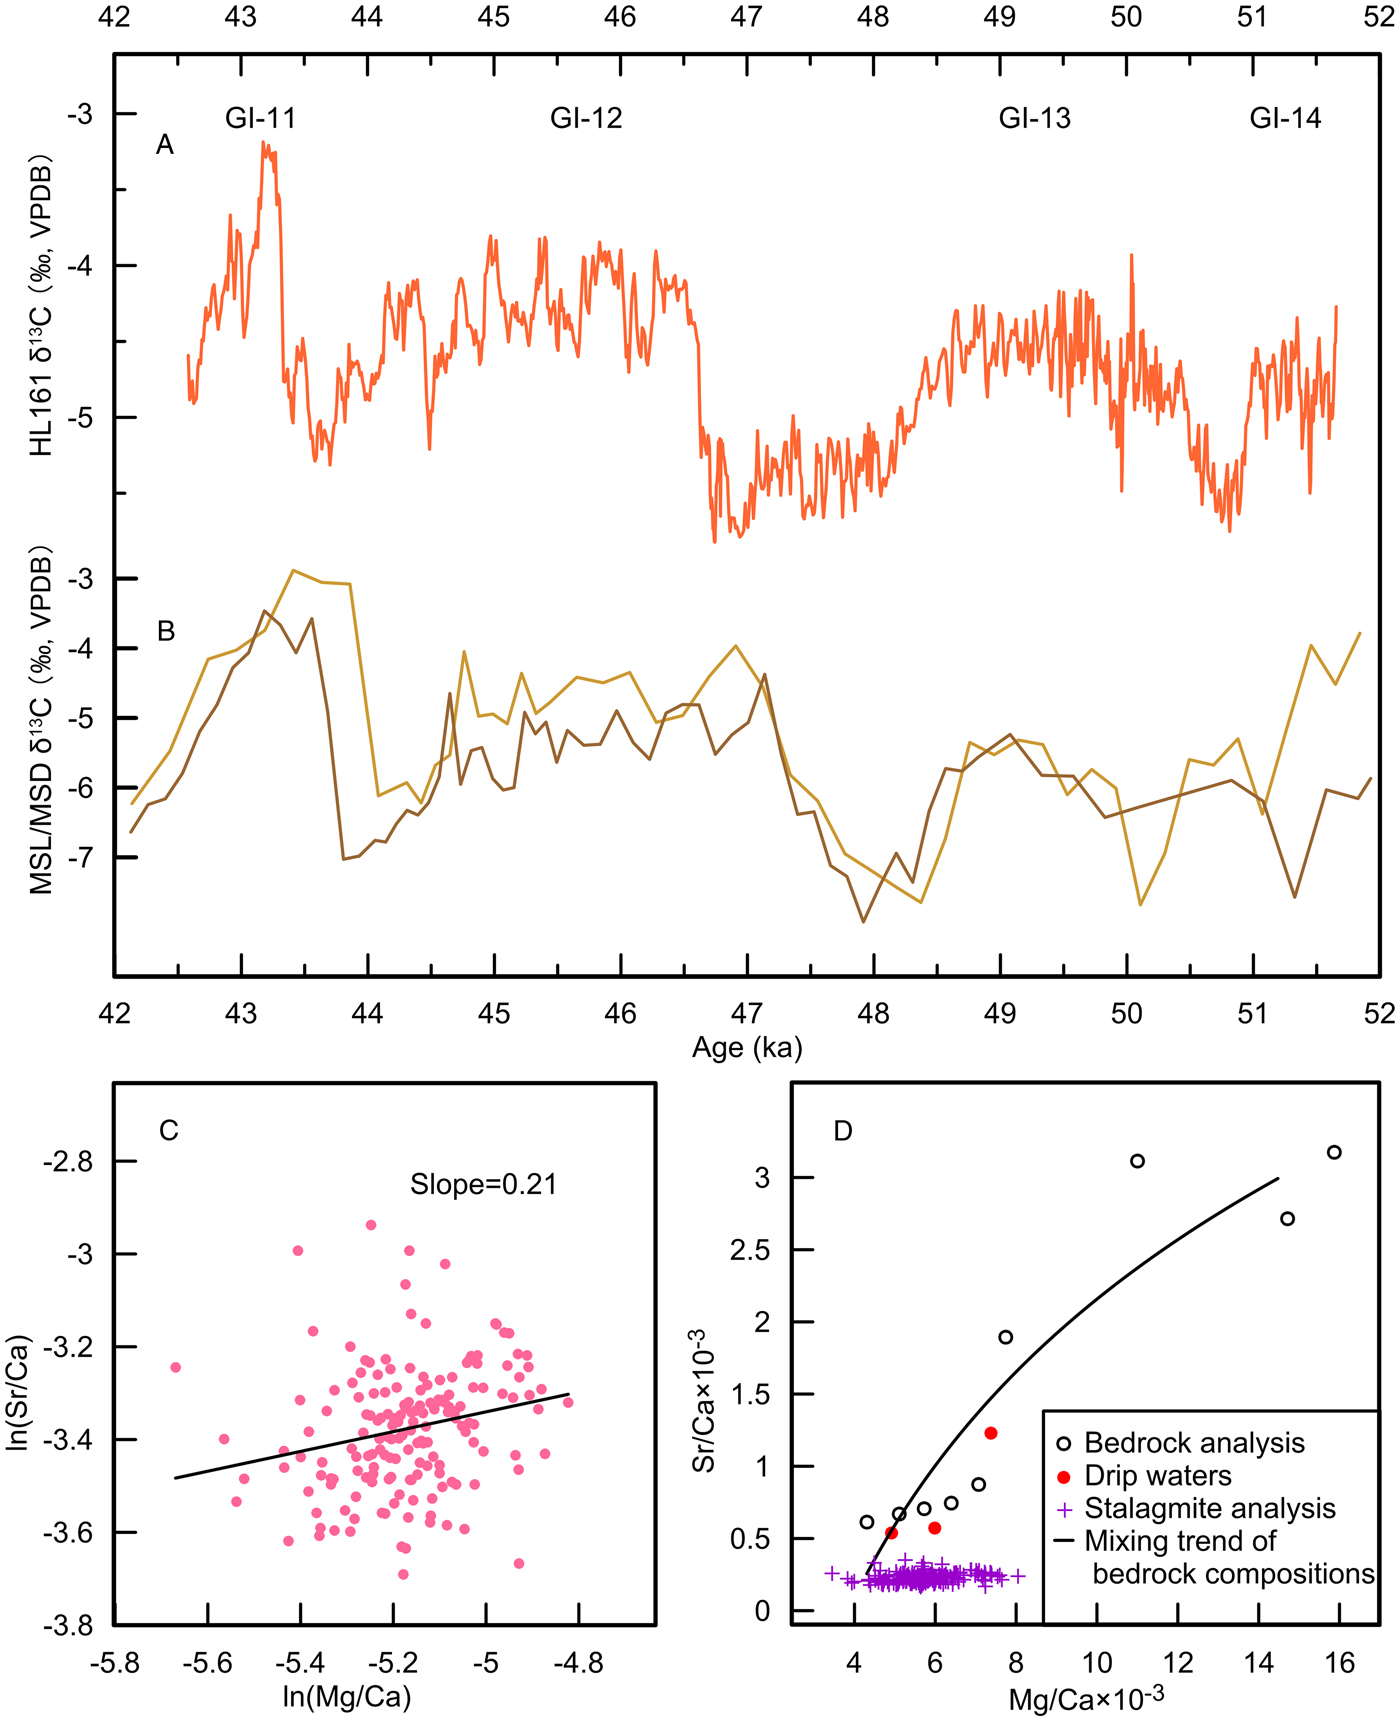
The high degree of consistency of the δ13C records from Hulu Cave (Fig. 5A and B) suggests that they reflect a common environmental process (Dorale and Liu, Reference Dorale and Liu2009). The antiphased relationship between δ13C and δ18O records of stalagmite HL161 on the millennial scale suggests that δ13C record is sensitive to monsoonal changes (Fig. 2A and B). A possible explanation for this correlation is a “damping model” which reflects local hydrology, with changes linked to rainfall (Kong et al., Reference Kong, Wang, Wu, Cheng, Edwards and Wang2005). A “damping model” requires a specific combination of the conditions of speleothem formation and climate factors: a thin soil cover and elevated precipitation (Baker et al., Reference Baker, Ito, Smart and Mcewan1997). Modern field observations show that the site of Hulu Cave has a thin soil cover, <30 cm deep, while rainfall is the main contributor to the recharge of the aquifer above the cave. The aquifer is also highly permeable, which allows rainwater to infiltrate rapidly within a few days after heavy rainfalls. This combination provides the necessary conditions for the “damping model.” Under heavy rainfall, equilibrium between soil water and soil CO2 cannot be attained due to the short residence time of the water, which results in a low degree of depletion of 13C in the speleothem (Baker et al., Reference Baker, Ito, Smart and Mcewan1997; Kong et al., Reference Kong, Wang, Wu, Cheng, Edwards and Wang2005). The inverse process operates under drier and colder climatic conditions. Notably, the similarity of speleothem δ13C and δ18O records is also demonstrated during the penultimate glacial period (Wang et al., Reference Wang, Wang, Shao, Liang, Zhang and Kong2018).
(A and B) Results of a replication test of δ13C records from Hulu Cave. (A) δ13C record for stalagmite HL161. (B) δ13C records from stalagmite MSL (brown) and stalagmite MSD (gold; Kong et al., Reference Kong, Wang, Wu, Cheng, Edwards and Wang2005). (C and D) Results of an analysis of trace element from Hulu Cave. (C) Relationship between ln(Mg/Ca) versus ln(Sr/Ca) for stalagmite HL161 with the slope of the best-fit regression line indicated. (D) Comparison of values of Sr/Ca and Mg/Ca for bedrock (black dots), cave water (red dots), and stalagmite HL161 (purple crosses). The cave water and stalagmite samples are depleted in Mg and Sr relative to Ca in comparison to bedrock. (For interpretation of the references to color in this figure legend, the reader is referred to the web version of this article.)

The similarity between the trace element ratios (Fig. 2C– E) on the millennial scale also suggests that they reflect a common set of local processes. Trends in stalagmite composition are ultimately derived from variations in the seepage water which are primarily controlled by local soil, regolith, and bedrock (Fairchild and Treble, Reference Fairchild and Treble2009). Processes such as PCP, differential dissolution of calcite and dolomite, selective leaching, and acids in water are potential controls of the trace element composition of speleothems (Fairchild et al., Reference Fairchild, Borsato, Tooth, Frisia, Hawkesworth, Huang and McDermott2000; Hellstrom and McCulloch, Reference Hellstrom and McCulloch2000; Fairchild and Baker, Reference Fairchild and Baker2012). Among them, PCP is one of the most-often cited explanations for the covariation of trace elements (Johnson et al., Reference Johnson, Hu, Belshaw and Henderson2006; Fairchild and Treble, Reference Fairchild and Treble2009; Sinclair et al., Reference Sinclair, Banner, Taylor, Partin, Jenson, Mylroie and Goddard2012; Stoll et al., Reference Stoll, Müller and Prieto2012). Sinclair et al. (Reference Sinclair, Banner, Taylor, Partin, Jenson, Mylroie and Goddard2012) presented a mathematical model of PCP and showed that the positive linear correlation between ln(Mg/Ca) versus ln(Sr/Ca) was given by  $\displaystyle{{{\rm K}{\rm d}_{{\rm Sr}}-1} \over {{\rm K}{\rm d}_{{\rm Mg}}-1}}$. This is a universal property of PCP and can be applied even when there is no prior characterization of the dripwater or host rock (Sinclair et al., Reference Sinclair, Banner, Taylor, Partin, Jenson, Mylroie and Goddard2012). Here, we used this model to calculate the slope of the theoretical PCP gradient in Hulu Cave. At a mean annual cave temperature of ~15°C, the partition coefficients adopted here are KdMg = 0.019 (Huang and Fairchild, Reference Huang and Fairchild2001) and KdSr = 0.1 (Treble et al., Reference Treble, Fairchild, Griffiths, Baker, Meredith, Wood and McGuire2015). Assuming that the partition coefficients are constant and that PCP is the only process occurring in a closed water-rock system, the theoretical PCP gradient in Hulu Cave will be 0.92. However, the calculated slope for stalagmite HL161 is much smaller (0.21, Fig. 5C), thus indicating minor PCP effects during deposition.
At Hulu Cave, the congruent Ordovician limestone (Wang et al., Reference Wang, Wang, Shao, Liang, Zhang and Kong2018) indicates the absence of differential dissolution (Fairchild et al., Reference Fairchild, Borsato, Tooth, Frisia, Hawkesworth, Huang and McDermott2000). Selective leaching is also unlikely to occur. Compared with the bedrock mixing line, the concentrations of Sr and Mg relative to Ca in the dripwater and stalagmite are depleted (Fig. 5D; Fairchild and Treble, Reference Fairchild and Treble2009). Therefore, we exclude these factors as possible mechanisms for the covariation.
Our favored explanation relates to the acid concentrations in the soil water. The evidence for this is the case of Ba, which is a relatively immobile element due to the high cation exchange selectivity of Ba2+ (Mcbride, Reference McBride1994). Biological activity, however, can increase the weathering and leaching of Ba2+ by producing more concentrated carbonic acid, hydrogen ions, and organic exudates (Taylor et al., Reference Taylor, Leake, Quirk, Hardy, Banwart and Beerling2009). Under warm and wet conditions, these reactive species are supplied to the infiltrating water by elevated root respiration, litter decomposition, and other biological activities (Brook et al., Reference Brook, Folkoff and Box1983; Taylor et al., Reference Taylor, Leake, Quirk, Hardy, Banwart and Beerling2009; Plestenjak et al., Reference Plestenjak, Eler, Vodnik, Ferlan, Čater, Kanduč and Simončič2012), thus leading to increased concentrations of Ba2+ relative to Ca2+ (Hellstrom and McCulloch, Reference Hellstrom and McCulloch2000). The positive correlation between Sr/Ca and Ba/Ca ratios (R = 0.65, n = 170, P < 0.01) and the covariation of their long-term trends suggest that similar processes apply to Sr and Mg. The mobilized cations (Ba, Sr, and Mg) are thereby introduced into the cave environment from surficial soils and host rock by infiltrating water.
The variations in proxy δ13C and metal/Ca ratios strongly resemble the HL161 δ18O record. On the millennial scale, more negative δ18O values are consistent with the elevated δ13C values and Mg/Ca, Sr/Ca, and Ba/Ca ratios. This correlation even extends to the centennial scale, such as the episodes of monsoon strengthening at 51.2, 46.5, 45.8, and 44.3 ka. The general agreement between trace element ratios and stable isotope values indicates that both hydrological and biological activity at the local level responded sensitively to changes in monsoon.
CONCLUSIONS
We have produced a high-resolution and 230Th/U-dated multi-proxy record from a new stalagmite (HL161) from Hulu Cave. The records span the interval of 51.7–42.6 ka that encompasses DO 14–11. The records of the geochemical indicators of δ18O, δ13C, Mg/Ca, Sr/Ca, and Ba/Ca provide new perspectives on the EASM and cave hydrological cycles on millennial to centennial timescales.
The ~10-yr-resolution δ18O record is strikingly similar to that of the Greenland ice-core record in terms of the general pattern, suggesting a common forcing factor of DO cycles in both high and low latitudes of the Northern Hemisphere. The rapid transitions at the onset of GI events in our stalagmite record resemble the abrupt DO warming events in the NGRIP record and they are synchronous within dating errors. However, centennial-scale variations (~250 yr) during Chinese interstadials differ from the predominantly decadal-scale (10–50 yr) oscillations in the climate over Greenland. The surprisingly rapid response of the subtropical monsoon to Greenland temperature variations indicates a rapid atmospheric transmission mechanism. After removing the variance associated water vapor from the Indian Ocean from our δ18O record, the proportion of the nearby water vapor sources is higher during GS phases, implying that the westerly jet plays a key role in controlling the water vapor transport to eastern China. Therefore, we conclude that the calcite δ18O record of Hulu Cave can largely be interpreted as reflecting changes in monsoon intensity, which incorporates changes in water vapor sources.
The δ13C record of stalagmites from Hulu Cave reflects the effects of a “damping model,” which are linked with local rainfall. The Mg/Ca, Sr/Ca, and Ba/Ca ratios of stalagmite HL161 reflect the effects of biological activity within the soil above the cave during water infiltration. On the millennial and even the centennial scale, changes in δ13C and metal/Ca ratios resemble the δ18O record, with higher δ13C and metal/Ca ratios corresponding to lower δ18O values. This observation indicates that changes in local hydrology and ecosystem respond sensitively to variations in monsoon.
ACKNOWLEDGEMENTS
The authors are grateful to Jeffrey Dorale and two anonymous reviewers for their valuable comments, which substantially improved the manuscript. This research was supported by the National Nature Science Fund of China (awards 41571102, 41672164, 41372174, and 41130210), the Priority Academic Program Development of Jiangsu Higher Education Institutions (award 164320H116), the Jiangsu Center for Collaborative Innovation in Geographical Information Resource development and Application, the 111 program of China (approved Number: D19002), and United States National Science Foundation Grant 1702816.