
Introduction
Two-dimensional (2D)-layered nanomaterials, such as graphene and molybdenum disulfide (MoS2), have become increasingly popular because of their outstanding electrical, optical, and mechanical properties.[Reference Novoselov, Geim, Morozov, Jiang, Zhang, Dubonos, Grigorieva and Firsov1–Reference Splendiani, Sun, Zhang, Li, Kim, Chim, Galli and Wang3] The discovery and success of these materials have inspired black phosphorus (BP) to be viewed recently as a new nanomaterial in the 2D family. Unlike graphene with zero band gap[Reference Schedin, Geim, Morozov, Hill, Blake, Katsnelson and Novoselov4] and MoS2 which has a band gap of ~1.8 eV as a monolayer,[Reference Mak, Lee, Hone, Shan and Heinz5] BP has been shown to have a thickness-dependent direct band gap varying from ~0.3 eV in its bulk form to greater than 1.5 eV as a monolayer.[Reference Castellanos-Gomez, Vicarelli, Prada, Island, Narasimha-Acharya, Blanter, Groenendijk, Buscema, Steele, Alvarez, Zandbergen, Palacios and Van der Zant6] The structure of BP is highly asymmetric and provides unusually strong in-plane anisotropy in orthogonal directions along what are called the Zigzag (ZZ) and Armchair (AC) directions.[Reference Xia, Wang and Jia7–Reference Liu, Low and Ruden9] Moving along the two different lattice directions renders different properties to be exhibited based on the phonon–phonon interactions among other attributes. Although it shows promise as a semiconductor material, its elementary electrical and thermal conductivities have yet to be fully characterized and documented.
Monolayer and few-layer BP nanoflakes can be produced by a traditional Scotch tape-based mechanical exfoliation technique often used in obtaining graphene from graphite.[Reference Favron, Gaufrès, Fossard, Lévesque, Phaneuf-L'Heureux, Tang and Martel10] The repeated “peeling” of bulk BP using scotch tape causes the puckered layers of BP to come apart. Compared to graphene, the van der Waals forces are greater between the BP layers and make it difficult to obtain a monolayer, but few-layer and multi-layer BP are readily available using this technique. Raman spectroscopy is used to identify and characterize materials.[Reference Mak, Lee, Hone, Shan and Heinz5,Reference Geim and Novoselov11] BP has three characteristic Raman vibrational modes:  ${\rm A}_{\rm g}^1$ (out of plane), B2g (ZZ), and
 ${\rm A}_{\rm g}^{\rm 2}$ (AC).[Reference Tran, Soklaski, Liang and Yang12] Since vibrational information is specific to chemical bonds and the symmetry of molecules, a basic fingerprint is provided by which the materials can be ascertained.[Reference Li, Shi and Chopra13–Reference Liu, Huo, Gan, Li, Wei, Huang and Chen16] Raman spectroscopy can also be used to determine lattice directions.[Reference Li, Hu, Lin, Lai, Ji and Lau17,Reference Liu, Neal, Zhu, Luo, Xu, Tománek and Ye18] Since BP is highly anisotropic, polarized Raman measurements will cause the Raman peak in the direction chosen to be more intense.[Reference Li, Moy, Murthy, Hao, Cain, Hanson and Chen19] Therefore, when the polarized laser is aligned along the ZZ direction, the B2g vibrational mode will be more intense and the same is true along the AC direction. Polarized Raman spectroscopy provides a simple but effective way to determine the lattice directions of BP flakes. Preliminary thermal and electrical property measurements have been completed on few-layer BP flakes.[Reference Chen, Li, Chen, Ong and Zhao20]
For the electrical properties of BP materials, theoretical simulations have stated that electron and hole mobilities are significantly higher along the AC direction by a factor of about 2. The conductivity in the AC direction was reported as 14.58 µS and about 7.54 µS in the ZZ direction.[Reference Tao, Shen, Wu, Liu, Feng, Wang and Pang21] However, the anisotropic thermal properties of BP nanoflakes have not been well studied so far. Herein, the fabricated BP nanoflakes were measured for their thermal conductivity based on steady-state longitudinal heat flow using suspended-pad micro-devices. The measurements were conducted on relatively thick (10–100 nm) nanoflakes over a wide temperature range (20–100 °C). The results provide a fundamental understanding of the thermal properties on BP nanoflakes according to their anisotropic structure. As opposed to isotropy, the anisotropy of BP causes the material's properties to be directionally dependent. This basic understanding will give insight into the future fabrication of nanoscale electronic devices with thermal properties that can be well controlled.
Experimental details
The BP nanoflakes were obtained by a typical Scotch tape-based mechanical exfoliation method.[Reference Favron, Gaufrès, Fossard, Lévesque, Phaneuf-L'Heureux, Tang and Martel10] Briefly, a silicon substrate with numerous 10 µm-wide trenches was first cleaned with a 20% HF solution for 1 min to remove the surface oxide layer. The substrate was immediately switched into a nitrogen-based glove box. The bulk BP flakes adhered on the Scotch tape were uniformly settled on the substrate and gently pressed for several times. The sample was put in the glove box for 5 min and then the Scotch tape was removed slightly. Such exfoliation process was repeated for three to five times on the same substrate to obtain the final BP nanoflake-attached sample for the thermal conductivity measurement.
The temperature-dependent Raman spectroscopic system was used to determine the thermal conductivity of various BP nanoflakes. The thermal conductivity calculation is based on the linear dependence of their phonon frequency on the sample temperature.[Reference Balandin, Ghosh, Bao, Calizo, Teweldebrhan, Miao and Lau22,Reference Li and Chopra23] An external heating stage was used to vary the sample temperature to obtain the temperature coefficient. As mentioned above, the BP nanoflakes were suspended across two sides of the trenches in the silicon substrate that acted as the heat sink. The measurements were carried out using the HORIBA LabRAM confocal micro-Raman spectroscopy, which allows us to restrict the BP sampling volume to the suspended portion of the nanoflakes. A Raman laser with a wavelength of 532 nm and a spot size of 2 µm was focused at the center of the suspended BP nanoflakes. The spectra resolution of our Raman system is 0.1 cm−1. Unlike the measurement for 2D graphene and MoS2 materials,[Reference Yan, Simpson, Bertolazzi, Brivio, Watson, Wu and Xing24] the calculation in the current study is based on the one-dimensional heat conduction along directional BP nanoflakes.[Reference Li, Moy, Murthy, Hao, Cain, Hanson and Chen19,Reference Balandin25] When the optical laser heating was applied at the center of the nanoflakes, the heat transfer across the trench direction can be expressed by the basic Fourier's Law:
 $$\displaystyle{{\partial Q} \over {\partial t}} = K{\rm \oint} \nabla T\cdot dA,$$
where K is the thermal conductivity, Q is the amount of heat transferred over the time t, T is the absolute temperature, and A is the cross-section area of BP nanoflakes expressed by A = h × W (h and W represent the thickness and width of BP nanoflakes, respectively). Equation (1) can be further written as:
 $$\displaystyle{{\partial Q} \over {\partial t}} = -K\cdot A\cdot \displaystyle{{\partial T} \over {\partial x}},$$
In the long heat conduction path,
 $$\displaystyle{{\Delta Q} \over {\Delta t}} = -K\cdot A\cdot \displaystyle{{\Delta T} \over {\Delta x}},$$
 $$P = -K\cdot Wh\cdot \displaystyle{{T-T_0} \over {L/2}},$$
The change of laser power P leads to the variation of sample temperature T, thus,
 $$P_2-P_1 = -K\cdot Wh\cdot \displaystyle{{T_2-T_1} \over {L/2}}.$$
Considering the linear relationship between the Raman mode frequency and laser power or sample temperature, Eq. (5) can be derived as the following:
 $$\eqalign{K & = \displaystyle{L \over {2hW}}\cdot \displaystyle{{\Delta P} \over {\Delta T}} = \displaystyle{L \over {2hW}}\cdot \displaystyle{{\Delta P} \over {\Delta T}} = \displaystyle{L \over {2hW}}\cdot \displaystyle{{\Delta \omega /\Delta T} \over {\Delta \omega /\Delta P}} \cr & = \displaystyle{L \over {2hW}}\cdot \displaystyle{{\chi _T} \over {{\rm \chi} _P}}}.$$
Thus, we get,
 $$K = \displaystyle{L \over {2hW}}\cdot \displaystyle{{\chi _T} \over {{\rm \chi} _P}},$$
where L is the length of BP nanoflakes suspended across the silicon channel, χ T is the first-order temperature coefficient expressed as ω(T) = ω 0 + χ T · T, and  $\omega \lpar P \rpar = {\omega} ^{\prime}_{_0} + \chi _P\cdot P$ is the change of phonon frequency with incident laser power. χ T was obtained by measuring the phonon frequency at different temperatures, which was controlled by the Linkam DSC600 heating stage equipped with a T95-LINK PC interface controller. χ T was obtained by measuring the phonon frequency at different laser power from 0 to 120 µW. The actual laser power absorbed by BP nanoflakes was estimated by P = P 0 − P 1 = τ · P 0, where P 0 is the incident laser power and P 1 is the laser power that transmitted the nanoflake.
Results and discussion
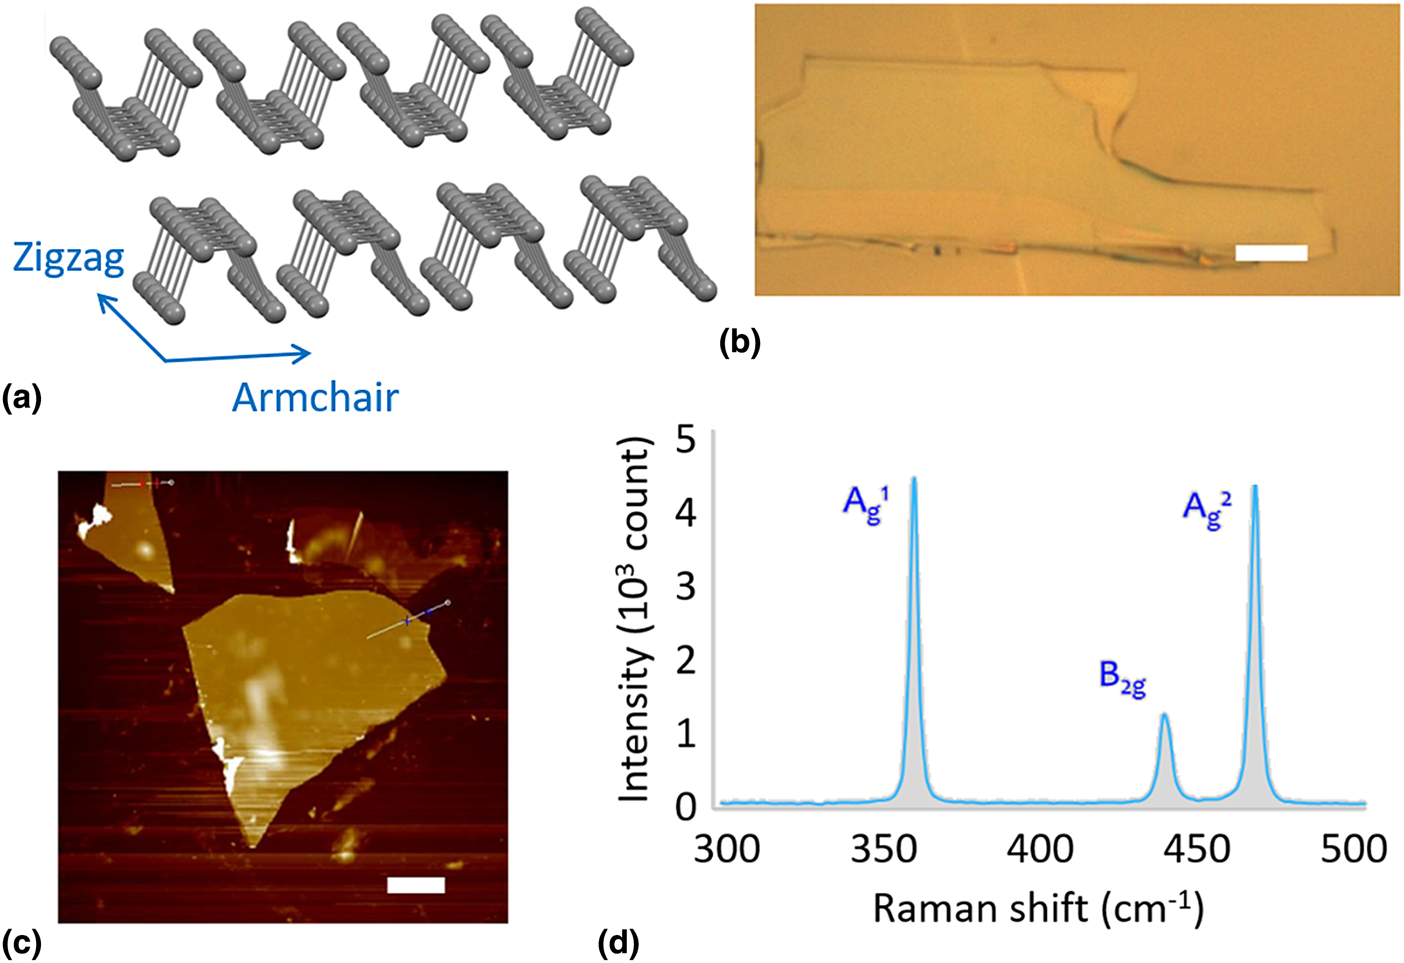
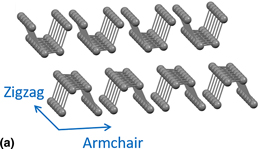
The goal of this study is to determine the relationship between the thermal properties of BP nanoflakes with the ZZ and AC directions. The atomic structure of the BP nanoflakes is shown in Fig. 1(a). Beginning with bulk BP, the nanoflakes were peeled off using the Scotch tape method made popular with graphene.[Reference Geim and Novoselov11] This mechanical exfoliation method allowed BP flakes around 10–100 nm in thickness to be developed. This method also allowed for preferable large flakes (>20 µm in length and width) to be produced. Due to the puckered atomic structure of BP, the van der Waals attractions between the phosphorus atoms are stronger than the flat nature of the carbon atoms in graphene, causing thinner films to be more difficult to obtain. Although research is currently being done to find other methods of producing BP thin films, the mechanical exfoliation method is still a cheap and reliable way to obtain the necessary flakes.
Exfoliation of BP nanoflakes. (a) Atomic structure of BP. (b) Optical image of an exfoliated BP nanoflake. (c) AFM image of the BP nanoflakes. (d) Raman characteristics of the BP nanoflakes. Scale bar: 5 µm.

Once flakes of BP obtained from mechanical exfoliation are shown in Fig. 1(b), the thicknesses were measured by the Atomic Force Microscopy (AFM) for calculating the thermal conductivity. The nanoflakes chosen for AFM measurements were first characterized under an optical microscope to make sure the flakes were large enough (>20 µm) in length and width [Fig. 1(c)]. The thickness of the nanoflakes (10–100 nm) was used as an important parameter for the thermal conductivity calculations as indicated in Eq. (7). It is worth noting that since BP is also unstable in ambient conditions, bubbles can form when surface oxidation occurs. When this happens, AFM will show that these bubbles are much higher than the actual flake's thickness, causing white dots to be visible in the AFM images. This provides a good way to estimate when a sample is no longer usable for testing the thermal and electrical properties. A typical Raman spectrum of the obtained BP nanoflakes is shown in Fig. 1(d). Similar to that mentioned above, the nanoflakes show three characteristic Raman vibrational modes:  ${\rm A}_{\rm g}^{\rm 1}$, B2g, and
 ${\rm A}_{\rm g}^{\rm 2}$, assigned to their different structural directions including out of plane, ZZ direction, and AC direction.[Reference Tran, Soklaski, Liang and Yang12–Reference Liu, Huo, Gan, Li, Wei, Huang and Chen16]
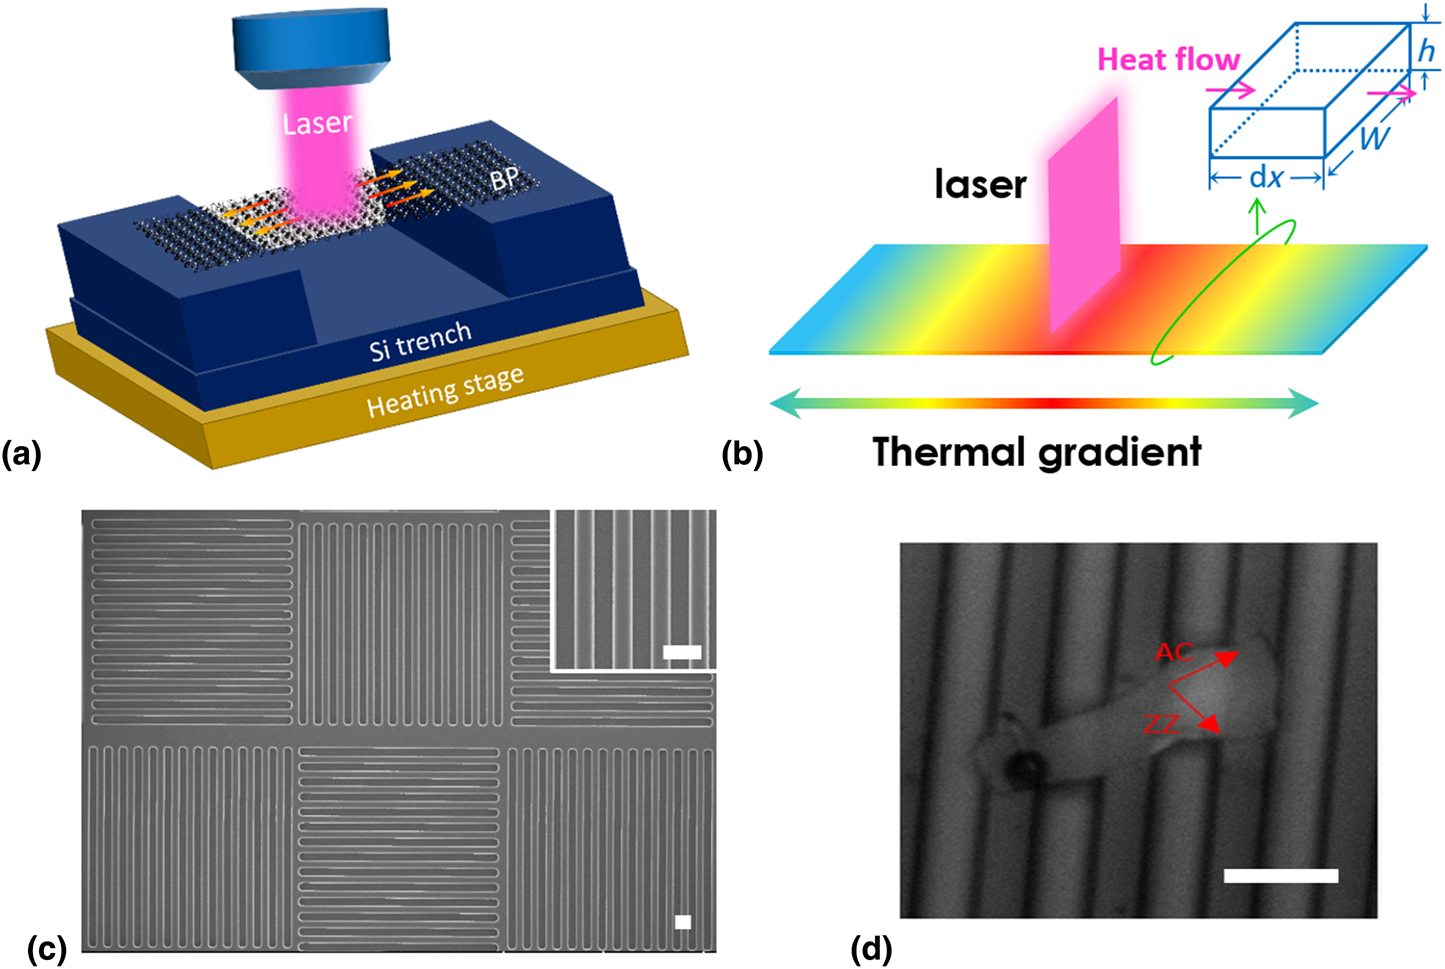
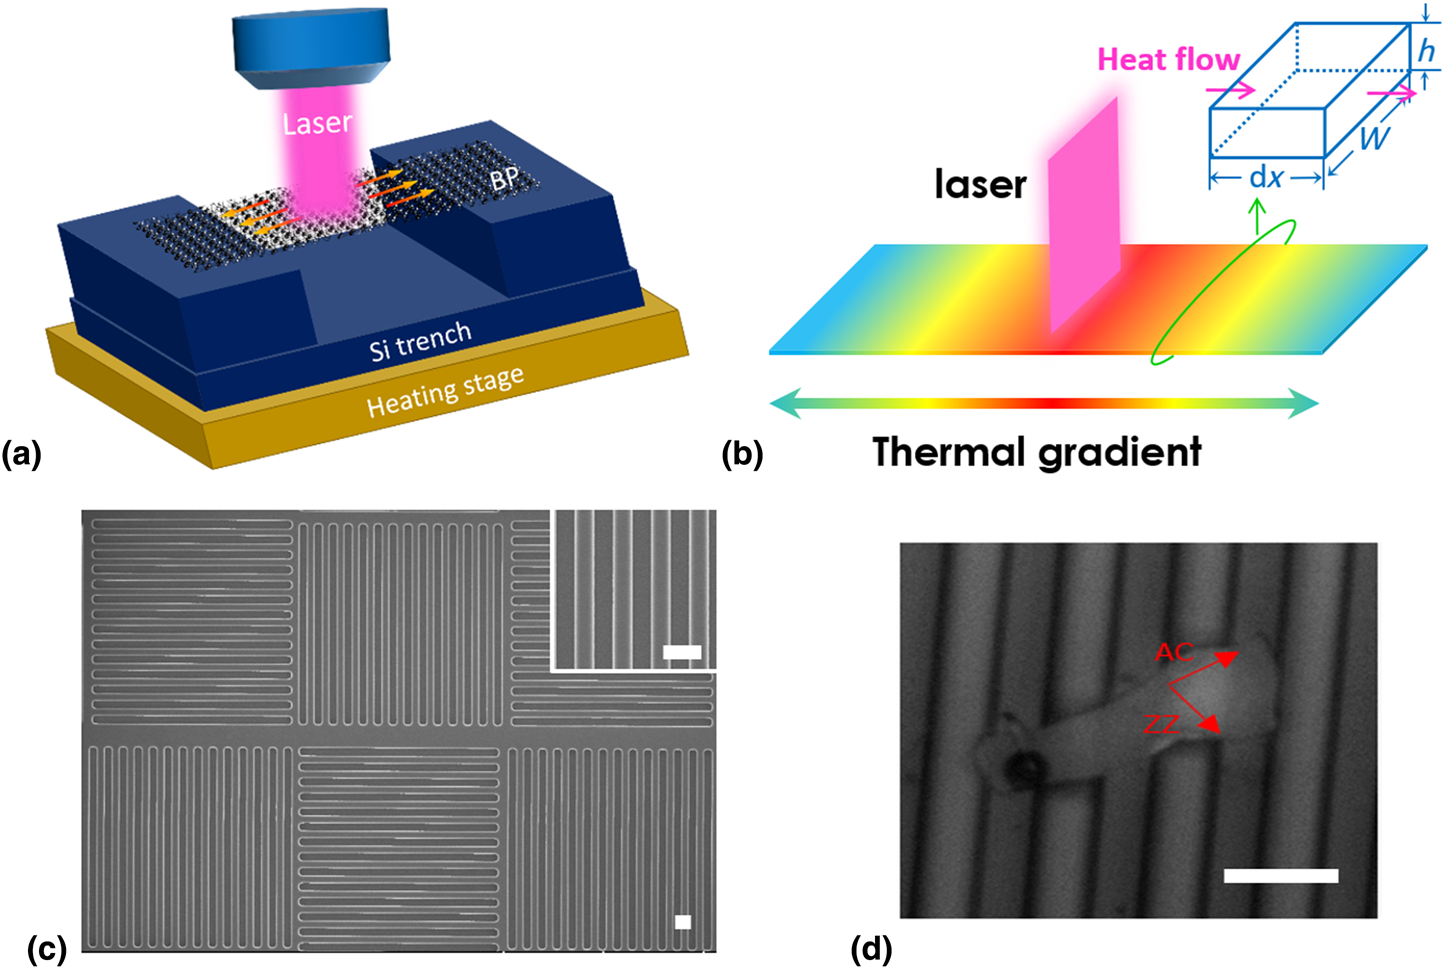
Thermal conductivity values were obtained using a simple, reliable, and accurate Raman Spectroscopy technique.[Reference Balandin, Ghosh, Bao, Calizo, Teweldebrhan, Miao and Lau22–Reference Yan, Simpson, Bertolazzi, Brivio, Watson, Wu and Xing24] The set-up is schematically shown in Fig. 2(a). Nanoflakes of BP were suspended across a trench of silicon and the Raman laser was turned on at the center of the flake. A 532 nm neon laser with a spot size of 2 µm was used as the optical heating source. The laser heats the BP flake and this heat travels towards the side [Fig. 2(b)]. SEM images of the silicon trench without and with the BP nanoflakes are shown in Figs. 2(c) and 2(d). The thermal conductivity measurement mainly includes the following steps: (1) Estimate the structural direction of the BP nanoflakes using a polarized Raman spectroscopy. (2) Measure the relationship between the peak position of Raman models and the sample temperature [temperature coefficient, ω(T)]. To change the substrate temperature, the substrate was kept in a chamber with a heating bed during the measurements. This chamber also served as a way to prevent surface oxidation by pumping out oxygen air and replacing the air with nitrogen gas. (3) Measure the relationship between the peak position of Raman models and the laser power [power coefficient, ω(P)]. (4) When the two coefficients are found, they are plugged into Eq. (7) to obtain the thermal conductivity values.
Raman set-up for the thermal measurement. (a) Schematic of the set-up. (b) Laser-induced thermal transfer in a BP nanoflake. (c) Silicon trenches fabricated by the photolithographic method. (d) A BP nanoflake suspended on the trench. Scale bar: 10 µm.
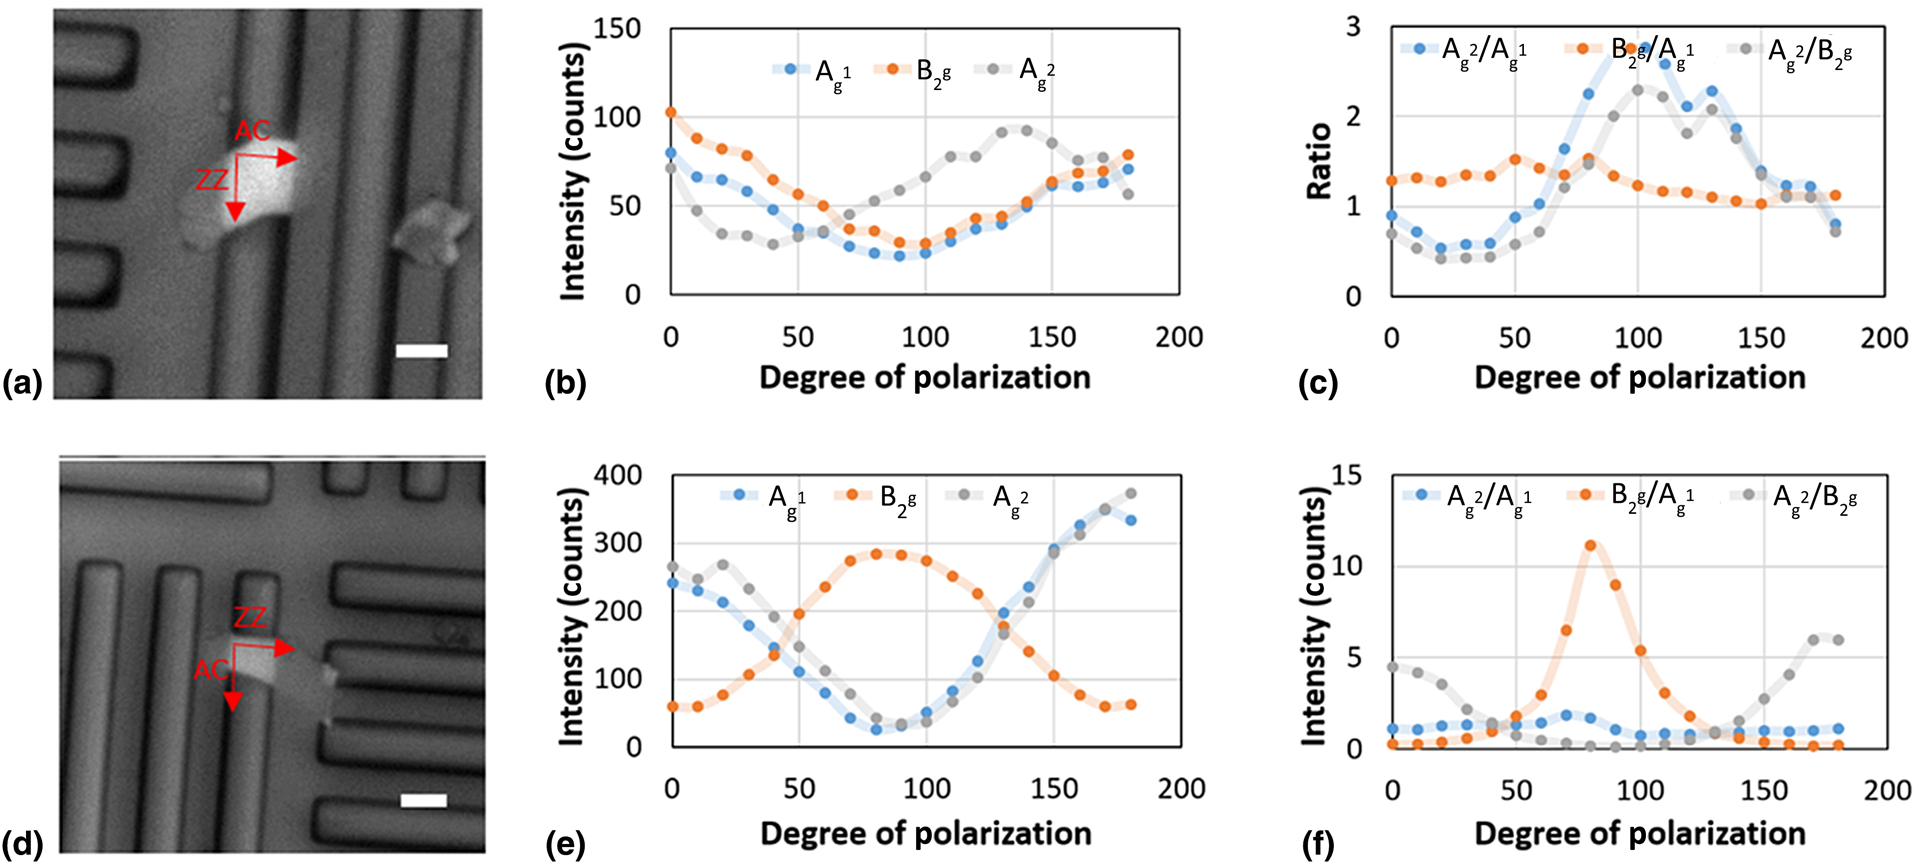
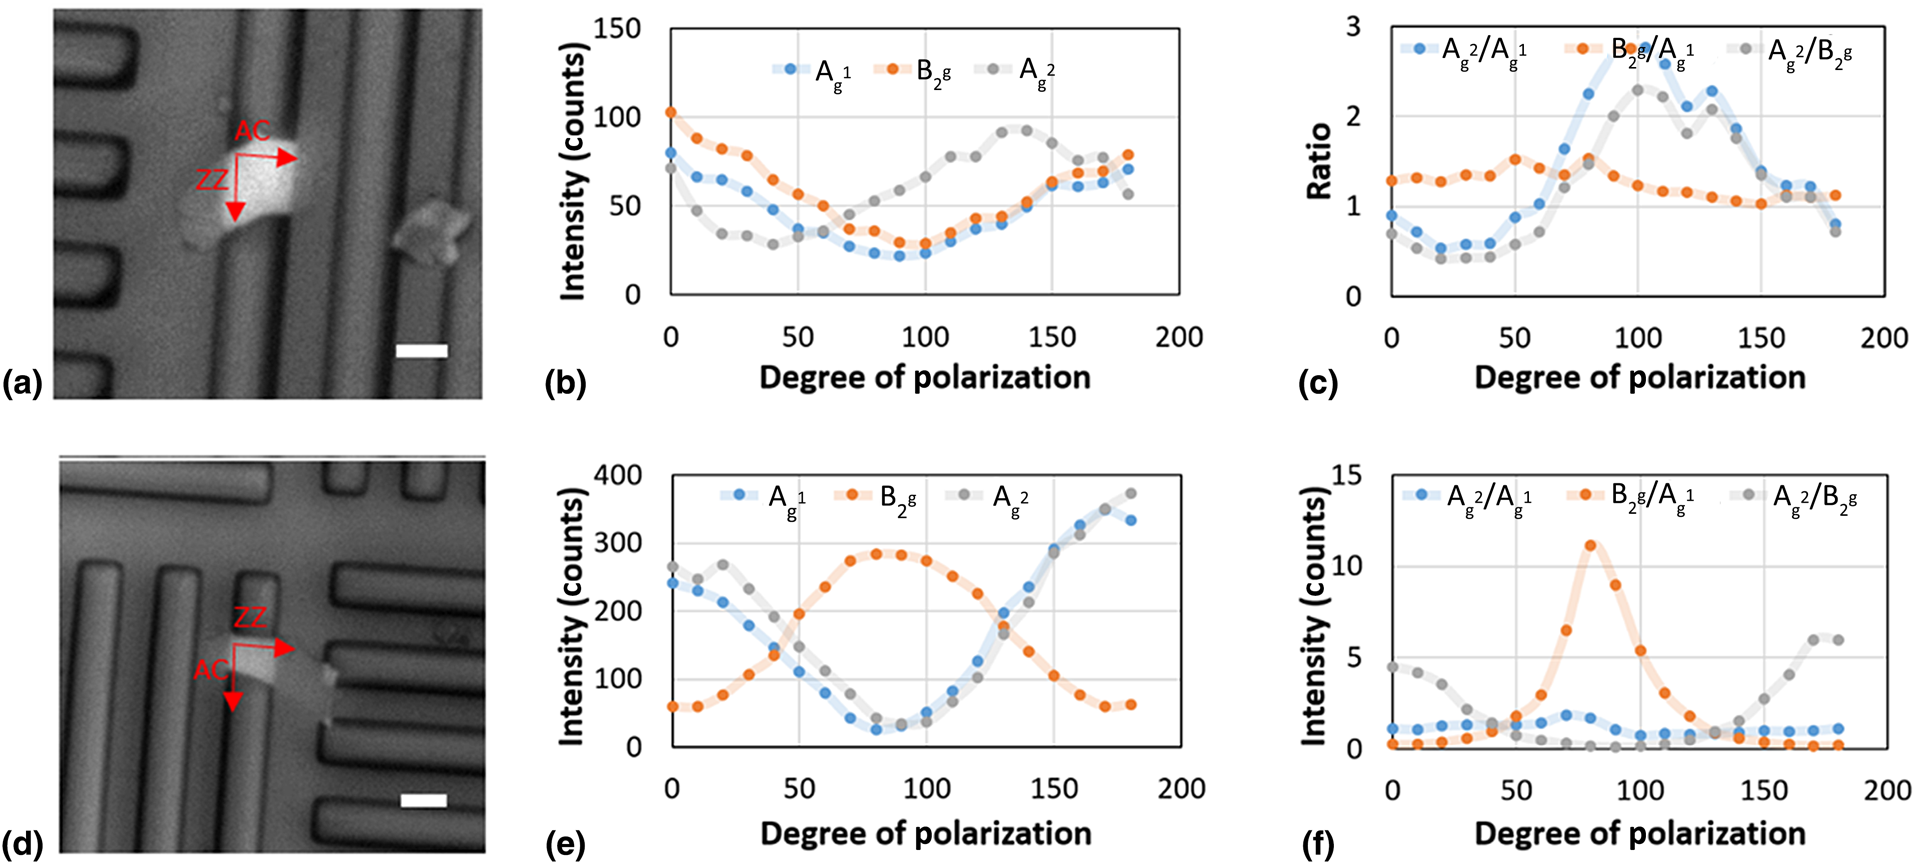
As we mentioned above, before conducting the thermal conductivity measurement, it is essential to define the direction (AC or ZZ) of the obtained BP nanoflakes. Once large flakes of BP were found, polarized Raman spectroscopy was performed to determine the two directions on the chosen flake.[Reference Wang, Jones, Seyler, Tran, Jia, Zhao and Xia26–Reference Zhu, Liang, Roberts, Lin and Akinwande28] The Raman laser was initially polarized to a specific direction for all the BP samples. As the laser was polarized and becomes aligned with one of the two lattice directions, the corresponding vibrational peak will become more intense. Based on the intensity of the vibrational modes, the ZZ and AC directions can be determined and nanoflake can be fabricated orthogonally on the flake. As shown in Fig. 3, two nanoflakes in the AC direction and ZZ direction were selected, respectively [Figs. 3(a) and 3(d)]. These directions were determined at 90 °C polarization. This degree mark was chosen because when the laser is polarized at 90 °C, the laser is in line with the lattice direction running across the trenches [Figs. 3(b) and 3(e)]. When the intensity of the  ${\rm A}_{\rm g}^{\rm 2}$ Raman peak is highest at 90 °C, the direction across the trench is understood to be in the AC direction [Figs. 3(c) and 3(f)]. As shown in Fig. 3(c), when the B2g intensity is highest, the direction tested will be in the ZZ direction. These three flakes allow for contrasting results to be observed when testing thermal conductivity. This is important for understanding which direction has better thermal properties.
Raman polarization measurement. (a) A suspended AC BP nanoflake, (b) its Raman peak intensity, and (c) the Raman peak ratio. (d) A suspended ZZ BP nanoflake, (e) its Raman peak intensity, and (f) the Raman peak ratio. Scale bar: 5 µm.
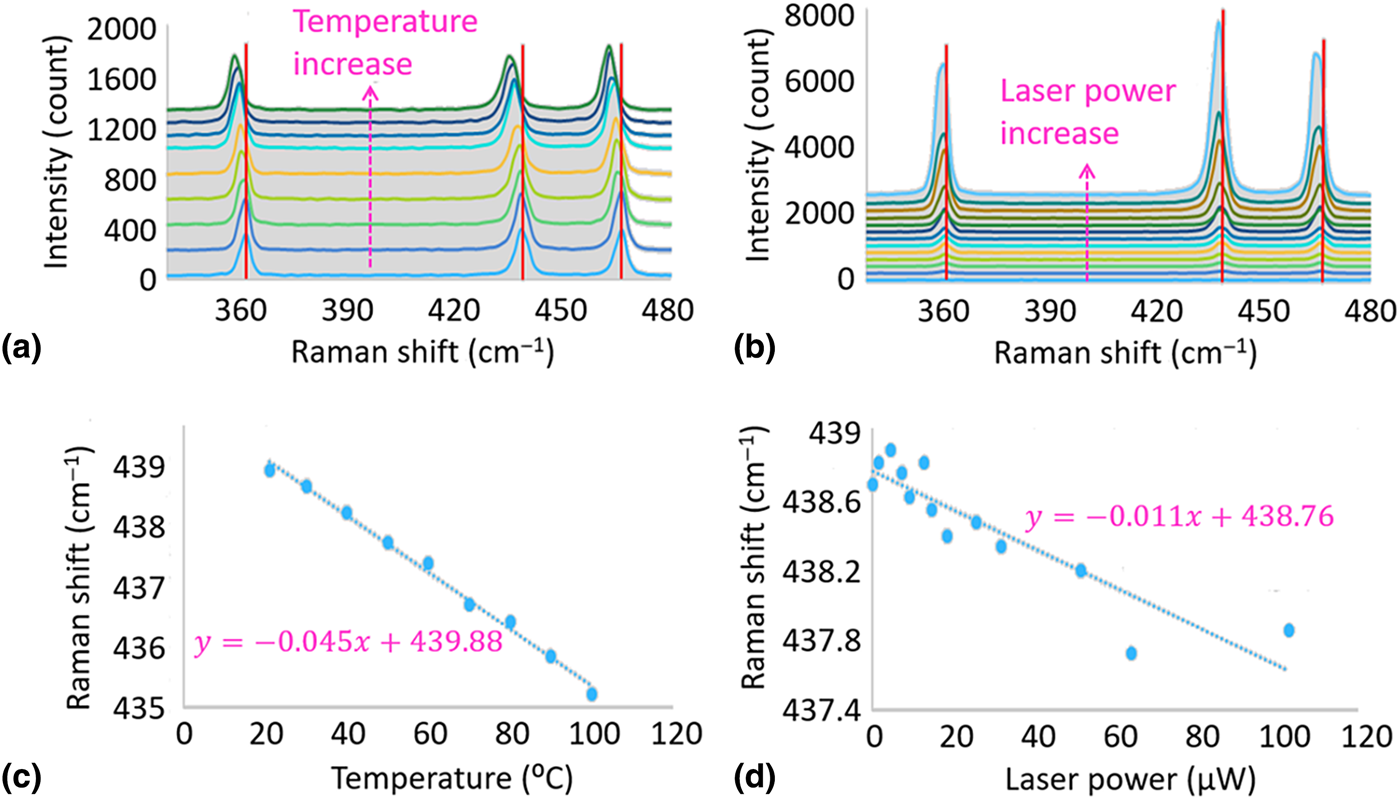
As depicted in Fig. 4(a), the temperature was increased from room temperature to 100 °C using a heating stage underneath the silicon substrate. As the temperature increased, we observed an obvious redshift of the Raman spectra. In Fig. 4(b), the laser power was increased from 0.218 to 103 µW which correspond to 0.01% and 5% of the total laser power, respectively. As the laser power increased, the Raman spectra are also red-shifted. The Raman shift positions were collected and plotted in a linear trend where the slopes are the temperature and power coefficients as shown in Figs. 4(c) and 4(d), respectively. Using the thermal conductivity equation mentioned earlier, the conductivity in the armchair direction for Flake 1 and zigzag direction for Flake 2. The thermal conductivities for the AC direction and the ZZ direction were 12.62 and 30.61 W/m·K, respectively. The Raman spectroscopy method used to measure and calculate the thermal conductivity was successful in obtaining accurate results. The values that were observed were similar to those discovered in recent literatures.[Reference Lee, Yang, Suh, Yang, Lee, Li and Ko29–Reference Islam, van den Akker and Feng32] Based on the thermal conductivity results, the ZZ direction in the BP crystal lattice had a higher value than that of the AC direction. These values indicate that the ZZ direction is better than the AC direction at conducting heat. The results were found using a very simple and accurate Raman spectroscopy technique which will be easier to implement in future works. Since the instability of BP is always a large limitation of the material, also understanding the effect of surface oxidation on the thermal conductivity and electrical properties will be important for device applications.
Thermal conductivity measurement. (a) Raman spectra at various temperatures. (b) Raman spectra at various laser power. (c) B2g peak location as a function of the temperature. (d) B2g peak location as a function of the laser power.

Conclusions
To sum up, this work provides a fundamental understanding of the relationship of thermal conductivity of black phosphorous nanoflake in different structural direction. The thermal conductivity values of both the AC and ZZ directions were calculated using a facial Raman spectroscopy technique, yielding higher conductivity in the ZZ direction. The results indicate that BP nanoflakes will allow for better heat management in nanoscale electronics. This study provides a direct reference for the fabrication of BP-related electronic devices where the thermal transfer behaviors have to be considered.
Acknowledgments
This work was partly supported by National Natural Science Foundation of China (No. 51802258) and project funded by the China Postdoctoral Science Foundation (No. 2018M643698).