


Introduction
In theJapan Islands, located to the east of the Eurasian continent, the northwesterly monsoon conveys heavy winter snowfalls to areas facing the Sea of Japan. More than half of the areas of Japan may be categorized as heavy-snowfall areas; every year severe winters and snow-related disasters occur. But since the latter half of the 1980s, winters have been relatively warm and in many snowy areas it has not snowed as heavily as in the past. People living in these areas are apt to consider this as a sign of global warming. The 1990s are moreover well known as the warmest decade of the 20th century. Whether global warming has been occurring or not remains an open question, but it is important to examine the climatic responses of snowy areas to the relatively warm winters that occurred in the latter part of the 1980s and during the 1990s.
Some studies have been conducted concerning climatic changes in snowy areas in Japan. Reference Nakamura and AbeNakamura and Abe (1998) studied the variation in amount of snow, winter precipitation and winter temperature over 60 years in Shinjo, a Japanese city that experiences heavy snowfalls. A similar investigation was carried out on the data at Nagaoka, which also experiences heavy snowfalls and is in a relatively warm climate zone (Reference Nakamura and ShimizuNakamura and Shimizu, 1996). Furthermore, Reference Nakamura, Abe, Shimizu and OhataNakamura and others (2000), in summarizing the above-mentioned studies (adding data from Morioka, a colder, less snow-covered area), noted that snowfalls inJapan seemed to decrease with global warming and that the changes were most marked in Nagaoka.
Concerning the reaction of Japanese snowy areas to global warming, Reference Inoue and YokoyamaInoue and Yokoyama (1998) attempted to estimate future snowfalls, maximum snow depth and snow-cover conditions under global climate change using the climatic data calculated with numerical models.
In Europe, of course, many studies relating to climate change or global warming have been carried out from various points of view (e.g. from the viewpoint of snow-cover duration (Reference Hantel, Ehrendorfer and HaslingerHantel and others, 2000), avalanche hazards (Reference Martin, Giraud, Lejeune and BoudartMartin and others, 2001), winter tourism (Reference Breiling and CharamzaBreiling and Charamza, 1999) and hydrology (Reference Etchevers, Golaz, Habets and NoilhanEtchevers and others, 2002)). This paper focuses on recent snow-depth changes in snowy areas in Japan brought about by the relatively warm winters mentioned above. Fortunately, two datasets were available: one set normalized for the period 1971–2000 from manned surface meteorological observations by the Japan Meteorological Agency (JMA), and the other for the period 1961–90. As the more recent normalized data (which I refer to as “new normals”) cover the recent warmer seasons, comparison with the older normalized data (“old normals”) allows us to clarify the response of the Japanese snow-covered regions to warmer winters.
Datasets and their Characteristics
As mentioned above, the normalized datasets used here cover the different periods. The normal is calculated every 10 years, with the past 30 year averages of meteorological values measured at manned observation sites. The spans of each averaging period are shown in the graph of the annual variation of maximum snow depth during 60 years at Nagaoka (Fig. 1). In the figure we can see that, from 1987 to 2000, less heavy-snow winters occurred, and this period corresponds to about half of the period of the new normals. On the other hand, the period covers only 5 years in the period of the old normals, or one-third of the new normals. Therefore the new normals are thought to be strongly affected by these continuous less-heavy-snow seasons, and the recent changes that occurred in snowy areas in Japan could be found by comparing the two normals.
The averaging periods of the new and old normals and the annual variation of the maximum snow depth at Nagaoka.

In this paper, data from 93 manned meteorological observation sites were used. The sites are located over almost all areas of Japan except non-snowy areas in the south (Fig. 2), but few are located in mountainous regions. Only four sites are located at an altitude of >500m, and only one of these is located at >1000m. Many of the sites are located on plains, where maximum snow depth generally occurs in January or February. Therefore in this analysis the average values of these two months are used, namely the bimonthly average temperature, maximum snow depth, and precipitation amounts during January and February.
Locations of all manned observation sites whose data are used in this work.
Results and Discussion
Recent changes in snowy areas in Japan
The first notable point is that averages of the bimonthly average air temperature during January and February increased at all observation sites, and the increase is 0.4°C on average. We can see that at almost all sites the increases ranged from 0.2° to 0.6°C (Fig. 3). The results suggest that the warmer winter seasons affect air temperatures climatically at all observation sites.
Frequency distribution of the amounts of increase in the bimonthly average air temperature duringJanuary and February at all observation sites.
To examine the influence of the temperature rise on snow covers, we divided the snowy areas into two groups, a cold-climate region and a warm-climate region. The former includes sites belonging to a dry-snow region and depth-hoar region, and the latter includes a wet-snow region and intermediate-snow region (where snow cover is intermediate between dry and wet). This classification was introduced by the author (Reference IshizakaIshizaka, 1998). In the classification, snowy areas are divided by climatic monthly-average temperature in January except for the depth-hoar region. The snowy areas where the average January temperature is <–0.1°C are classified into the dry-snow region, and the areas where it is >0.3°C are classified into the wet-snow region. The areas in between the two temperatures are classified into the intermediate-snow region. Moreover, in the dry-snow region the areas where climatic temperature gradient, which is derived by dividing the absolute value of the climatic monthly mean temperature by the climatic monthly maximum snow depth during January and February, is larger than 15°Cm–1 are classified into the depth-hoar snow region. Therefore the only criterion dividing the cold- and warm-climate regions is temperature, and the critical temperature is –1°C in monthly average temperature in January.
Figure 4a and b show the relationship between the bimonthly average temperature and the monthly maximum snow depth during January and February at the sites belonging to the cold- and the warm-climate regions respectively. In Figure 4b we find that in warm-climate regions the climatic monthly snow depths for all sites where snow depth increased were not so large, at around 0.2 m or less. Compared with each value between the two normals, the amounts of increase were also found to be small, at around 0.01m, with a maximum value of 0.03 m. In the cold-climate region, on the other hand, there were many sites with considerable snow depth where snow depth increased (Fig. 4a). As in the warm-climate region, however, the amounts of increase were not so large: the maximum was 5 cm and there were many values of a few centimeters or less.
Relationship between the bimonthly average air temperature duringJanuary and February and the monthly maximum snow depth in the cold-climate (a) and warm-climate (b) regions. The climatic values of the new normals are used. The sites where snow depth increased from the values of the old normals are indicated with solid triangles, and the other sites with solid circles. The dashed line indicates the boundary between dry-snow region and depth-hoar region (a) and intermediate-snow region and wet-snow region (b).
At almost all sites in the warm-climate region that had considerable snow depth, the bimonthly maximum snow depth decreased. The five sites where the bimonthly maximum snow depth decreased more than 0.1m belong to the warm-climate region. Their location can be seen in Figure 5. We find that the amounts of decrease in snow depth were larger than those of any increase. The five sites are located in the coastal area of the Hokuriku district, where heavy snowfalls are brought by the Siberian monsoon. These areas also belong to the wet-snow region (monthly air temperature in January is >0.3°C). Figure 5 also shows the sites belonging to the wet-snow region in which the snow depth increased. They are located on the Pacific Ocean side (or the inland sea of Japan). The slight increases in snow depth on the Pacific Ocean side and the drastic decreases in the coastal regions facing the Sea of Japan are one of the typical features of recent changes in the snowy areas inJapan.
The locations of the site: (a) where monthly maximum snow depth decreased >0.1m in the wet-snow region; (b) where monthly maximum snow depth increased in the wet-snow region.
Changes might be considered to occur in the unusual atmospheric pressure patterns that come with warmer winters. In the ordinary pressure pattern, winter snowfalls are caused by a cold northwesterly wind from Siberia along the Sea of Japan coast. But in the areas facing the Pacific Ocean it seldom snows, because high mountains running along the central part of theJapan islands prevent snow clouds. In the recent warmer winters, however, unusual pressure patterns have often occurred. In such cases, depressions often pass over/along the southern part of the Japanese islands and bring snow temporarily on the Pacific Ocean side. The snow depth at many sites there was not so large that these temporary snowfalls strongly affected the data for maximum snow depth.
The above is only a hypothesis for explaining the increases in maximum snow depth on the Pacific Ocean side during recent climate changes. Further analysis each winter from a meteorological aspect is required to show what has happened in this period.
Estimation of snow-depth decrease from changes in temperature and precipitation
Here I attempt to estimate the snow-depth changes that occurred in the wet-snow region from air-temperature and precipitation amounts. For this estimation I introduce a relationship between the bimonthly maximum snow depth, bimonthly average temperature and monthly amounts of precipitation in the wet-snow region (Fig. 6). The figure shows the relationship between the ratio of snow depth HS
Relationship between the bimonthly average temperature and the ratio of snow depth to precipitation amounts at the sites in the wet-snow region where monthly snow depth in winter is 510 cm. The square symbols indicate the values of manned observation sites, and others are from AMeDAS.
(m) to precipitation amounts P (mm) and air temperature T (°C) through the averages during January and February at sites where monthly maximum snow depth was >0.1m in any month December–March. To obtain the relationship, data derived from the climatic values observed by the Automated Meteorological Data Acquisition System (AMe-DAS) were added, because the number of manned observation sites in the wet-snow region was insufficient. AMeDAS siteswere located far more densely, and their data were thought to reflect a wider variety of geographical factors, although their averaging period for climatic values was shorter than that of the manned sites. Here I used the 23 year average values from 1979 to 2000 from 89 AMeDAS sites belonging to the wet-snow region, adding these to data from 24 manned observation sites. In the figure we can see almost all the points distribute under the straight line that connects between points 6.0 on the abscissa and 0.006 on the ordinate. The equation that expresses the line takes the form:

The equation indicates that snow depths in this area have their upper limit determined both by air temperature and by precipitation amounts. For estimation, all sites in the wet-snow region where the snow depth decreased >5 cm were selected. There were ten sites in all, which are indicated with their site names in Figure 6. They are located in the coastal areas facing the Sea of Japan (Fig. 7). In Figure 6 their HS/P ratios are found to be distributed near the upper limit (the line). Therefore the changes in the three climatic values of these sites are thought to be restricted by the formula under climatic changes. In a typical case, we can imagine a site where climatic values are located just on the line. If the temperature rose in the course of climatic change, the new HS/P ratio of the site would be expected to be on the line or a little below the line corresponding to the new temperature. Therefore, for estimation purposes, I suggest the hypothesis that the snow depth of the sites near the line changes at the same ratio as the upper limit calculated with the Equation (1) changes. This assumes that snow depth in the wet-snow region decreases as temperature rises, and increases in proportion to precipitation amounts as indicated in Equation (1). The hypothesis is not grounded on widespread evidence, but such a tendency was found statistically in the case of Nagaoka, a city in the wet-snow region that experiences heavy snowfalls, by Reference Nakamura and ShimizuNakamura and Shimizu (1996).
The ten sites in the wet-snow region where snow depth decreased 45 cm.
Adapting the hypothesis to the ten sites considered here, I list all the climatic values in Table 1. The table shows that at all these sites not only did the monthly average temperature increase but also the monthly precipitation amounts decreased. Using Equation (1), we can calculate the upper limit of monthly maximum snow depths, HSmax–old and HSmax–new, from the monthly average temperature and the monthly precipitation amounts in both the old and new normals. Further, we can obtain the expected HSexp on the assumption that the snow depth changes in the same ratio as the upper limit derived from the equation:
The actual and calculated decreases in snow depth at sites where the decrease was 40.05 m, and their bimonthly climatic values in both the old and new normals. The monthly climatic values are averaged duringJanuary and February
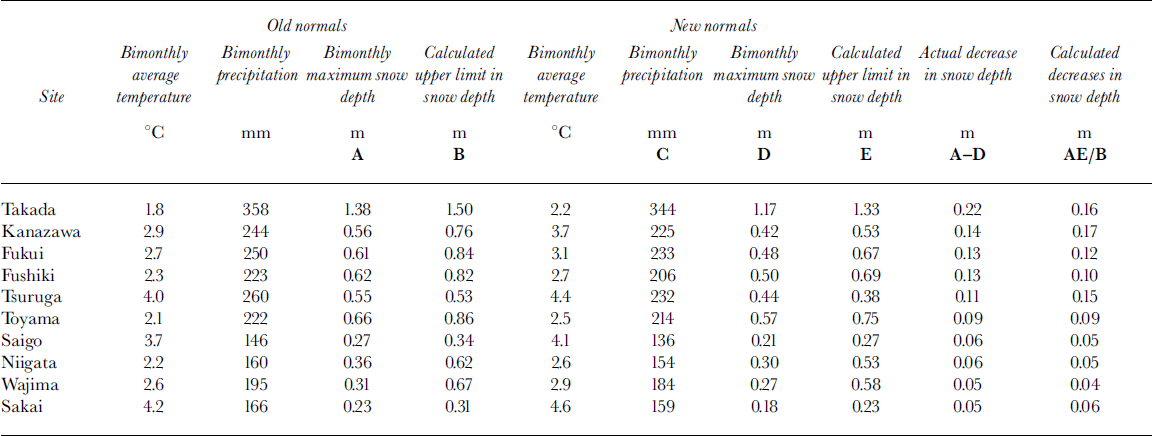

where HSobs is observed values of the site in the old normals. Here the calculated decreases are defined as HSobs– HSexp. The results are shown in the last column in Table 1, together with the calculation procedure. The differences between actual and calculated decreases are shown in Figure 8. Although there are some deviations between them, we can see that the snow-depth decreases can to some extent be explained by temperature rise and decrease in precipitation amounts.
The relationship between the amounts of actual and calculated snow-depth decrease.
Snow depth is one of the familiar elements used to express snow-cover quantities, but it is difficult to predict changes in it even if the average air temperature and precipitation amounts are given, because it is subject to the randomness of snowfalls. On the other hand, common meteorological elements in model predictions for climate changes are air temperature and precipitation amounts in general. Therefore this method is thought to be a useful way of predicting the snow-depth changes expected in heavy-snow areas in the wet-snow region of Japan, which are the snowy areas most sensitive to climatic changes.
Conclusions
In this paper I have examined the climatic response of snowy areas in Japan, investigating the differences in climatic values between two normals, one for 1971–2000 and one for 1961–90, because the former included data for the recent warmer winter seasons and the latter did not. It was found that the warmer winters affected the climatic values in the new normals, and that as a result the monthly average temperature of every observation site had increased in winter. Concerning the bimonthly maximum snow depth, the most marked decreases occurred in the heavy-snowfall areas belonging to the wet-snow region, the coastal areas facing the Sea of Japan in Hokuriku district to San-in district. Moreover, their decreases could be estimated from the rise in temperature and the fall in precipitation amounts, using the relationship between them to some extent. It has been predicted that drastic decreases in the snow depth of these areas will occur in the course of global warming (Reference Inoue and YokoyamaInoue and Yokoyama, 1998). This case could be thought to present a representative example of the studies of climate changes in snowy areas in Japan.
The slight increases in snow depth on the Pacific Ocean side, in contrast to drastic snow-depth decreases in the coastal areas of the Sea of Japan, was another conspicuous finding in this work. But the changes occurring in the cold-climate region were not fully examined here, because there are few data in the normals that represent snow covers in mountainous areas, although a large section of the mountainous snowy areas belongs to the dry-snow region. In the AMeDAS and National Research Institute for Earth Science and Disaster Prevention (NIED) network (Reference Nakamura, Shimizu, Abe and NakamuraNakamura and others, 1997) there are some sites at relatively high altitude, but their observation periods are too short to examine the climatic values. (The AMeDAS observations started in the latter part of the 1970s, and the NIED network’s in 1989.) It has been thought that climatic responses differ with the elevation of the sites through differences in air temperature, as shown in many studies in Europe (Reference Breiling and CharamzaBreiling and Charamza, 1999; Reference Hantel, Ehrendorfer and HaslingerHantel and others, 2000; Reference Martin, Giraud, Lejeune and BoudartMartin and others, 2001). There is some evidence of this tendency in the different responses between the cold- and the warm-climate regions discussed here. But to achieve further fruitful results, more datasets concerning mountainous snow covers and detailed examinations each winter from a meteorological aspect are needed.
Acknowledgements
The author wishes to thank the Japan Meteorological Agency for providing the datasets of climatic values. He also gratefully acknowledges O. Abe of the Shinjo Branch of NIED and R. Meister of the Swiss Federal Institute for Snow and Avalanche Research for helpful suggestions and comments, and scientific editor E. Martin who helped to improve the paper.



