


Introduction
The three main flyway populations of Barnacle Geese Branta leucopsis, the Russian population, the Svalbard population and the East Greenland population have all increased in size during past decades (Fox and Madsen Reference Fox and Madsen2017a; Jensen et al. Reference Jensen, Madsen, Nagy and Lewis2018). The largest of the three flyway populations is the Russian population which has increased from about 20,000 individuals in the winter 1959/1960 to about 1.6 million individuals in February 2024 because of changing agricultural practices at wintering sites and reduced hunting (Boyd Reference Boyd1961; Fox and Madsen Reference Fox and Madsen2017a; Sørensen et al. Reference Sørensen, Germain, Johnson, Baveco, Koffijberg and Madsen2025). Concurrent with the increase and breeding range expansion in the Russian Arctic, new colonies were naturally established in the 1970s and 1980s in the temperate Baltic Sea region (Black et al. Reference Black, Prop and Larsson2014; Feige et al. Reference Feige, van der Jeugd, van der Graaf, Larsson, Leito and Stahl2008; Larsson et al. Reference Larsson, Forslund, Gustafsson and Ebbinge1988). The colonies in the Baltic Sea region were established along the flyway between the main breeding sites in Russia and the wintering sites in northwestern Europe. Somewhat later, in the 1980s and 1990s, breeding colonies were also established at the North Sea coast in the Netherlands and Germany close to the traditional wintering sites (van der Jeugd and Kwak Reference van der Jeugd and Kwak2017).
To better understand the underlying causes behind the development of the Barnacle Goose populations, as well as to address the sustainable use of goose populations and provide for the resolution of various human-goose conflicts, an International Single Species Management Plan for the Barnacle Goose was developed by AEWA (Agreement on the Conservation of African-Eurasian Migratory Waterbirds) in 2018 (Jensen et al. Reference Jensen, Madsen, Nagy and Lewis2018). During the preparation of the management plan, it was recognised that birds breeding in the Russian Arctic, the Baltic Sea region and the North Sea region behave differently in many aspects (Boom et al. Reference Boom, van der Jeugd, Steffani, Nolet, Larsson and Eichhorn2022; de Vries et al. Reference de Vries, Boom, Nolet, Jongejans and van der Jeugd2025; van der Jeugd et al. Reference van der Jeugd, Eichhorn, Litvin, Stahl, Larsson and van der Graaf2009). The so-called Russian flyway population was therefore further divided into three functionally differentiated management units, henceforth called the Russian population, the Baltic population and the North Sea population (Nagy et al. Reference Nagy, Heldbjerg, Jensen, Johnson, Madsen and Therkildsen2021). The three populations mix in winter at the main wintering sites in the Netherlands and Germany.
The first breeding pair in the Baltic Sea region was recorded in 1971 on a small island group named Laus holmar off the east coast of Gotland, Sweden, in the central Baltic Sea (Larsson et al. Reference Larsson, Forslund, Gustafsson and Ebbinge1988). The number of breeding pairs increased rapidly, and the Laus holmar colony reached a peak in the beginning of the 2000s with 2,450 breeding pairs. More colonies were established in the Baltic Sea region in the 1980s and 1990s along the coasts of Gotland and Öland, as well as in mainland Sweden, Estonia, Denmark, Finland and in the Baltic part of Russia (Feige et al. Reference Feige, van der Jeugd, van der Graaf, Larsson, Leito and Stahl2008; Kouzov et al. Reference Kouzov, Zaynagutdinova and Kravchuk2023; Larsson and Forslund Reference Larsson and Forslund1994; Leito Reference Leito1996; Mortensen Reference Mortensen2011; Yrjölä et al. Reference Yrjölä, Holopainen, Pakarinen, Tuoriniemi, Luostarinen and Mikkola-Roos2017). With the aim to study the ecology, behaviour and genetics of Barnacle Geese breeding in the Baltic Sea region, a long-term study was initiated in 1985 on Gotland and Öland and the study has continued with varying intensity since then.
In this paper, the increase and subsequent decline of the breeding population of Barnacle Geese on Gotland and Öland in the central Baltic Sea region during the 55-year period from 1971 to 2025 is described. Several measures of reproductive success, survival and dispersal have been analysed previously during the phase of population increase (Black et al. Reference Black, Prop and Larsson2014; Larsson and Forslund Reference Larsson and Forslund1994; van der Jeugd Reference van der Jeugd2001; van der Jeugd and Larsson Reference van der Jeugd and Larsson1998). A conclusion from earlier studies is that the rapid population increase during the 1980s and 1990s was driven by high breeding success, high survival rates and local recruitment. A previous population model has indicated that net immigration of a few tens of birds most likely occurred from the Arctic Russian population at the end of the 1970s and the beginning of the 1980s (Larsson et al. Reference Larsson, Forslund, Gustafsson and Ebbinge1988). The subsequent population increase, however, was not dependent on net immigration. Previous studies have also shown that density-dependent effects on the production of young became significant when colonies increased in size. The suggested density-dependent mechanism was that social interactions between goose families became more frequent as densities of geese rose on the brood rearing areas which in turn made newly hatched goslings more vulnerable to food stress and gull predation (Larsson and Forslund Reference Larsson and Forslund1994). Thereafter, from the beginning of the 2000s, the breeding population on Gotland and Öland declined very rapidly. In this study, demographic parameters during the period of population decline are therefore also analysed. Of special focus is the effects of predation by the increasing population of White-tailed Eagles Haliaeetus albicilla in the Baltic Sea region (Bregnballe et al. Reference Bregnballe, Tofft, Kotzerka, Lehikoinen, Rusanen and Herrmann2021; HELCOM 2018; Herrmann et al. Reference Herrmann, Krone, Stjernberg and Helander2011).
Methods
The population of Barnacle Geese breeding on Gotland and Öland in the Baltic Sea region were studied in varying intensity between 1971 and 2025. Detailed studies of the behaviour, genetics, reproductive performance and survival of large numbers of individually marked geese, were performed between 1985 and 2013 (Black et al. Reference Black, Prop and Larsson2014). Later, between 2014 and 2025, the studies were less detailed but have included annual surveys of breeding pairs, measurements of clutch sizes, and counts of the number of produced fledged young and moulting adults. The studies of breeding Barnacle Geese on Öland, and studies before 1985 on Gotland, were mainly limited to surveys of breeding pairs. On Gotland, the most detailed studies were performed in the oldest and largest colony situated on a group of three nearby islands collectively named as Laus holmar. The cumulative number of observed breeding attempts in the Laus holmar colony, that is, the sum of yearly numbers of breeding pairs between 1971 and 2025, amounted to approximately 56% of all observed breeding attempts on Gotland. Because of its dominance, the reproductive output of Barnacle Geese breeding in the Laus holmar colony is presented separately from the pooled data from the other colonies on Gotland. All colonies were situated on islands along the coasts of Gotland and Öland.
The number of breeding Barnacle Geese elsewhere in Sweden, that is, outside Gotland and Öland, have been irregularly counted by local ornithologists. These counts have been summarised by Ottosson et al. (Reference Ottosson, Ottvall, Elmberg, Green, Gustafsson and Haas2012) and Ottosson et al. (Reference Ottosson, Wirdheim, Elmberg, Green, Gustafsson and Haas2025). Around 2010, approximately 1,400 pairs bred in Sweden outside Gotland and Öland. In 2025, the corresponding estimated number was approximately 4,000 pairs. The majority of these birds bred in small colonies distributed along the whole Swedish coast and at some inland sites. Reports to the Swedish species observation system Artportalen indicate that Barnacle Geese have produced young at most of these sites. Large colonies comparable to the large colonies present on Gotland and Öland in the 1990s and 2000s have not been established elsewhere in Sweden.
Number of breeding pairs
Annual surveys of breeding pairs, that is, counts of nests or of incubating females, were performed in the middle or second half of May in the Laus holmar colony and on 25 additional nesting islands off the coast of Gotland and on four nesting islands off the coast of Öland. The surveys can be regarded as total surveys of nesting pairs on Gotland and Öland. A few single pairs and small groups of less than ten pairs are known to have bred in some years at six more sites on Gotland and Öland. These six sites were not surveyed in all years. Between 1981 and 1984, the number of breeding pairs in the Laus holmar colony was defined as the maximum number of pairs observed with young during the brood rearing period. The number of nests was probably marginally higher in these years, because some breeding attempts were probably unsuccessful (Larsson et al. Reference Larsson, Forslund, Gustafsson and Ebbinge1988). The four nesting islands on Öland were not surveyed in 2012 and 2014, and a few small colonies were not surveyed on Gotland in all years. In the few years when nest counts were missing, the number of breeding pairs was interpolated based on the numbers counted in the year before and year after.
Clutch sizes
Clutch sizes were recorded during surveys of the nesting islands on Gotland in May. Intra-specific nest parasitism occurs in this species (Anderholm et al. Reference Anderholm, Marshall, van der Jeugd, Waldeck, Larsson and Andersson2009a; Anderholm et al. Reference Anderholm, Waldeck, van der Jeugd, Marshall, Larsson and Andersson2009b, Forslund and Larsson Reference Forslund and Larsson1995, Larsson et al. Reference Larsson, Tegelström and Forslund1995) as well as partial clutch predation by gulls. In this study, clutch size values were not adjusted for intraspecific nest parasitism or partial clutch predation. However, extreme clutches with eight or more eggs, completely depredated nests, and nests with not fully laid clutches, that is, nests without down and with one or two cold eggs that were judged to be newly laid, were excluded in calculations of yearly mean clutch size values.
Number of fledged young and moulting adults
After hatching, families with flightless young were observed at brood-rearing sites along the east coast of Gotland. Number of fledged young was defined as the number of young observed on the day closest to July 20 (within ± 14 days), which is 1–2 weeks prior to fledging. A pair was defined as successful if it produced at least one fledged young. The mean number of fledged young per breeding pair and the mean number of fledged young per successful pair were derived from the counted numbers of nests, observed family sizes and the counted total number of fledged young (for details about methods used up until 1993, see Larsson and Forslund (Reference Larsson and Forslund1994). Between 1997 and 2025, the total numbers of fledged young and moulting adults were counted each year in the middle of July at all important grazing and moulting sites along the eastern coast of Gotland. Between 1994 and 1996 some grazing sites were not surveyed. Estimates of the number of fledged young at these sites were obtained by interpolation based on the number of young counted in 1993 and 1997. The numbers of fledged young and moulting adults were not surveyed along the western coast of Gotland because the number of breeding pairs was low, and available observations suggest that only few adult geese moult along the western coast.
Presence of predators
Breeding Barnacle Geese, especially incubating females, were preyed upon by adult and immature White-tailed Eagles and occasionally by Red Fox Vulpes vulpes. Goose eggs and hatched young were preyed upon by White-tailed Eagle, Herring Gull Larus argentatus, Great Black-backed Gull Larus marinus and Lesser Black-backed Gull Larus fuscus fuscus. Other mammal predators, such as the American Mink Neovison vison, do not occur on the nesting islands. Golden Eagles Aquila chrysaetos breed on Gotland and are capable of killing adult Barnacle Geese but were very rarely observed at the nesting islands. Before the beginning of the 1990s, the White-tailed Eagle was a rare bird in the Baltic Sea region and, hence, was a very rare visitor in the Barnacle Goose colonies. The first breeding pair of White-tailed Eagle was recorded on Gotland in 1998, and the number has since then increased to about 63 occupied breeding territories in 2025 (Per Smitterberg 2025, personal communication). The increase of White-tailed Eagles on Gotland, as well as on Öland (Ottosson et al. Reference Ottosson, Wirdheim, Elmberg, Green, Gustafsson and Haas2025), is in line with the marked increase observed in the whole Baltic Sea region (Bregnballe et al. Reference Bregnballe, Tofft, Kotzerka, Lehikoinen, Rusanen and Herrmann2021; HELCOM 2018; Herrmann et al. Reference Herrmann, Krone, Stjernberg and Helander2011). No management or conservation actions have been directed towards White-tailed Eagles on Gotland and Öland during the study period.
During the surveys of nesting geese in mid-May, the presence of White-tailed Eagles and Red Fox was recorded. The number of White-tailed Eagles that flew off and left the nesting islands when the surveyors arrived was counted. This number should be viewed as an index of the general presence of White-tailed Eagles on the study islands along the coast during the breeding period of Barnacle Geese.
Normally the nesting islands are fox free but, in some years, foxes had reached some of the islands before or during the nesting period. In those years, the presence of foxes was confirmed either by direct observations of foxes, or by observations of footprints, fox scats, or active dens. When a fox is present on a small nesting island many breeding geese, ducks, gulls and waders usually leave, and the island rapidly becomes almost empty of breeding birds. Foxes may inhibit breeding attempts and prey upon many nests of geese and other species, but do not usually kill large number of adult Barnacle Geese.
The number of fresh Barnacle Goose carcasses on the nesting island was counted during the surveys in May. Of all 457 carcasses found since the beginning of the 2000s, 86% were found on islands in years when foxes were not present. Since 2005, almost all (95%) of the 416 observed carcasses were found on islands in years when foxes were not present. The difference is due to one case in 2003 when it was documented that a Red Fox had killed approximately 20 adult geese on one nesting island, and to another case in 2004 when 21 adult geese on another island might have been killed by a Red Fox. Because attacks on incubating Barnacle Geese by immature and adult White-tailed Eagles were observed regularly it is assumed that dead adult Barnacle Geese found after 2004 had been killed and eaten by White-tailed Eagles on the islands in April or May just before or during the incubation period. It should be noted that the number of carcasses found should be regarded as a minimum number of the true number of killed adult Barnacle Geese because birds killed during the later part of the incubation period, that is, after the conducted surveys, and adults killed after hatching when rearing broods, were not detected.
Diseases
No major outbreaks of diseases on the nesting islands affecting Barnacle Geese have been recorded during the study period. Highly pathogenic avian influenza (HPAI) has killed large numbers of Barnacle Geese at wintering sites in northwestern Europe since the winter 2020/2021 (Caliendo et al. Reference Caliendo, Kleyheeg, Beerens, Camphuysen, Cazemier and Elbers2024; Griffin and Peach Reference Griffin and Peach2024; Sørensen et al. Reference Sørensen, Germain, Johnson, Baveco, Koffijberg and Madsen2025). Migrating Barnacle Geese have also been killed by avian influenza on staging sites on Gotland. However, Sørensen et al. (Reference Sørensen, Germain, Johnson, Baveco, Koffijberg and Madsen2025) concluded that there was no indication that HPAI had resulted in considerable declines in the Russian population. Furthermore, there are no signs that avian influenza outbreaks at wintering or staging sites, where the Baltic and Russian populations are mixed, have specifically affected the number of geese breeding on Gotland in any significant negative way since 2021. Actually, the number of breeding pairs on Gotland was slightly higher in 2021 after the first influenza outbreak than in 2020. Possible minor effects of diseases and are not further analysed in this study.
Hunting
Limited hunting on Barnacle Geese has been allowed on Gotland in spring to reduce crop damage. Between 2000 and 2017 about 170 individuals were shot on average each year on Gotland (Gotland County Administrative Board 2026, personal communication). From 2018 onwards the numbers shot are unknown, although likely to be similar numbers. Because the spring hunting on Gotland has been carried out on agricultural fields at a time when most Baltic breeding geese already are on their nesting islands, the hunting pressure has, in reality, been directed mainly towards spring-staging birds belonging to the Arctic breeding Russian population. Possible effects of spring hunting on Gotland on the development of the Barnacle Goose population breeding on Gotland are therefore assumed to be small or negligible and are not further considered. Because the recent level of hunting and derogation killing during autumn and winter at the wintering sites have not stopped the increase of the Russian population (Sørensen et al. Reference Sørensen, Germain, Johnson, Baveco, Koffijberg and Madsen2025), it is unlikely that hunting and derogation killing during autumn and winter at the common wintering sites have specifically affected the breeding population on Gotland and Öland in a significant negative way. Possible minor effects of hunting and derogation killing are not further analysed in this study.
Population model and descriptions of input values
An age-structured population model was used to analyse if the observed rapid decline of breeding pairs in the colonies on Gotland since the middle of the 2000s could be explained solely by the observed low production of fledged young or if decreased survival rates and increased dispersal rates rather caused the decline. The observed yearly numbers of breeding pairs (set equal to the number of breeding females), and the produced number of fledged female young together with alternative sets of adult survival rates and natal dispersal rates of females, were used as input values to the population model. The modelled trajectories of the number of breeding pairs over the study period were thereafter compared to the observed numbers of breeding pairs. Because Barnacle Geese are monogamous and females are the more philopatric sex, the modelling only considered the female part of the population. The sex ratio of observed fledged young was assumed equal.
Annual survival rates of adult females (Sa), here defined as survival rates of one-year old or older birds, have previously been estimated from data obtained between 1984 and 1997, that is, during the phase of population increase (Larsson et al. Reference Larsson, van der Jeugd, van der Veen and Forslund1998). In total, 111,431 winter re-sightings of 2,336 marked birds from volunteer ring readers in The Netherlands and Germany were analysed. The adult female annual survival rate was found to be on average 95.9%.
Annual post-fledging survival rates, that is, survival from fledging to the start of the first winter have been estimated using data from 1,302 geese marked as juveniles in the study population between 1984 and 1993, also during the phase of population increase (van der Jeugd and Larsson Reference van der Jeugd and Larsson1998). Post-fledging survival rates did not differ between the sexes and was found to be on average 92%. The survival rate of juveniles (Sj), that is, survival rate from fledging until the next summer could then be estimated to, on average, 89.2% under the assumption that the daily survival rate during the period from the first winter to the next summer was equal to the daily adult female survival rate (van der Jeugd and Larsson Reference van der Jeugd and Larsson1998).
Natal dispersal rates (Dn), that is, the permanent movement from the site of birth to the site of first breeding, were estimated in the oldest colony by using data from 1984 to 1998 and was found to be on average 20% in females (van der Jeugd and Larsson Reference van der Jeugd, Larsson and van der Jeugd1999). During that period, the dispersing females from the oldest colony mainly recruited into other colonies on Gotland and Öland. In a later study, it was found that long-range natal dispersal of females from several colonies in the Baltic Sea region, that is, not only from colonies on Gotland and Öland, to the Arctic Russian population or to the North Sea population has been very low, only about 1.2% (de Vries et al. Reference de Vries, Boom, Nolet, Jongejans and van der Jeugd2025). In the further modelling the input values chosen for natal dispersal rate (Dn) represent the proportion of the surviving one-year old females that permanently left their natal colonies on Gotland and recruited either to other colonies in the Baltic Sea region or to colonies in the Russian Arctic or in the North Sea region.
Breeding dispersal, that is, the movements of adults between successive breeding sites, may reduce the observed number of breeding pairs, and resemble effects of adult mortality, if the movements lead to permanent emigration from the study area. However, the available information indicates that the frequency of breeding dispersal of adult females is very low. For example, de Vries et al. (Reference de Vries, Boom, Nolet, Jongejans and van der Jeugd2025) estimated that only about 0.05% of adult females in ringed in the Baltic region, including birds ringed on Gotland and Öland between 1984 and 2007, emigrated to the Arctic Russian population, and only about 0.06% to the North Sea population. As a complimentary analysis, a sample of 667 adult females ringed with engraved colour leg rings and 334 adult females ringed with steel rings on Gotland before 2000 and observed on Gotland in 2002 or later, was analysed. Only three adult females of this sample of 1,001 adult females that were known to be alive on Gotland in 2002 were reported from sites outside Gotland and Öland during summer months between 2003 and 2025. Observations of ringed Barnacle Geese outside Gotland and Öland were collected by European Colour-Ring Birding (https://cr-birding.org/) and the Ringing Centre at the Swedish Museum of Natural History. Taken together, the information indicates that permanent emigration of adult females from Gotland and Öland may occur, but at a very low rate. There was no sign that permanent emigration of adult females increased substantially during the phase of population decline. In the further modelling the frequency of permanent emigration of adult females to sites outside Gotland and Öland was set to zero. The very low rate of permanent emigration of adult females that may exist is considered as an extra adult female mortality rate.
The proportion of two-, three-, and four- or more-year old females that breed was set to 0.2, 0.5 and 1, respectively (derived from van der Jeugd and Larsson Reference van der Jeugd, Larsson and van der Jeugd1999). One-year old females do not breed.
The number of one-year old (N1), two-year old (N2), three-year old (N3), and four- or more-year old (N4+) females in specific years up to year 2025 were calculated from the numbers of females in preceding years. Thus, N1t+1, was calculated as the observed number of females fledged young in year t * Sj * 0.8. The sex ratio of the observed fledged young was assumed equal. N2t+1 and N3t+1 was calculated as N1t * Sa, and N2t * Sa, respectively. N4+t+1 was calculated as (N3t + N4+t) *Sa.
The modelled number of breeding pairs (set equal to the number of breeding females) in year t+1 was calculated as (N2t+1 * 0.2) + (N3t+1 * 0.5) + (N4+t+1). The starting point for the population model was set to 451 breeding pairs in 1985 (Larsson et al. Reference Larsson, Forslund, Gustafsson and Ebbinge1988). Alternative sets of adult survival rates (Sa) and natal dispersal rates (Dn) were used as input values to the population model to visualise effects of hypothesised reduced adult survival rates and increased natal dispersal rates on the population development since the beginning of the 2000s.
Alternative 1: Sa was set to 0.959, Sj was set to 0.892 and Dn was set to 0.2 and were held constant during the whole studied period up to 2025. The chosen survival rates represent mean values previously estimated in the study population during the phase of increase.
Alternative 2, Sa was set to 0.959 up to 2001 and thereafter to 0.90 representing a moderate decline in adult female survival rate. Sj and Dn was set as in alternative 1 and were held constant during the whole studied period up to 2025.
Alternative 3, Sa was set to 0.959 up to 2001 and thereafter to 0.90 as in alternative 2. Dn was set to 0.2 up to 2001 and thereafter to 0.8 representing a very strong increase in female natal dispersal rate. Sj was set as in alternative 1
Alternative 4, Sa was set to 0.959 up to year 2001 and thereafter successively reduced to 0.75 in a way which resulted in a modelled population trajectory resembling the observed decline of the number of breeding pairs up to year 2025. Sj and Dn was set as in alternative 1 and were held constant during the whole studied period up to 2025.
Results
Number breeding pairs and number of colonies
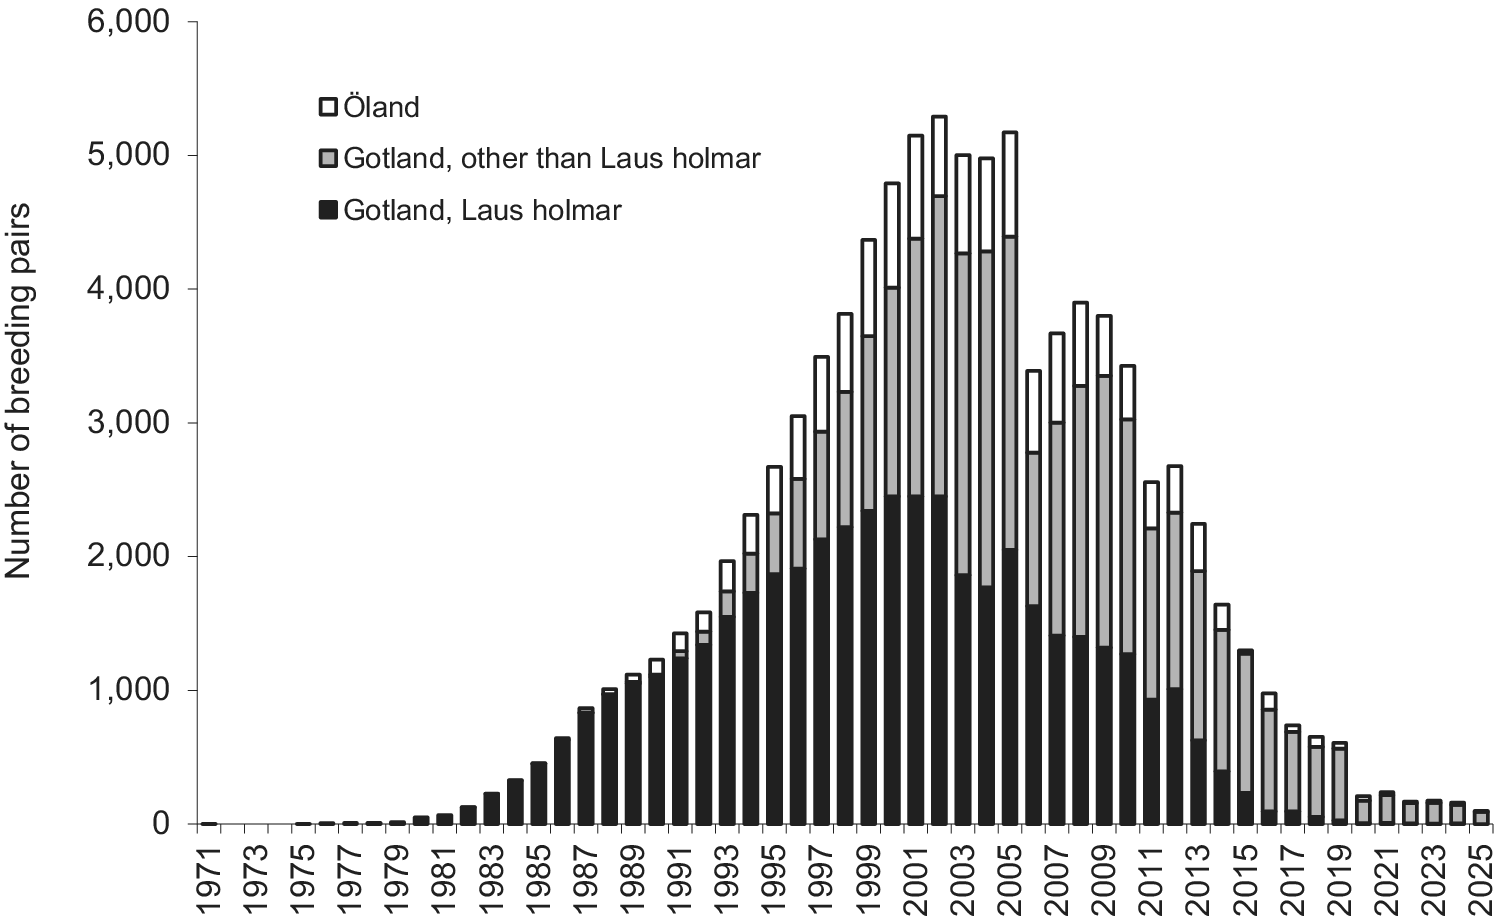
The first breeding attempt of Barnacle Geese in the Baltic Sea region was recorded in 1971. Thereafter, the total number of breeding pairs in colonies along the coasts of Gotland and Öland increased rapidly and reached c.5,290 breeding pairs in 2002 (Figure 1). The growth rate during the increase phase levelled off when numbers rose. Between 1971 and 1986, the average annual growth rate was c.54% and between 1987 and 2002 c.13%. Thereafter the total number of breeding pairs decreased rapidly and in 2025 only c.100 breeding pairs were recorded.
Number of breeding pairs of Barnacle Geese in colonies on Gotland and Öland, Sweden, between 1971 and 2025. The number of breeding pairs in the oldest colony on Laus holmar, Gotland, is shown separately.

Figure 1. Long description
A stacked bar chart with the Y-axis labeled Number of breeding pairs ranging from 0 to 6,000 and the X-axis showing years from 1971 to 2025 in two-year increments.
Data Categories (Bottom to Top):
* Black bars: Gotland, Laus holmar.
* Grey bars: Gotland, other than Laus holmar.
* White bars: Öland.
Trend Analysis:
* 1971 to 1980: Population is near zero.
* 1981 to 1997: Rapid exponential growth driven almost entirely by the Laus holmar colony (black bars), reaching approximately 2,000 pairs.
* 1998 to 2005: The total population peaks, fluctuating between 4,500 and 5,300 pairs. During this period, the other Gotland colonies (grey) and Öland (white) begin to contribute significantly to the total.
* 2006 to 2025: A consistent downward trend. By 2015, the Laus holmar colony (black) has nearly disappeared, while other Gotland colonies (grey) become the primary remaining population. By 2025, the total number of pairs across all regions falls below 200.
The number of colonies on Gotland and Öland also increased during the study period (Figure 2). During the 1970s only the oldest colony on Laus holmar on the east coast of Gotland existed. The first colony on Öland was established in 1982. In the late 1980s some additional colonies were established and in 1990 there were three colonies on Gotland and two on Öland. In 2000, the number of colonies had increased to 12 on Gotland and to three on Öland. Although the number of breeding pairs decreased rapidly from the beginning of the 2000s onwards, the number of colonies continued to increase, and in 2010 there were 22 colonies on Gotland and four on Öland. Thereafter, the number of colonies remained almost the same. In 2025, c.100 breeding pairs were spread out on 20 nesting islands where they bred solitarily or in very small colonies. The overall development pattern of the colonies over the study period, that is, initial rapid increases of the number of breeding pairs, albeit with a certain time lag, which were followed by declines to only a few or to zero breeding pairs per colony from 2020 onwards, was repeated in almost all colonies (Supplementary material Figure S1).
Location of Barnacle Geese colonies between 1971 and 2025. Clusters of colonies are indicated, (A) Laus holmar, Gotland (B) Eastern Öland, (C) Southeastern Gotland, (D) Eastern Gotland, (E) Northeastern Gotland, (F) Western Gotland.

Figure 2. Long description
A multi-panel figure containing six maps of the Baltic Sea region featuring the islands of Gotland and Öland. A North arrow and a 20 kilometer scale bar are provided in the first panel.
* Panel 1 (1971-1980): A single colony is visible on the Southeast coast of Gotland.
* Panel 2 (1990): Colonies appear on the Southern tip of Öland and increase to three sites on the Southeast coast of Gotland.
* Panel 3 (2000): Colonies expand further North along the East coast of Gotland and one site appears on the West coast.
* Panel 4 (2010): Significant expansion occurs with numerous colonies lining the entire East coast of Gotland, several on the West coast, and a cluster on the Southern half of Öland.
* Panel 5 (2020): The density of colonies remains high along the coastlines of both islands.
* Panel 6 (1971-2025 All sites): This summary map uses brackets to categorize the clusters. Cluster B is located on Southern Öland. Cluster F is on Western Gotland. Cluster C is on Southeastern Gotland. Cluster A is Laus holmar on the central East coast of Gotland. Cluster D is Eastern Gotland, and Cluster E is Northeastern Gotland.
Clutch size
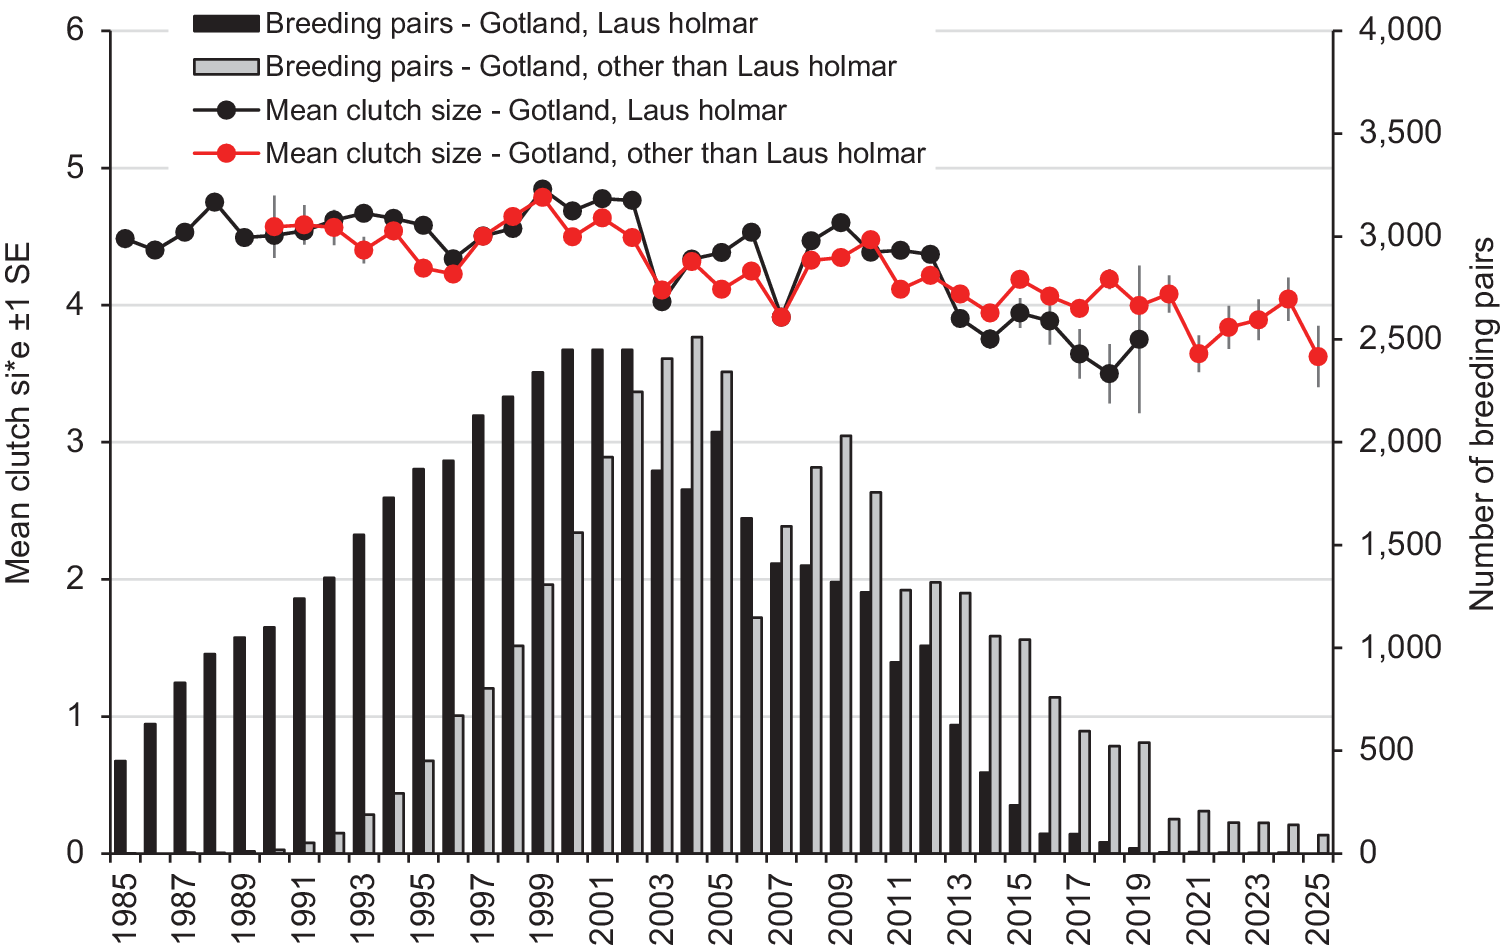
Mean clutch sizes values varied among years and declined slightly over the study period (Figure 3). The decline was observed both in the Laus holmar colony (r = -0.70, n = 35 years, P < 0.001) and in other colonies on Gotland (r = -0.81, n = 36 years, P < 0.001). The declining trend was only evident during the phase of population decline in the later part of the study period.
Number of breeding pairs and mean egg clutch size ± 1 standard error in the colony on Laus holmar and in other colonies on Gotland between 1985 and 2025. Standard errors are in most years smaller than size of symbols. Yearly values and sample sizes are shown in Supplementary material Table S1.

Figure 3. Long description
The horizontal X axis represents years from 1985 to 2025. The left Y axis measures Mean clutch size plus or minus 1 S E from 0 to 6. The right Y axis measures Number of breeding pairs from 0 to 4,000.
Legend at the top identifies four data series
- Black bars: Breeding pairs - Gotland, Laus holmar.
- Grey bars: Breeding pairs - Gotland, other than Laus holmar.
- Black line with circles: Mean clutch size - Gotland, Laus holmar.
- Red line with circles: Mean clutch size - Gotland, other than Laus holmar.
Data Trends
- Breeding Pairs: Laus holmar (black bars) shows a bell-shaped curve, rising from near zero in 1985 to a peak of approximately 2,500 pairs around 2001, then declining steadily to near zero by 2020. Other colonies (grey bars) begin appearing in the early 1990s, peak later around 2004 at approximately 2,500 pairs, and maintain higher numbers than Laus holmar through the 2010s before also declining.
- Clutch Size: Both colonies start with a mean clutch size between 4 and 5. The Laus holmar colony (black line) shows a significant downward trend starting after 2002, dropping below 4 by 2013 and reaching approximately 3.5 by 2019. The other colonies (red line) maintain a more stable clutch size, fluctuating around 4.0 to 4.5 through 2025, though showing a slight overall decline from the 1990s peak.
The yearly mean clutch size values observed in the oldest Laus holmar colony and in the later established colonies on Gotland were significantly correlated (r = 0.82, n = 30 years, P < 0.001) which indicate that the short-term year-to-year variation was related to density independent environmental factors which in a similar way affected the spring condition and egg laying capacity of geese breeding in a larger region. Mean clutch size values were not negatively correlated with the number of breeding pairs in colonies, which would have been expected if clutch size was affected by density dependent processes at the breeding sites.
Number of fledged young
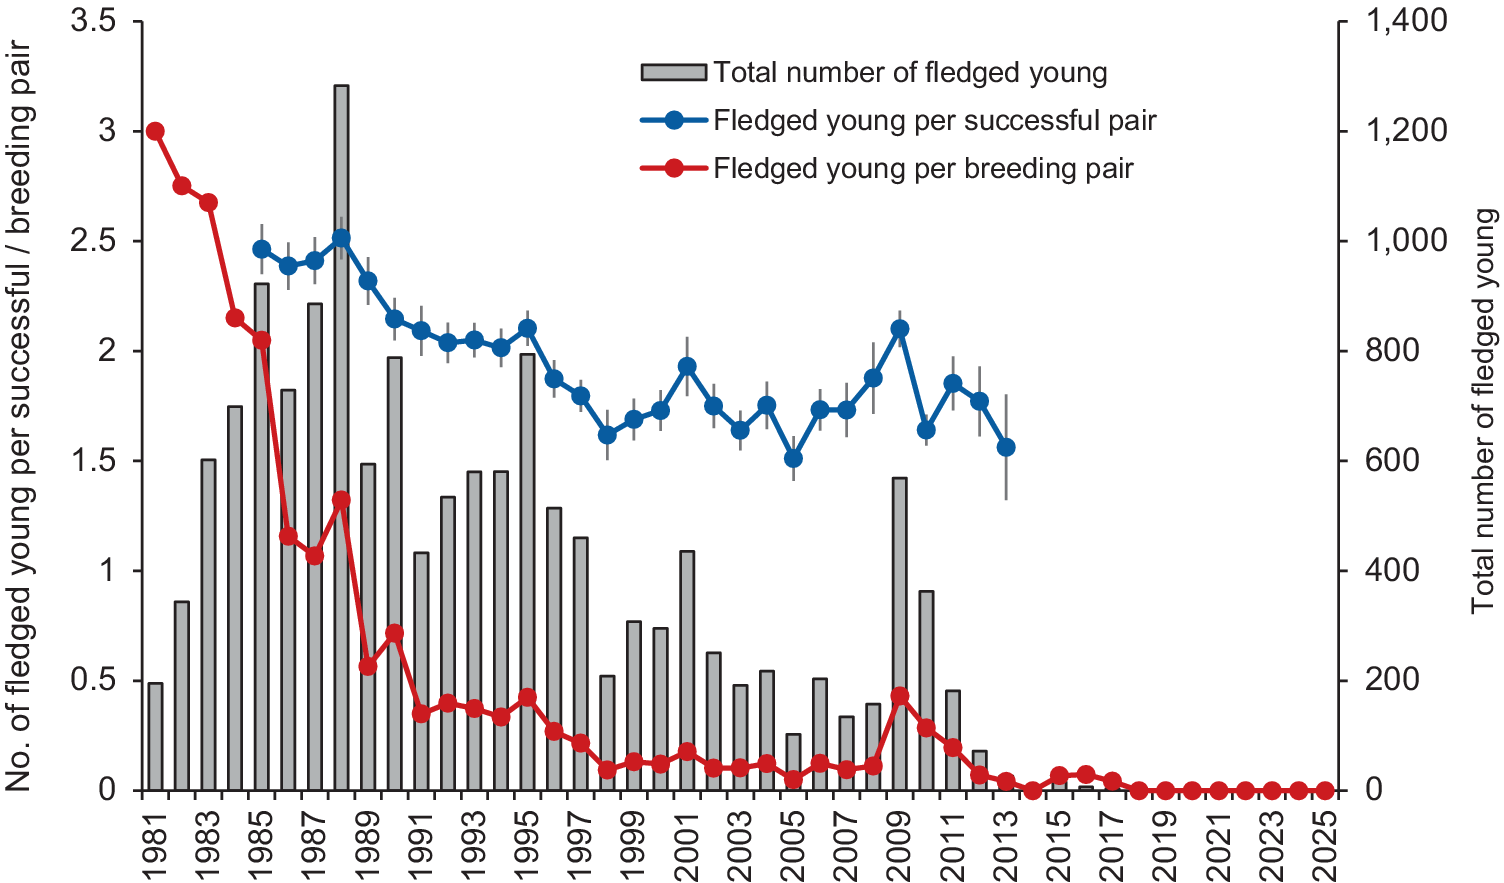
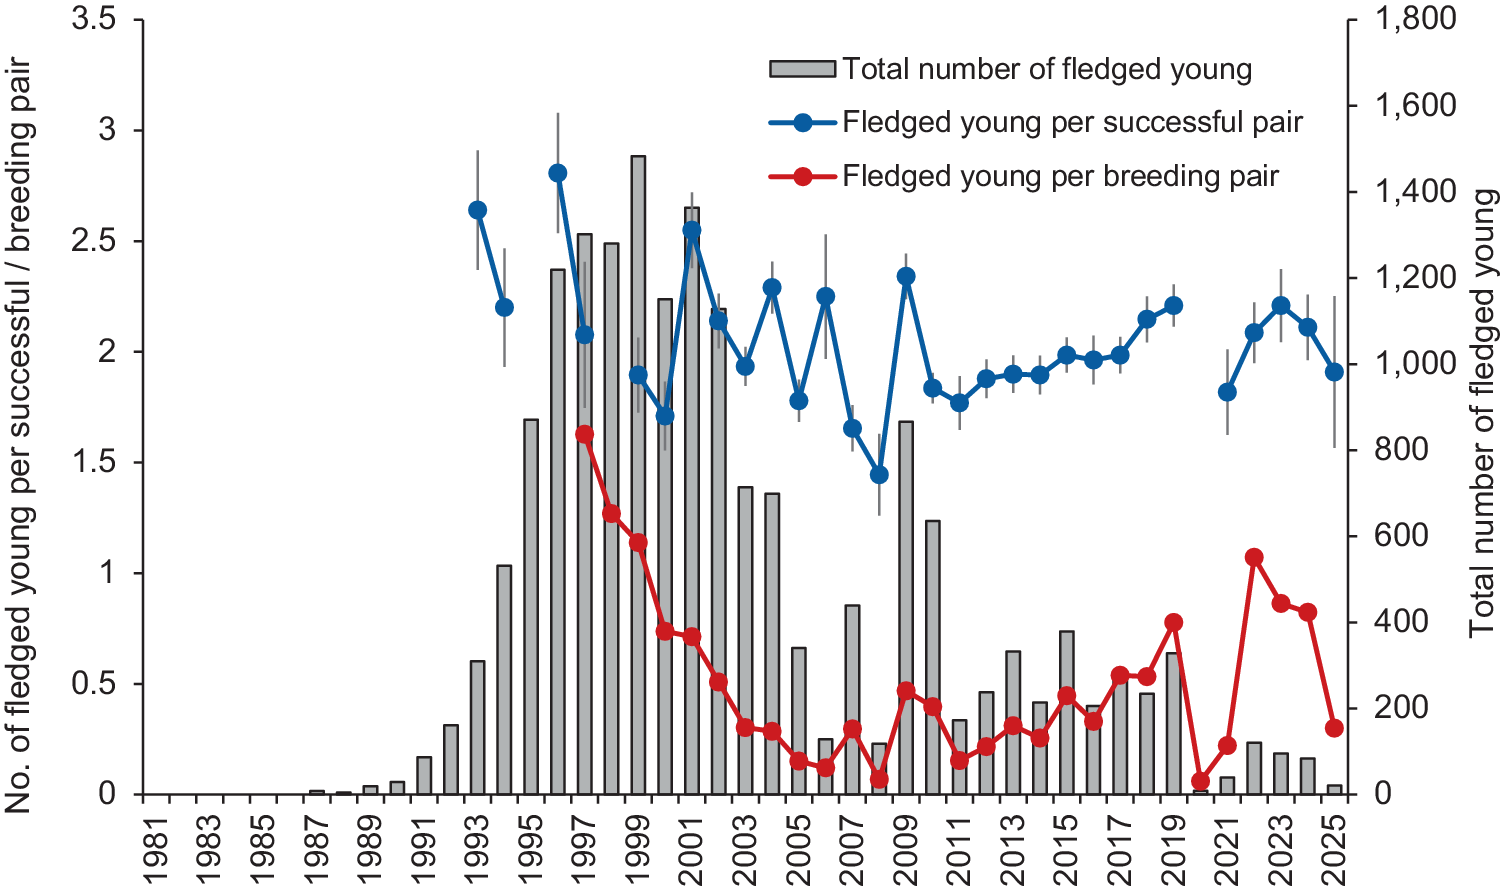
After an initial increase, the yearly total numbers of fledged young in the Laus holmar colony as well as in other younger colonies along the eastern coast of Gotland declined over the study period (Figures 4 and 5). In the Laus holmar colony, the mean number of fledged young per breeding pair declined markedly in a density-dependent way from about 3.0 fledged young per breeding pair in 1981 to about 0.1 fledged young per breeding pair in 2002. From 2003 onwards, except in 2009 and 2010, the number of fledged young per breeding pair remained low. From 2018 no fledged young at all was produced in the Laus holmar colony (Figure 4). In the other later established colonies on Gotland a similar decline was observed, from about 1.6 fledged young per breeding pair in 1997 to about 0.5 in 2002. From 2003 onwards the number of fledged young per breeding pair fluctuated around 0.4 (Figure 5).
Total number of fledged young, fledged young per breeding pair, and fledged young per successful pair ± 1 standard error, in the colony on Laus holmar. Yearly values and sample sizes are shown in Supplementary material Table S2.

Figure 4. Long description
The X axis represents years from 1981 to 2025. The primary Y axis on the left measures the number of fledged young per successful or breeding pair from 0 to 3.5. The secondary Y axis on the right measures the total number of fledged young from 0 to 1,400.
* Total number of fledged young (grey bars): Values fluctuate significantly between 1981 and 1995, peaking at approximately 1,300 in 1988. After 1995, there is a steady decline with a minor spike in 2009, eventually reaching zero by 2014 and remaining there through 2025.
* Fledged young per successful pair (blue line with circles): This series begins in 1985 at approximately 2.5. It shows a gradual downward trend with fluctuations, ending at approximately 1.6 in 2013. Data for this series is absent after 2013.
* Fledged young per breeding pair (red line with circles): This series starts at 3.0 in 1981 and shows a sharp, near-linear decrease until 1998, where it drops below 0.5. It remains near zero from 2014 to 2025.
Vertical error bars representing plus or minus 1 standard error are present on both the blue and red line data points.
Total number of fledged young, fledged young per breeding pair, and fledged young per successful pair ± 1 standard error, in the colonies along the eastern coast of Gotland other than the Laus holmar colony. Yearly values and sample sizes are shown in Supplementary material Table S2.

Figure 5. Long description
The graph uses a horizontal X-axis representing years from 1981 to 2025. The left Y-axis measures the number of fledged young per successful or breeding pair from 0 to 3.5. The right Y-axis measures the total number of fledged young from 0 to 1,800.
* Total number of fledged young: Represented by grey vertical bars. The population remains near zero until 1987, then shows a rapid exponential increase peaking at approximately 1,500 in 1999. Following the peak, there is a steady decline with fluctuations, dropping below 200 by 2025.
* Fledged young per successful pair: Represented by a blue line with circular markers and vertical error bars. Data begins in 1993 at approximately 2.6. It fluctuates between 1.5 and 2.8 throughout the period, showing a slight downward trend until 2008 before stabilizing between 1.8 and 2.3.
* Fledged young per breeding pair: Represented by a red line with circular markers. Data begins in 1997 at approximately 1.6. It shows a sharp decline until 2005, reaching a low near 0.1. It remains low with minor peaks, including a notable spike to approximately 1.1 in 2022, before dropping again toward 2025.
Vertical error bars representing plus or minus 1 standard error are present on both line graphs.
The mean number of fledged young per successful pair, that is, the mean number of young in families with at least one young, in the Laus holmar colony varied among years and decreased slightly from about 2.5 in 1985 to about 1.6 in 2013 (r = -0.78, n = 29 years, P <0.001). In the other colonies on Gotland the mean number of fledged young per successful pair fluctuated around 2.0 (r = -0.30, n = 30 years, NS). Because the decrease of the number of fledged young per successful pair was only slight, the observed marked decline of the production of fledged young per breeding pair was mainly due to an increase of the proportion of the breeding attempts that were unsuccessful, that is, did not produce any young at all.
Number of adults
The number of adult birds present on Gotland during summer was obtained from counts of the number of breeding pairs in May and from counts in July. On Gotland, the only period when it is feasible to directly count adult birds belonging to the Baltic population is during the wing moult in the middle of July when flightless birds aggregate at relative few moulting sites along the coast. Counts of breeding pairs do not include non-breeding one-year olds and other young and older non-breeders. On the other hand, counts during the moulting period do not include those non- and failed breeders which may have performed moult migrations, and hence, moulted in other temperate or Arctic regions.
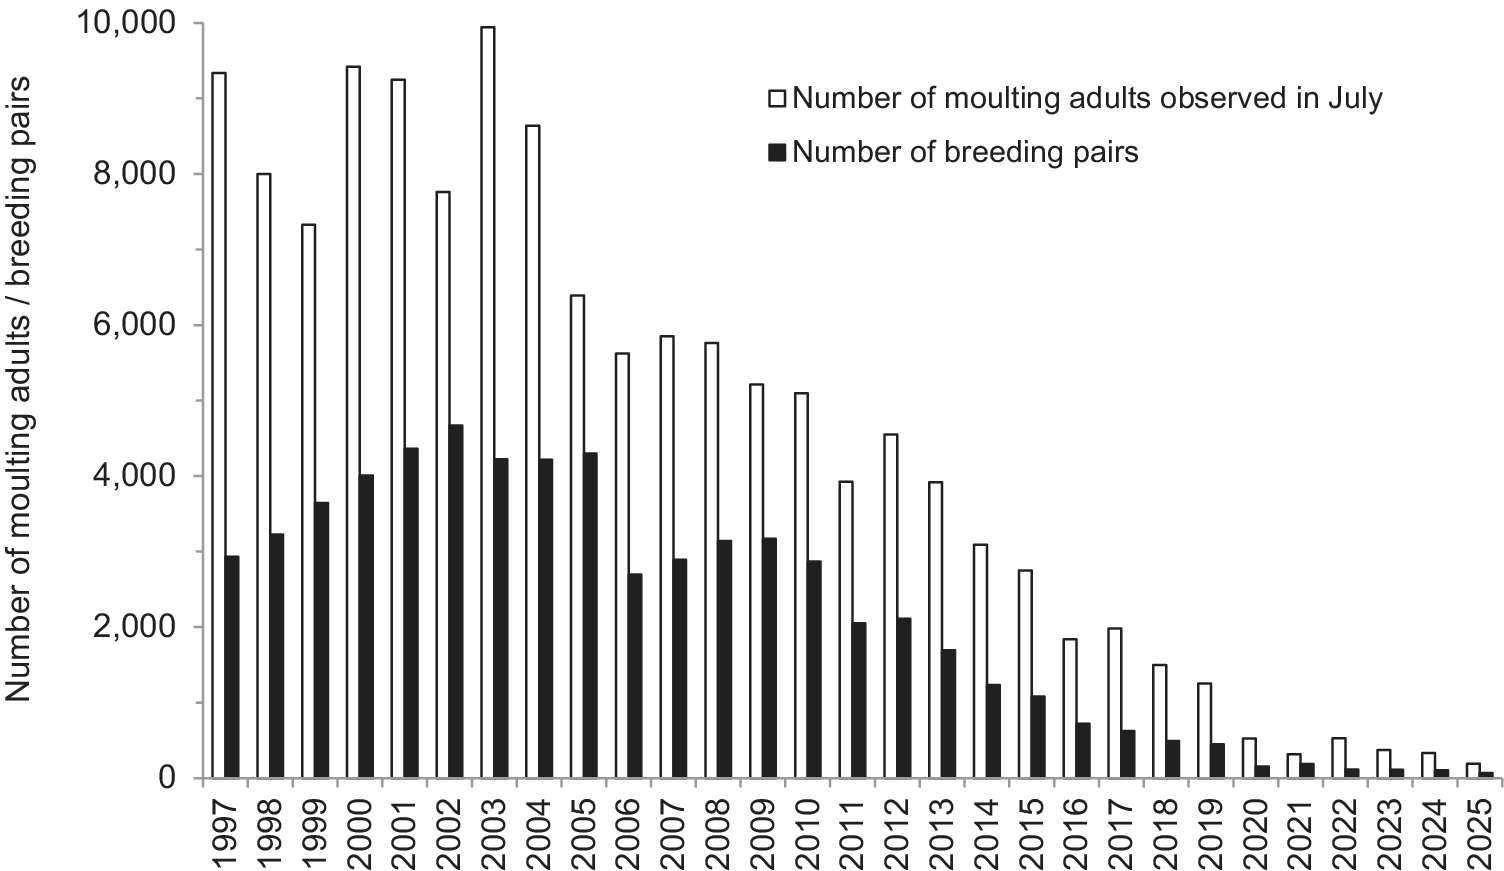
During the population decline phase from 2002 onwards, the numbers of moulting adults in July and the numbers of breeding pairs declined in a similar way, and numbers were highly correlated (r=0.97, n=24 years, p<0.001) which indicates that the marked decline of breeding pairs was not an effect of a major decline in breeding propensity of adult stationary individuals (Figure 6).
Number of moulting adult Barnacle Geese observed at moulting sites in July, and the total number of breeding pairs along the eastern coast of Gotland between 1997 and 2025.

Figure 6. Long description
A grouped bar chart with the y-axis labeled Number of moulting adults / breeding pairs ranging from 0 to 10,000 in increments of 2,000. The x-axis lists years from 1997 to 2025. A legend in the top right identifies white bars as Number of moulting adults observed in July and black bars as Number of breeding pairs.
* From 1997 to 2002, the number of moulting adults fluctuates at high levels between 7,500 and 10,000, while breeding pairs show a steady increase from approximately 3,000 to nearly 5,000.
* Starting in 2003, both populations begin a long-term decline. Moulting adults drop from nearly 10,000 in 2003 to approximately 5,000 by 2010.
* Between 2011 and 2019, the decline continues more steeply. By 2019, moulting adults are below 2,000 and breeding pairs are below 1,000.
* From 2020 to 2025, the populations reach their lowest points, with both metrics appearing near zero on the scale by the final year.
Predation by Red Fox
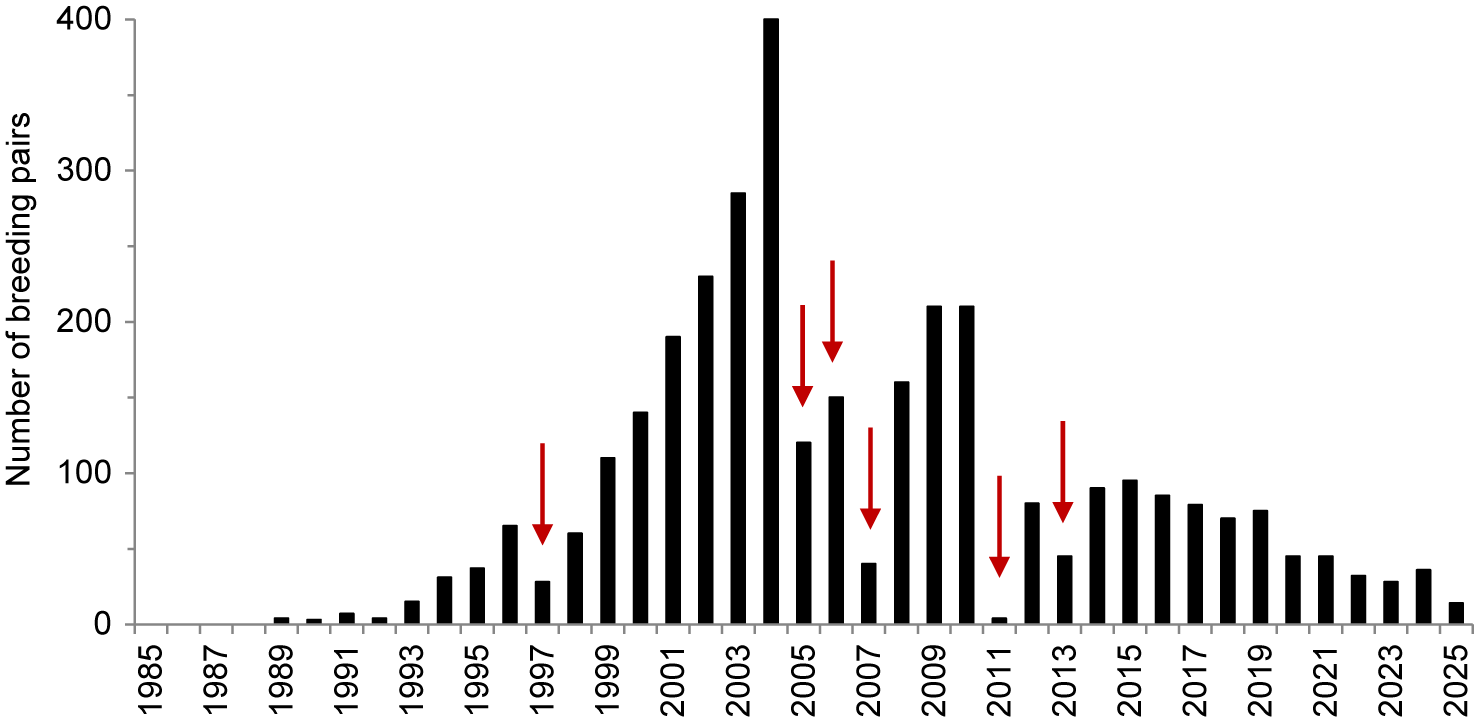
Presence of Red Fox on the nesting islands during the incubation period in the middle of May was recorded on 31 occasions on eight different islands between 1985 and 2025. Some nesting islands close the coast were affected by fox predation during several years (Figure 7). The effect of fox presence on breeding Barnacle Geese and other breeding waterfowl on the specific island was in most cases dramatic, especially on small nesting islands, or when several foxes were present. The most common response of the Barnacle Geese was to halt nest building and egg laying, or terminate incubation before hatching, and leave the affected island. If a nesting island was affected by the presence of Red Fox in only one or a few years, the number of breeding pairs usually partially recovered in the first subsequent fox-free year (Figure 7). Thus, many of the Barnacle Geese returned in following fox-free years to breed on the island where they bred previously. Although the presence of Red Fox had large effects on the specific colonies in years when affected, significant effects on the total number of breeding pairs on Gotland was only observed in a few years (Figure 8).
Number of breeding pairs of Barnacle Geese in a colony on northeastern Gotland where Red Fox was present during six years (indicated by red arrows).

Figure 7. Long description
The Y axis is labeled Number of breeding pairs and ranges from 0 to 400 in increments of 100. The X axis represents years from 1985 to 2025 in two-year increments.
Data trends:
* From 1989 to 2004, there is a steady, near-exponential increase in breeding pairs, peaking at 400 in 2004.
* In 2005, a red arrow points to a sharp drop to approximately 120 pairs.
* In 2006, the population recovers slightly to 150, marked by another red arrow.
* In 2007, a red arrow points to a significant drop to roughly 40 pairs.
* From 2008 to 2010, the population recovers to a secondary peak of 210 pairs.
* In 2011, a red arrow points to a near-total collapse, with pairs dropping to approximately 5.
* In 2013, a red arrow points to a bar at roughly 45 pairs.
* Following 2015, the population shows a gradual, linear decline, reaching approximately 15 pairs by 2025.
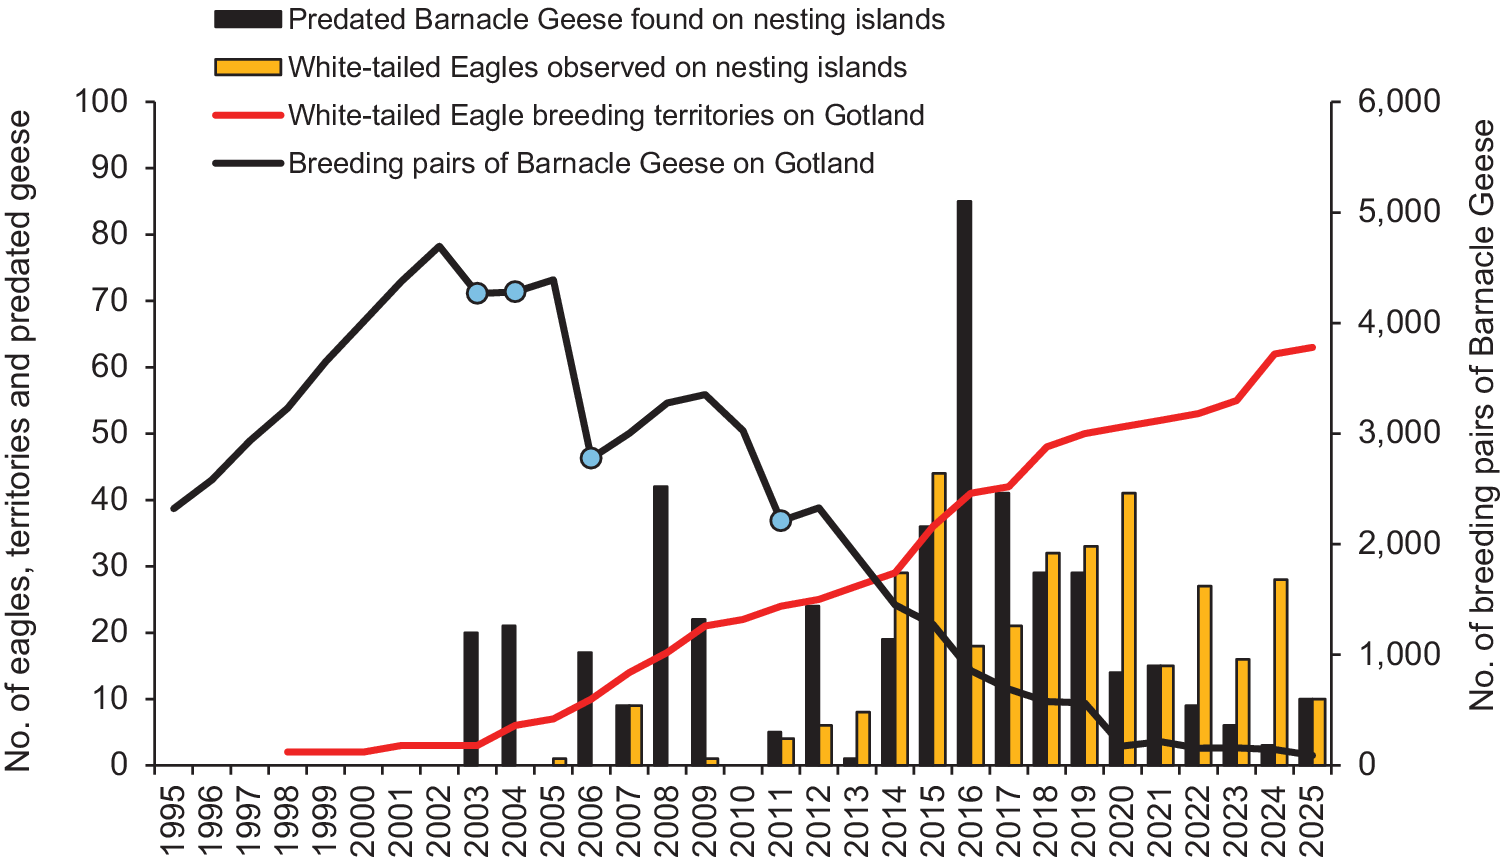
Number of observed White-tailed Eagles (yellow bars), and number of predated adult Barnacle Geese found (black bars), on the nesting islands when surveyed once each year in the middle of May. The number of White-tailed Eagle breeding territories on Gotland is indicated by a red line and the number of breeding pairs of Barnacle Geese on Gotland by a black line. Blue dots indicate years when the presence of Red Fox in two large colonies markedly affected the total number of breeding pairs. Yearly data on White-tailed Eagle breeding territories on Gotland is provided by Per Smitterberg (2025, personal communication).

Figure 8. Long description
The x-axis represents years from 1995 to 2025. The left y-axis measures the number of eagles, territories, and predated geese (0 to 100). The right y-axis measures the number of breeding pairs of Barnacle Geese (0 to 6,000).
* Barnacle Goose Breeding Pairs (Black Line): Starts at approximately 2,300 in 1995, peaks near 4,700 in 2002, then undergoes a sharp decline with fluctuations. Blue dots in 2003, 2004, 2006, and 2011 mark years where Red Fox presence affected the colony. By 2025, the population drops to near zero.
* White-tailed Eagle Breeding Territories (Red Line): Begins in 1998 at near zero and shows a steady, near-linear increase, reaching over 60 territories by 2025.
* Predated Barnacle Geese (Black Bars): First recorded in 2003. Predation remains sporadic until 2014, with a massive spike in 2016 reaching 85 geese, followed by consistent predation between 10 and 40 geese annually through 2025.
* White-tailed Eagles Observed (Yellow Bars): Observations begin in 2005. Numbers remain low until 2014, then fluctuate significantly, peaking at 44 in 2015 and 41 in 2021, with 10 observed in 2025.
Predation by White-tailed Eagles
The number of White-tailed Eagles observed at the nesting islands on Gotland in the middle of May, when incubating geese were surveyed, increased from the beginning of the 2000s and became especially high from 2014 and onwards. The number of fresh Barnacle Geese carcasses found on the nesting islands during the same yearly surveys also increased from 2003. As the number of breeding pairs decreased, the relative importance of predation, expressed as the ratio between number of carcasses and number of breeding pairs, increased (Figure 8).
When single or groups of White-tailed Eagles were observed hunting geese in the colonies during the incubation period they often directed the attacks towards incubating females on nests. It is therefore likely that a major part of the predated Barnacle Geese during the incubation period were adult females. White-tailed Eagles were also observed to hunt brood rearing families after hatching at grazing sites and were then observed killing both adults and juveniles.
Population model
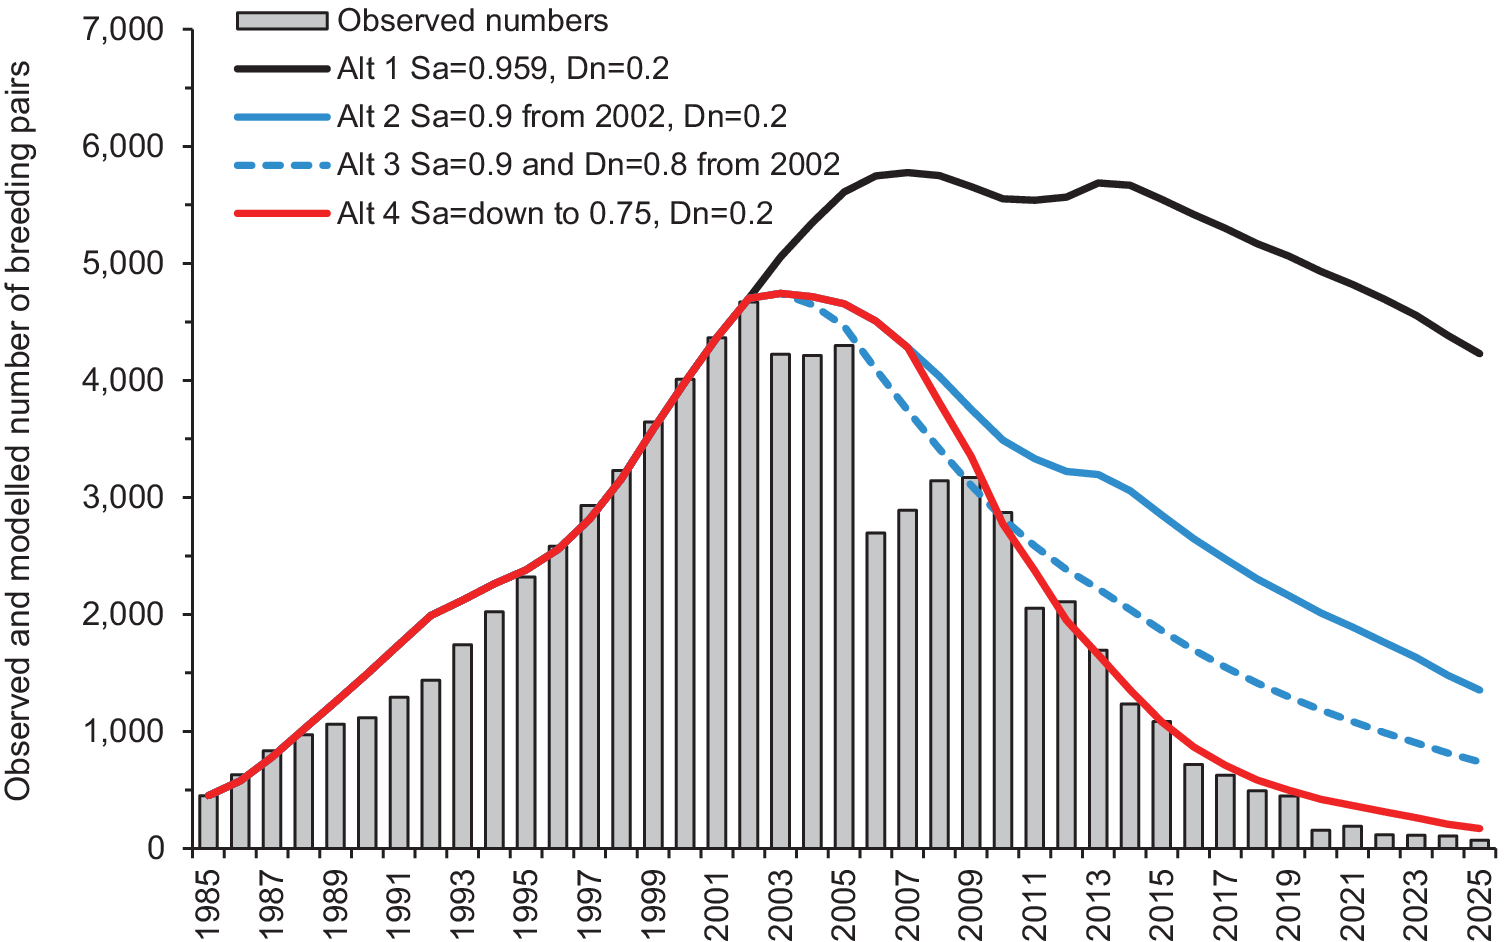
Modelled trajectories of the number of breeding pairs were based on the observed yearly numbers of fledged female young up to 2025, juvenile survival rates and breeding propensities as described in the methods section, and alternative sets of adult female survival rates and female natal dispersal rates. The modelled trajectory no. 4, which was designed to resemble the observed decline of the number breeding pairs, was based on strongly declining adult survival rates from 2002 and onwards (Figure 9). The yearly adult survival rates (Sa) used as input values for the modelled trajectory no. 4 were: 0.959 between 1985 and 2001, 0.90 between 2002 and 2006, 0.85 between 2007 and 2008, 0.80 between 2009 and 2010, and 0.75 from 2011 onwards.
Observed and modelled numbers of breeding pairs of Barnacle Geese on eastern Gotland. Modelled numbers are based on observed reproductive output from 1985 onwards and on alternative adult female survival rates (Sa) and female natal dispersal rates (Dn) from 2002 onwards. See text for details on input values to the model.

Figure 9. Long description
The x-axis represents years from 1985 to 2025. The y-axis represents the observed and modelled number of breeding pairs, ranging from 0 to 7,000.
Data components include:
* Observed numbers: Represented by grey vertical bars from 1985 to 2025. The population shows a steady increase from approximately 500 pairs in 1985 to a peak of nearly 5,000 pairs around 2002, followed by a significant decline to near zero by 2025.
* Alt 1 (Solid black line): S a = 0.959, D n = 0.2. This model shows a continued increase after 2002, peaking at nearly 6,000 pairs around 2007 before a gradual decline to 4,000 by 2025.
* Alt 2 (Solid blue line): S a = 0.9 from 2002, D n = 0.2. This model shows a moderate decline starting in 2005, reaching approximately 1,500 pairs by 2025.
* Alt 3 (Dashed blue line): S a = 0.9 and D n = 0.8 from 2002. This model shows a steeper decline than Alt 2, reaching approximately 800 pairs by 2025.
* Alt 4 (Solid red line): S a = down to 0.75, D n = 0.2. This model shows the most rapid decline, closely following the observed bar data downward to near zero by 2025.
Other modelled trajectories of the number of breeding pairs where adult survival rates were assumed not to have declined at all (trajectory no. 1), or to have declined moderately to 0.90 from 2002 onwards (trajectory no. 2), did not fit the observed decline of breeding pairs. Even when combining a moderately declining adult survival rate (0.9) with a very high natal dispersal rate of 0.8 from 2002 onwards (trajectory no. 3) did the modelled trajectory fit the observed decline (Figure 9).
When the input values of the modelled trajectory no 4 was modified and the assumed adult survival rate was kept at 0.8 from 2009 onwards, that is, was not allowed to decline all down to 0.75, but natal dispersal rate was set to very high levels, that is, was increased to 0.5 between 2007 and 2010 and to 0.9 from 2011 onwards, the modelled trajectory resembled the trajectory no. 4 and the observed decline.
Thus, taken together, the population model and the alternative modelled trajectories showed that the observed rapid decrease of breeding pairs from 2002 onwards could not be explained solely by the observed lower production of fledged young. A very significant decline in adult survival rates, probably in combination with increased natal dispersal rates, was also necessary to explain the steep decline of the number of breeding pairs.
Discussion
This long-term study of a Baltic population of Barnacle Geese as well as other studies have shown that this formerly only Arctic-breeding species has been capable to adjust its behaviour and expand its breeding range into a variety of temperate environments (Black et al. Reference Black, Prop and Larsson2014; van der Jeugd et al. Reference van der Jeugd, Eichhorn, Litvin, Stahl, Larsson and van der Graaf2009; van der Jeugd and Kwak Reference van der Jeugd and Kwak2017). The southward range expansion and the increase of breeding birds in the temperate Baltic and North Sea regions together with growing numbers in Arctic Russia has led to increasing human-goose conflicts and to the adoption of an International Single Species Management Plan for the Barnacle Goose (Fox and Madsen Reference Fox and Madsen2017b; Jensen et al. Reference Jensen, Madsen, Nagy and Lewis2018; Sørensen et al. 2024). The adopted management plan emphasises the need for further coordinated monitoring and refinement of management strategies. Proposed actions include among other things the updating of spatially explicit population size estimates, collection of demographic data and assessment of the role of predators in regulating goose populations. The present study which covered the period between 1971 and 2025 has shown that the size and demographic parameters of the part of the Baltic population of Barnacle Geese that breed on Gotland and Öland in the central Baltic Sea region has changed dramatically. The study has also shown that the effects of predation by White-tailed Eagles can be strong. The results and insights obtained from this study are relevant for the management of other Barnacle Goose populations and should be incorporated into future revisions of the International Single Species Management Plan for the Barnacle Goose (Jensen et al. Reference Jensen, Madsen, Nagy and Lewis2018; Nagy et al. Reference Nagy, Heldbjerg, Jensen, Johnson, Madsen and Therkildsen2021).
The increase phase
The development of the studied population can be divided into an increase phase from 1971 to about 2002, and a subsequent decline phase up to 2025. During the initial increase phase, breeding individuals in the oldest colony generally experienced high reproductive success and high (>0.95) adult annual survival rates (Larsson and Forslund Reference Larsson and Forslund1994, Larsson et al. Reference Larsson, van der Jeugd, van der Veen and Forslund1998). Annual mean clutch size values were generally high and did not decline when the colony size increased (Figure 3). Mean clutch size actually increased slightly when the colony approached its peak size. The predation pressure that was present was mainly limited to predation on eggs and newly hatched young by gulls and the overall hatching success was high (Forslund Reference Forslund1993; Larsson and Forslund Reference Larsson and Forslund1994). However, increased densities of family groups at the available grazing sites close to the colony during the brood rearing period led to increased mortality of newly-hatched young and, hence, to decreased production of fledged young per breeding pair (Larsson and Forslund Reference Larsson and Forslund1994). After an initial increase up to 1988, the yearly total numbers of produced fledged young also decreased but were still high enough to support a further but slower increase of breeding pairs in the colony (Figures 1 and 4).
The development of the younger colonies on Gotland and Öland during the increase phase resembled the development in the oldest Laus holmar colony albeit with a time delay of up to 10 years. However, it should be noted that the very rapid increase of breeding pairs during the 1990s was only possible because of an inflow of young recruits originating from the Laus holmar colony, that is, additional recruits to the ones born in the younger colonies. As in the oldest colony, the yearly mean clutch size values during the initial increase phase were not significantly correlated with colony size (Figure 3). The increase and subsequent decrease of the production of fledged young in the younger colonies followed the pattern observed in the oldest colony (Figure 5). At the end of the increase phase around 2002, the c.5,300 breeding pairs on Gotland and Öland constituted the major part of the Baltic population of Barnacle Geese.
The decline phase
Later, during the decline phase the number of breeding pairs on Gotland and Öland declined by 98%, to only c.100 breeding pairs in 2025 (Figure 1). The overall pattern of declines was similar in all colonies on Gotland and Öland and from 2020 onwards the number of breeding pairs per colony was very low in both early and late established colonies (Supplementary material Figure S1). The mean clutch size and the total number of fledged young declined during the decline phase (Figures 3 to 5). From 2018 onwards, no fledged young were produced in the oldest and previously largest colony in the Baltic Sea region, and in 2025 only about 20 fledged young were produced in total on Gotland.
The annual variation in mean clutch size observed over the study period is most likely a consequence of varying environmental conditions affecting the nutrient stores of the geese prior to egg laying. However, the observed decline of mean clutch sizes during the decline phase is probably not related to the pre-laying condition of the geese but rather to increased disturbance by hunting White-tailed Eagles in the colonies which caused recurrent flushing of incubating females and facilitated partial clutch predation by gulls. The declining total number of fledged young during the decline phase was mainly a consequence of the declining number of breeding pairs. The main decline of the production of fledged young per breeding pair occurred before the start of the decline phase and was related to interactions between families on the brood rearing areas and not to White-tailed Eagles (Larsson and Forslund Reference Larsson and Forslund1994). However, the continuing low production of fledged young per breeding pair during the decline phase was likely due to disturbance and predation by White-tailed Eagles.
In other smaller breeding colonies that were established in the 1980s and 1990s in the Baltic Sea region, that is, mainly in Sweden, Finland and Denmark, the total number of breeding Barnacle Geese instead increased to c.14,000 breeding pairs in the mid-2020s (Ottosson et al. Reference Ottosson, Wirdheim, Elmberg, Green, Gustafsson and Haas2025). Thus, during the decline phase, the former core breeding sites on Gotland and Öland in the Baltic Sea region were transformed into peripheral sites. It should be noted that neither the vegetation, nor the management or protection of the nesting islands on Gotland and Öland has changed during the study period in a way that could explain the increase and subsequent decline of breeding Barnacle Geese.
Causes for and consequences of the decline
Results from the population model show that the observed lower production of fledged young alone could not explain the 98% decline of breeding pairs from 2002 to 2025. When the observed numbers of produced fledged young were included as input values in the model, and the dispersal rates, breeding propensity and survival rates were assumed not to have changed since the increase phase, only a minor 9% decline of the number of breeding pairs from 2002 to 2025 was predicted (Figure 9, Alt 1 scenario).
Breeding dispersal, the permanent movement between two successive breeding sites, is extremely rare in adult Barnacle Geese, especially in adult females (de Vries et al. Reference de Vries, Boom, Nolet, Jongejans and van der Jeugd2025). It is therefore very unlikely that increased breeding dispersal to Arctic Russia or to other colonies in the Baltic or North Sea regions has caused the decline of breeding pairs in all the colonies on Gotland and Öland. It is also very unlikely that a lower breeding propensity, that is, increased frequency of non-breeding among adult birds that are still present on Gotland during summer, had caused the steep decline of breeding pairs. This is because the observed total number of moulting adults in July, that is, breeders, non- and failed breeders, declined in a similar way as the number of breeding pairs (Figure 6)
Increased natal dispersal rates have probably to some extent contributed to the observed decline of breeding pairs. However, even when using very high unrealistic values of natal dispersal in the population model the modelled trajectories did not fit the observed decline. This shows that increased natal dispersal rates alone could not have caused the decline of breeding pairs in all the colonies on Gotland (Figure 9, Alt 3 scenario).
Consequently, adult survival rates must also have declined during the decline phase, most likely in a progressive way to as low values as about 0.75 at the end of the study period (Figure 8, Alt 4 scenario). It is unlikely that hunting, derogation killing or outbreaks of avian influenza during the non-breeding season, when the Baltic, North Sea and the increasing Russian populations are mixed, should have disproportionately affected the Baltic population during the past 20 years. Instead, increased predation pressure is a more likely cause for a decreased adult survival rate.
The presence of Red Foxes has in some years clearly affected the number of breeding pairs in some of the colonies by causing geese to cancel breeding preparations or abandon their nests (Figure 7). In some cases, Red Foxes have also killed adult geese. It is notable that when the numbers of breeding pairs steeply dropped due to fox presence on a specific nesting island the number of breeding pairs did not increase in other colonies on Gotland. Furthermore, many geese that failed breeding when foxes were present returned to breed in the affected colonies in subsequent fox-free years. Thus, although the presence of foxes generated high rate of non-breeding in colonies when affected, the long-term effect on the number of breeding pairs can be considered as small. The occasional presence of foxes on some islands have only affected the total number of breeding pairs on Gotland significantly in four years during the study period (Figure 8).
The main difference between the increase and decline phase regarding predation pressures is the presence of White-tailed Eagles during the latter phase (Figure 8). Before 2003, White-tailed Eagles were rare and were not observed within colonies during the incubation period and, consequently, very few carcasses of adult Barnacle Geese were found within the colonies. However, from 2003 onwards the predation pressure by White-tailed Eagles increased substantially. For example, in 2016, when 855 pairs of Barnacle Geese bred on Gotland, 85 fresh carcasses of adult geese were found in the colonies when surveyed in the middle of the incubation period, and in 2025, when 90 pairs breed, 10 carcasses were found (Figure 8). The carcasses were not sexed but given the observed behaviour of hunting eagles, that is, often attacking incubating birds, it is reasonable to assume that a major part of the killed birds were adult females. It is important to note that the true number of adult geese killed annually by White-tailed Eagles is certainly higher than the number of carcasses found because geese killed during the later part of the incubation period (i.e. after the surveys), and during the brood-rearing period could not be counted.
Predation by White-tailed Eagles on adults is most intense during the incubation period of the geese. During the brood-rearing period the eagles also prey on flightless juveniles and thereby reduce the production of fledged young. Later in the season, from the end of July, when juveniles are able to fly and adults have regained flight capacity after the wing moult, the geese leave the moulting sites and spread out to feed on agricultural fields distributed in the larger Baltic region. The observations indicate that, although White-tailed Eagles can harass flocks of foraging geese, successful predation on adult geese and fledged young after the end of July is uncommon. It is therefore unlikely that the juvenile survival rate, in this study measured from fledging to the next summer, is negatively affected by predation by White-tailed Eagles. In October and November, the Baltic-breeding geese start migrating southward to wintering sites in the Netherlands and Germany.
In long-lived birds, including geese, it is well documented that the elasticity of adult survival rate is high, meaning that just a slight decrease in adult annual survival rate can greatly affect the population dynamics and cause population declines (Benton and Grant Reference Benton and Grant1999; Tombre et al. Reference Tombre, Black and Loonen1998; Weegman et al. Reference Weegman, Walsh, Ogilvie, Bearhop, Hilton and Hodgson2022). Thus, given the observed increased disturbance and predation by immature and adult White-tailed Eagles, high numbers of carcasses of adult geese found in the goose colonies, and a lack of possible alternative explanations, it can be concluded that an increased adult mortality during the breeding season due to predation by White-tailed Eagles, probably in combination with increased natal dispersal rates, is the major cause for the steep decline of breeding Barnacle Geese on Gotland since the beginning of the 2000s.
The increasing population of White-tailed Eagles in the Baltic Sea region has also caused a dramatic decline of the Baltic breeding population of Common Eider Somateria mollissima (Ekblad et al. Reference Ekblad, Lindén, Öst, Below, Jaatinen and Lokki2025; Öst et al. Reference Öst, Lehikoinen and Jaatinen2022). Common Eiders breed at many more sites than Barnacle Geese but when breeding at the same islands their nests are often intermingled and, hence, nests and incubating females are exposed to similar predation pressures. As when hunting Barnacle Geese, White-tailed Eagles typically direct attacks on incubating and brood-rearing Common Eider females as well as on flightless young (Ekblad et al. Reference Ekblad, Lindén, Öst, Below, Jaatinen and Lokki2025). Additional indirect non-consumptive effects linked to the presence of White-tailed Eagles include a shift in the geographic centre of breeding Common Eiders in Finland and a reduced number of nesting females in the outer archipelago (Ekblad et al. Reference Ekblad, Lindén, Öst, Below, Jaatinen and Lokki2025).
Possible indirect effects on Barnacle Geese of the increased presence of White-tailed Eagles in the Baltic Sea region have also been observed. Jonker et al. (Reference Jonker, Eichhorn, van Langevelde and Bauer2010) suggested that migrating Barnacle Geese belonging to the Arctic Russian population have postponed their timing of migration to reduce their use of Baltic stopover sites as a response to the rapidly increasing number of White-tailed Eagles. They also suggested that predation danger caused geese to not take full advantage of the grazing grounds, as they take the danger into account in their decision of where to forage. Avoidance of White-tailed Eagles might also explain that several smaller colonies in the Baltic Sea region in recent years have been established, most likely by young birds, close to cities or at other sites where human activities are common. A further increase of the numbers of White-tailed Eagles might, hence, accelerate a spatial redistribution of the Baltic population of Barnacle Geese.
The adopted International Single Species Management Plan for the Barnacle Goose and the AEWA Adaptive Flyway Management Programme (Jensen et al. Reference Jensen, Madsen, Nagy and Lewis2018; Nagy et al. Reference Nagy, Heldbjerg, Jensen, Johnson, Madsen and Therkildsen2021) focus on measures to reduce human-goose conflicts, especially damages to agriculture, due to increasing numbers of Barnacle Geese. However, this long-term study of Barnacle Geese has shown that the return of the White-tailed Eagle, a previously threatened avian predator species, has exerted an unexpectedly strong negative effect on the oldest core population segment of Barnacle Geese in the Baltic Sea region. Given the 98% population decline between 2002 and 2025, and that large numbers of White-tailed Eagles will continue to exert a high predation pressure, it seems likely that the population on Gotland and Öland will disappear or remain very small in future. Other breeding sites in Sweden, Finland and Denmark that are situated in open coastal areas might be negatively affected in a similar way if the population of White-tailed Eagle remain stable or continues to increase. For example, the number of breeding Barnacle Geese at the island of Saltholm in Denmark declined markedly from approx. 4,600 nests in 2018 to less than 1,500 nests in 2024. This decline was, at least partly, attributed to a marked increase in the occurrence of White-tailed Eagles and to frequently recorded predation on incubating females. (Christensen and Christophersen Reference Christensen, Christophersen and Lange2025; Thomas K. Christensen and Thomas Bregnballe 2026, personal communication). Thus, given the recent effects of White-tailed Eagles on Barnacle Geese in the Baltic region, derogation shooting or other management activities with the aim of reducing the size of the Baltic management unit of Barnacle Geese might no longer be needed to prevent agricultural or other damages. Continued monitoring and cross-regional comparisons are, however, advisable to further elucidate the wider relationships between populations of White-tailed Eagles, Barnacle Geese and other species of waterbirds.
Supplementary material
The supplementary material for this article can be found at http://doi.org/10.1017/S095927092610077X.
Acknowledgements
I thank all co-workers who have contributed to the long-term research project on breeding Barnacle Geese on Gotland and Öland in the Baltic Sea region. Lars Gustafsson initiated the study in 1984 and provided the data collected between 1971 and 1984. Pär Forslund and Henk van der Jeugd shared project leadership with me between 1985 and 1992, and between 1994 and 2004, respectively. I also thank all the field assistants who have contributed to the project in various ways between 1984 and 2025. I especially thank Jens Bardtrum, Seppo Ekelund, Anna Hamrell, Marie Jacobsson, Linus Nilsson, Richard Ottvall, Karin Schütz, Lars Tydén and Ineke van der Veen for cooperation and help during several years. The long-term study has during different periods been financially supported by the Swedish Environmental Protection Agency, the Swedish Natural Science Research Council, Stiftelsen Olle Engkvist Byggmästare, Uppsala University, Gotland University and Linnaeus University.



 Open access

