1. Introduction
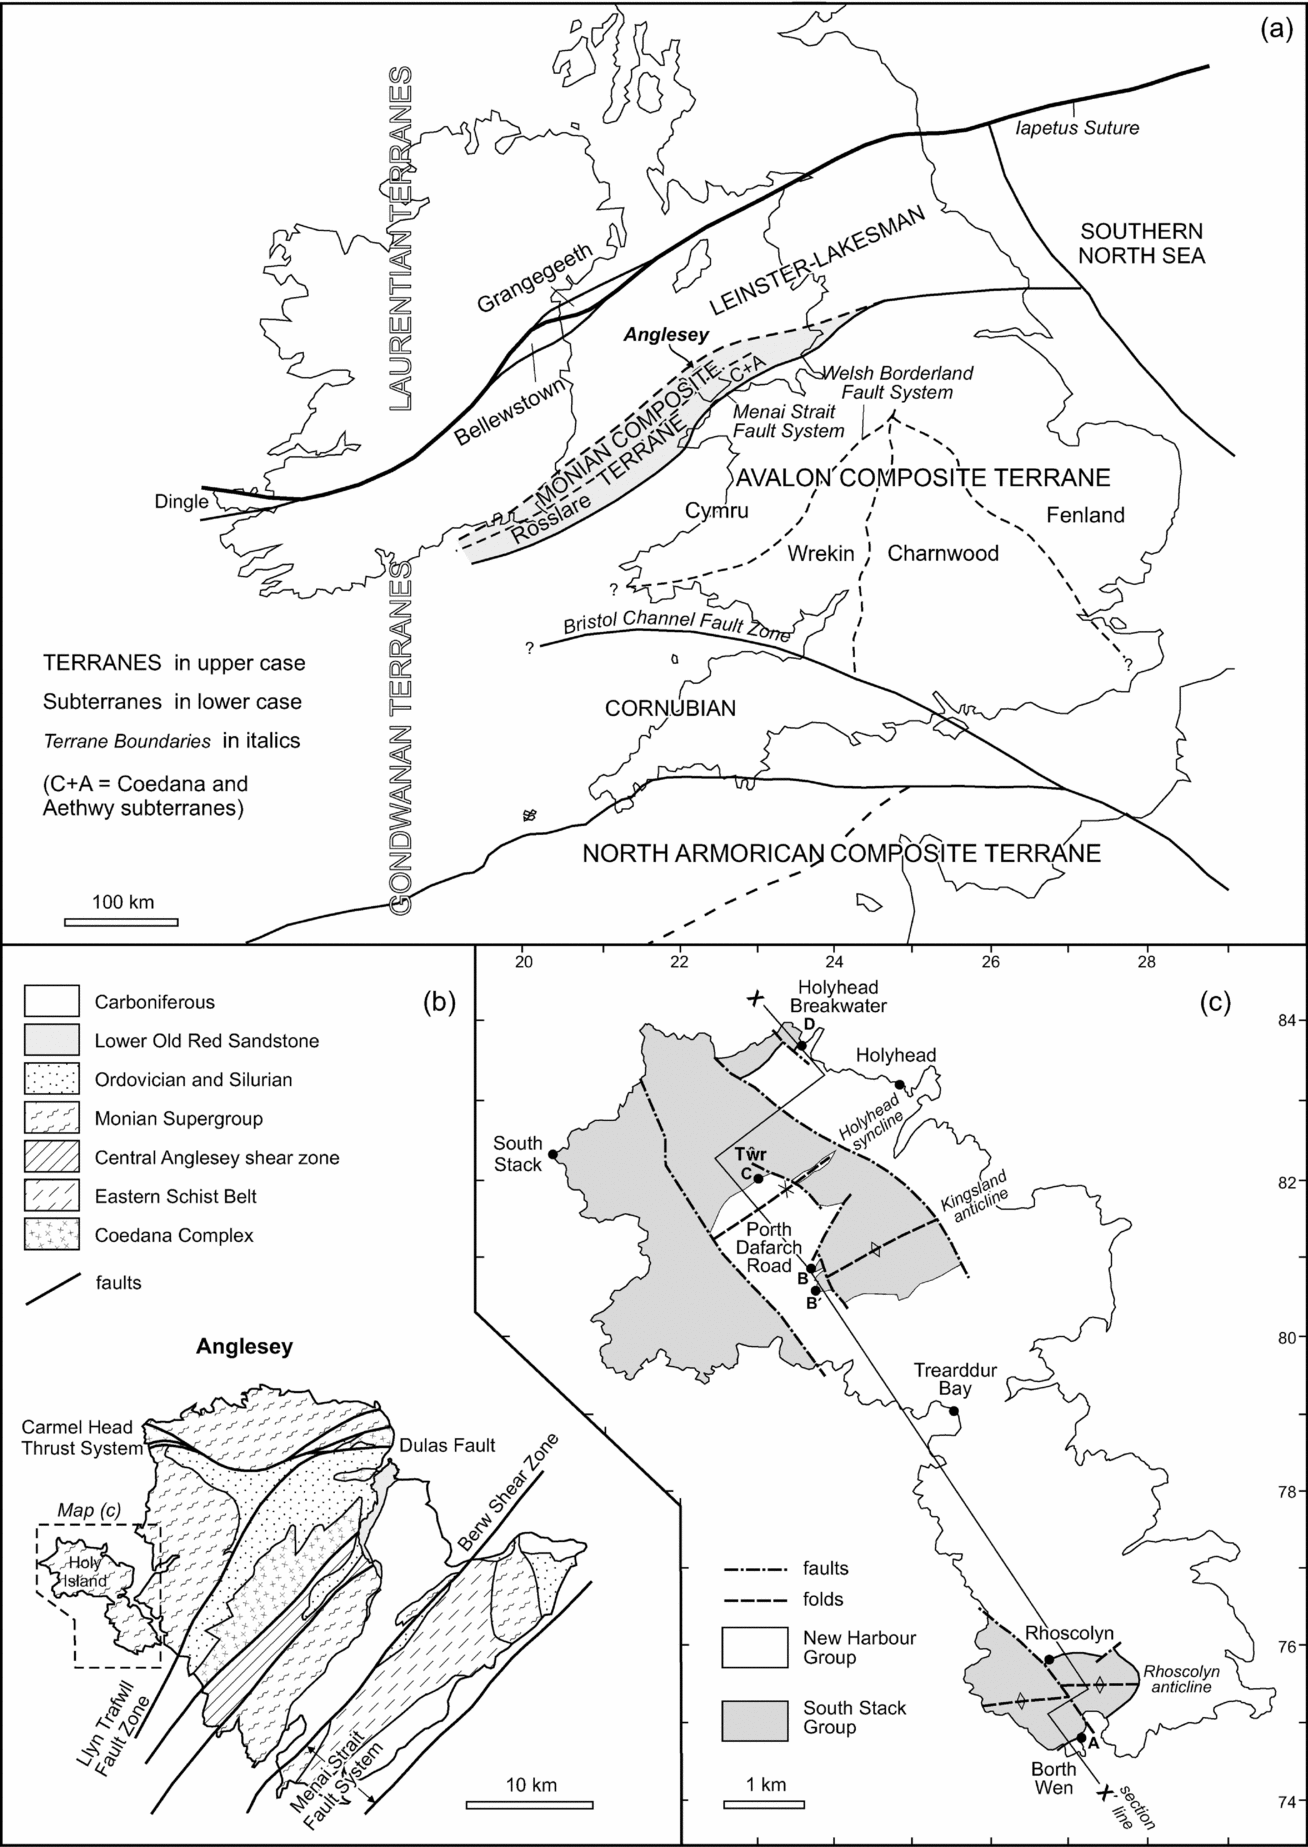
The island of Anglesey, North Wales, exposes the most varied area of Neoproterozoic and related Cambrian rocks in southern Britain. Anglesey lies south of the Iapetus Suture that marks Silurian ocean closure (Fig. 1a), and therefore probably originated in Proterozoic time as fragments of the Gondwana supercontinent. Anglesey forms the main part of the Monian Composite Terrane, separated from the larger Avalon Composite Terrane to the southeast by the Menai Strait Fault System (Fig. 1b). The Monian Composite Terrane comprises late Proterozoic gneisses and granite (Coedana Terrane), Cambrian to possibly early Ordovician metasediments (Monian Supergroup Terrane), and related shear zones, including a blueschist belt (Aethwy Terrane) (McIlroy & Horák, Reference McIlroy, Horák, Brenchley and Rawson2006). It continues southwestward to the Rosslare Complex of southeastern Ireland. Northwest of the Monian Terrane is the Leinster–Lakesman Terrane, which exposes no Proterozoic basement.
(a) Terrane map of the southern British Isles showing location of Anglesey. (b) Geological map of Anglesey showing location of Holy Island. (c) Geological map of Holy Island showing D1 syncline and anticline axial traces and the line of cross-section X–X′ (Fig. 3). Terrane map modified from Holdsworth, Woodcock & Strachan (2012) after British Geological Survey (1996).

The association in the Monian Supergroup of deep-water turbidites, mafic igneous rocks and a major olistostrome (Gwna Group), and their juxtaposition with blueschists of the Aethwy Terrane suggested first to Wood (Reference Wood, Dott and Shaver1974) and then to later authors (e.g. Gibbons, Reference Gibbons1983; Gibbons & Horák, Reference Gibbons and Horak1996) that the Monian Composite Terrane represents an accretionary complex at a subduction zone. This possibility has established Anglesey as an area of international importance (e.g. Kawai et al. Reference Kawai, Windley, Terabayashi, Yamamoto, Maruyama and Isozaki2006, Reference Kawai, Windley, Terabayashi, Yamamoto, Maruyama, Omori, Shibuya, Sawaki and Isozaki2007). However, there are differing views on whether the accretion happened predominantly by dip-slip thrusting (Kawai et al. Reference Kawai, Windley, Terabayashi, Yamamoto, Maruyama, Omori, Shibuya, Sawaki and Isozaki2007) or by strike-slip faulting (Gibbons & Horák, Reference Gibbons and Horak1996), and whether the Monian Supergroup is part of the accretionary complex (Kawai et al. Reference Kawai, Windley, Terabayashi, Yamamoto, Maruyama, Omori, Shibuya, Sawaki and Isozaki2007) or post-dates assembly of the Coedana and Aethwy terranes (McIlroy & Horák, Reference McIlroy, Horák, Brenchley and Rawson2006). Crucial to testing these hypotheses is a better understanding of the stratigraphic and structural sequence within the component terranes on Anglesey.
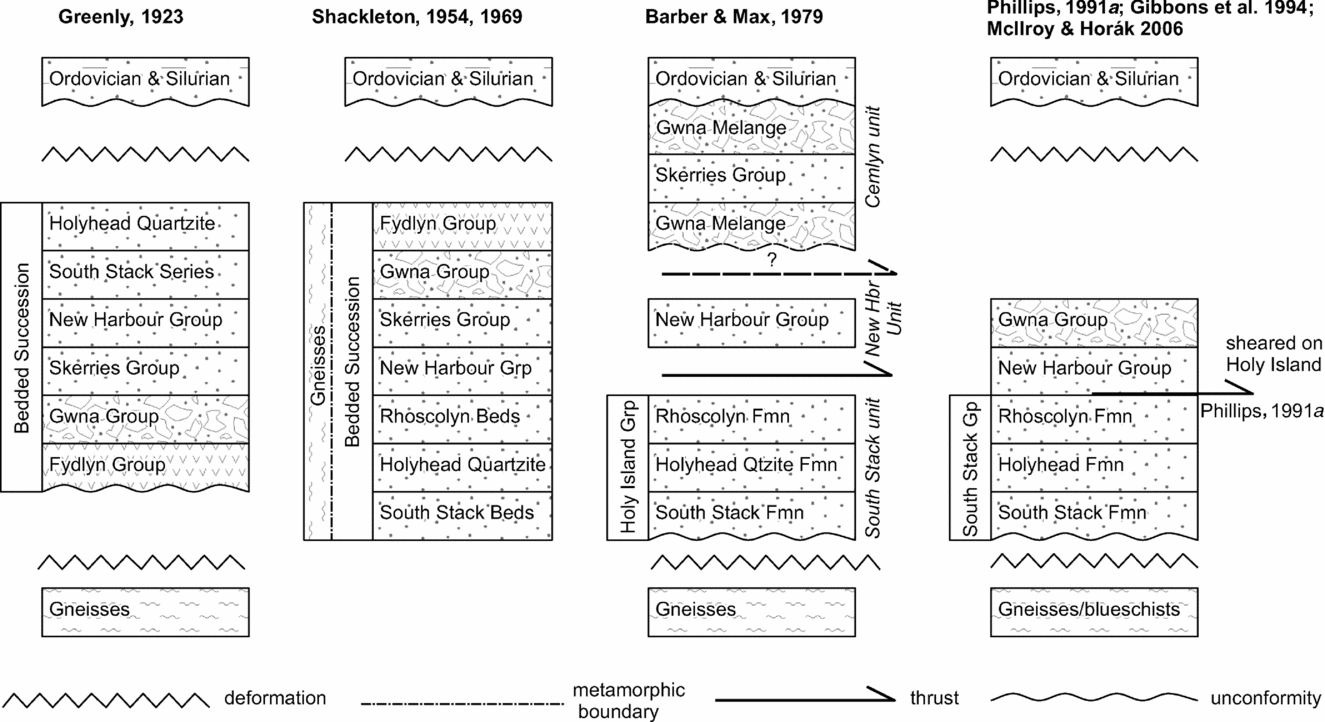
The sequence in the Monian Supergroup (Fig. 2) has been particularly problematic since Shackleton (Reference Shackleton1954, Reference Shackleton and Wood1969) showed that the long-established sequence of Greenly (Reference Greenly1919) must be incorrect. The debate was fuelled by Barber & Max (Reference Barber and Max1979), who divided the supergroup into three tectonostratigraphic units (structurally upwards, the South Stack, New Harbour and Cemlyn units) separated by tectonic contacts. Gibbons & Ball (Reference Gibbons and Ball1991) proposed that the Cemlyn unit in fact equates to the Gwna melange, and has a stratigraphic contact with the underlying New Harbour Group. Phillips (Reference Phillips1991a ), however, maintained the view that the South Stack/New Harbour contact was tectonized, at least on Holy Island. The Monian sequence has more recently been questioned (a) by detrital zircons in the South Stack Group (Collins & Buchan, Reference Collins and Buchan2004), implying that it is no older than 522 ± 6 Ma (early Cambrian), and (b) by strontium isotope stratigraphy from the Gwna Group (Horák & Evans, Reference Horák and Evans2011) showing that some of its component melange clasts are of Early Neoproterozoic age. If the accumulation of the Gwna Group was anywhere near the age of these clasts, it cannot then form the top unit of a mostly Cambrian Monian Supergroup. As Horák & Evans (Reference Horák and Evans2011) concluded, the stratigraphy of the supergroup requires re-examination.
Schematic tectonostratigraphic columns for the Monian Supergroup of Anglesey, together with the gneiss below and the Ordovician and Silurian sequences above, showing the evolution of proposals since that of Greenly (Reference Greenly1923).

2. The boundary between the Rhoscolyn and New Harbour formations: previous work
The present paper reports a re-examination of the boundary between the South Stack and New Harbour groups on Holy Island, Anglesey (Fig. 1c). On the island, the South Stack Group comprises the South Stack Formation, the Holyhead (Quartzite) Formation and the Rhoscolyn Formation, overlain by the New Harbour Group, here comprising only the New Harbour Formation (Greenly, Reference Greenly1919; Shackleton, Reference Shackleton and Wood1969; Phillips, Reference Phillips1991a ). The Rhoscolyn Formation is an assemblage of polydeformed and metamorphosed (greenschist facies) sandstones and subordinate mudstones. These rocks have been interpreted as turbidites, deposited in a submarine fan with continental provenance from the southeast, in a NE–SW-trending Monian basin (Phillips, Reference Phillips1991a ; McIlroy & Horák, Reference McIlroy, Horák, Brenchley and Rawson2006).
The New Harbour Formation on Holy Island mostly originated as mudstones, with quartzose silt–mud couplets defining a thin lamination. The mudstones are now metamorphosed to quartz-chlorite-mica schists at greenschist facies, and polydeformed on a smaller scale than the Rhoscolyn Formation. The New Harbour Group as defined by Phillips (Reference Phillips1991a ), which includes the overlying Church Bay Tuffs and Skerries Formation (not exposed on Holy Island), was also interpreted by him as turbidites. The group, as broadly defined, includes volcaniclastic sandstones derived from an andesitic arc (Phillips, Reference Phillips1991a ; McIlroy & Horák, Reference McIlroy, Horák, Brenchley and Rawson2006), with sediment probably derived from the north or northwest. Thus, Phillips (Reference Phillips1991a ) concluded that the Monian Supergroup was derived from more than one source area, consistent with an active continental margin model.
It should be emphasized that Phillips's (1991a) geochemical and sedimentological data for the provenance of the New Harbour Group do not come from the New Harbour Formation as defined by Greenly (Reference Greenly1919), nor from exposures on Holy Island as discussed in this paper. Instead, his data come from the Lynas and Bodelwyn formations from northernmost Anglesey, otherwise known as the Amlwch Beds (Greenly, Reference Greenly1919), whose direct correlation to the New Harbour Formation on western Anglesey is not proven. Phillips (Reference Phillips1991a , p. 1086) stated specifically that the New Harbour metasediments in western Anglesey were too deformed for their depositional environment (or presumably their geochemistry) to be evaluated. The implication in later work (e.g. Hudson & Stowell, Reference Hudson and Stowell1997; McIlroy & Horák, Reference McIlroy, Horák, Brenchley and Rawson2006) that the New Harbour Formation is turbiditic therefore needs confirmation.
This part of the Monian Supergroup was traditionally described as Precambrian (Greenly, Reference Greenly1919; Shackleton, Reference Shackleton and Wood1969). However, a radiometric date of 522 ± 6 Ma from a detrital zircon in the South Stack Formation (Collins & Buchan, Reference Collins and Buchan2004), together with the presence of Skolithos burrows in the Rhoscolyn Formation (Greenly, Reference Greenly1919; McIlroy & Horák, Reference McIlroy, Horák, Brenchley and Rawson2006), which we confirm later in this paper, now suggest an early Cambrian or later age. Arenig (lower Ordovician) rocks unconformably overlie the Monian Supergroup and provide a minimum age constraint.
The deformation history of this part of the Monian has been the subject of much debate and several conflicting interpretations (Shackleton, Reference Shackleton and Wood1969; Barber & Max, Reference Barber and Max1979; Cosgrove, Reference Cosgrove1980; Roper, Reference Roper1992; Phillips, Reference Phillips1991b ; Hudson & Stowell, Reference Hudson and Stowell1997; Treagus, Treagus & Droop, Reference Treagus, Treagus and Droop2003; Hassani, Covey-Crump & Rutter, Reference Hassani, Covey-Crump and Rutter2004). Areas for debate have been (1) the ‘age’ of the Rhoscolyn Anticline (whether D1, D2, etc.), (2) correlations between structures and fabrics in the contrasting Rhoscolyn and New Harbour formations, and (3) the nature of the boundary between the two formations. We provided evidence (Treagus, Treagus & Droop, Reference Treagus, Treagus and Droop2003) to quantify two significant deformations in South Stack Group rocks at Rhoscolyn: D1, creating the Rhoscolyn Anticline as an initially upright NE–SW-trending fold; and D2, modifying this anticline to a SE-vergence, and creating crenulation fabrics and minor folds. However, these two clear-cut deformation phases in the Rhoscolyn Formation are less obvious in the New Harbour Formation. Major and mesoscale folds of sandstone beds or packets of beds are the dominant D1 structures in all the South Stack Group on Holy Island, but no structures of this scale have ever been described in the New Harbour Formation. The New Harbour Formation is sedimentologically far more uniform, lacking prominent sandstone beds, and is characterized by a strong bedding-parallel foliation/schistosity and lineation, and a variety of discontinuous small-scale folds and bands. Three or four phases of deformation have been proposed for the New Harbour Formation based on their small-scale structures (Cosgrove, Reference Cosgrove1980; Phillips, Reference Phillips1991b ; Hudson & Stowell, Reference Hudson and Stowell1997). One of the purposes of the present study is to resolve these apparent differences in deformation between the Rhoscolyn Formation and the New Harbour Formation, specifically by analysing the geology and structures at the boundary in the field and in thin-section.
Greenly (Reference Greenly1919, p. 156) discussed several exposures of the boundary of the Rhoscolyn Formation and New Harbour Formation, stating: ‘at all these sections there is a rapid but unbroken change from one type of sedimentation to another’. In his description for Borth Wen (Rhoscolyn Bay; locality A of this paper), Greenly (Reference Greenly1919, p. 157) described basic tuffs and spilitic lavas close to the boundary. Sedimentary continuity is implied by Shackleton (Reference Shackleton and Wood1969) in his reinterpretation of the structure and stratigraphy of the Monian using ‘way-up evidence’. Although considering the boundary of the Rhoscolyn Formation and New Harbour Formation to be originally sedimentary, Phillips (Reference Phillips1991a , pp. 1080–1) described the boundary as a ‘tectonized sedimentary contact’ marked by a ‘high strain zone’ that included a ‘highly sheared metabasalt’.
To explain the differences in deformation between the Rhoscolyn Formation and the apparently more highly deformed New Harbour Formation, Barber & Max (Reference Barber and Max1979) proposed that the boundary marked a structural discordance, and that the New Harbour Formation was an older and more strongly deformed unit, thrust over the Rhoscolyn Formation during subduction. This proposal was vigorously debated in the published discussion of Barber & Max (Reference Barber and Max1979, pp. 424–31), with four separate discussions (Wood, Powell, Maltman, Gibbons) variously suggesting that the deformations could be ‘matched’ across the two formations, and that the contrast in style and intensity was the result of their lithological differences, and the strong bedding-parallel first schistosity/foliation developed in the more pelitic New Harbour Formation. Our observations, in the present paper, tend to support this conclusion.
In this paper, we describe the geology and structures at four localities at or close to the boundary between the Rhoscolyn Formation and New Harbour Formation on Holy Island, Anglesey, to demonstrate continuity of sedimentation and structures across the boundary, in the field and on the microscopic scale. We will show that there are no mesoscopic or microstructural structures indicative of a tectonic shear zone at this boundary. Our observations will also contribute to the discussion of the sedimentary environment in this part of the Monian of Anglesey.
3. The boundary between the Rhoscolyn and New Harbour formations: new observations
We describe the boundary at four localities, A–D (Figs 1c, 3). The most completely exposed section is at A, on the steep SE-dipping limb of the regional Rhoscolyn Anticline, where the deformational history has been much debated, as cited in Section 2.
Cross-section X–X′ shown in Figure 1, showing position of localities A–D discussed in text. The boundary of the Rhoscolyn/New Harbour formations (RF – blank, NHF – shaded) is shown, interrupted where uncertain, with notional minor D1 folds and cartoons of minor D2 fold geometry and S2 axial-planar cleavage. Three major D1 folds to which S1 is axial-planar are shown: RA – Rhoscolyn Anticline, KA – Kirkland Anticline and HS – Holyhead Syncline. The latter two are newly described and discussed in this paper.

3.a. Borth Wen, locality A
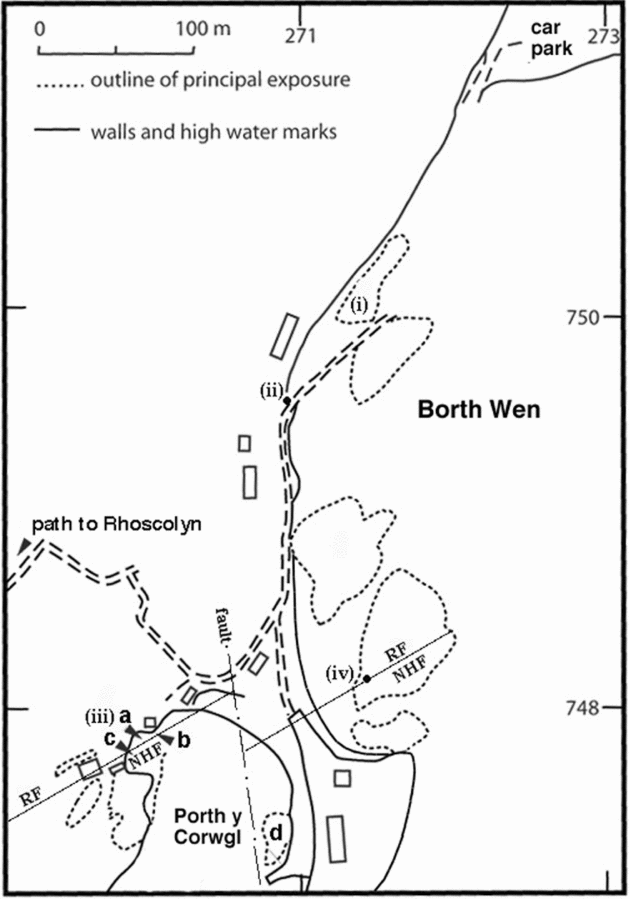
The boundary between the Rhoscolyn Formation and the New Harbour Formation is seen most completely here, at Borth Wen (also known as Rhoscolyn Beach) (Fig. 4). The best-exposed outcrop of the Rhoscolyn Formation, nearest to the boundary between the two formations, is seen at (i) [SH 2714 7501], in a near-horizontal 100 ×10 m beach exposure of coarse to fine sandstones interbedded with subordinate mudstones. The sandstones contain about 80% quartz, the remainder comprising plagioclase, microcline and heavy minerals. Each sandstone bed typically grades up into mudstone, now with metamorphic muscovite. Sandstone bed thicknesses vary from approximately 15 to 150 cm. Sandstones contain scattered laminated mudstone clasts and some differentially weathering ellipsoidal structures interpreted as post-depositional nodules. As well as graded bedding, some sandstone beds show ripple cross-lamination. Both depositional structures show that the steep SE-dipping succession youngs to the southeast and faces upwards on the steep NW-dipping S1 cleavage (Fig. 3).

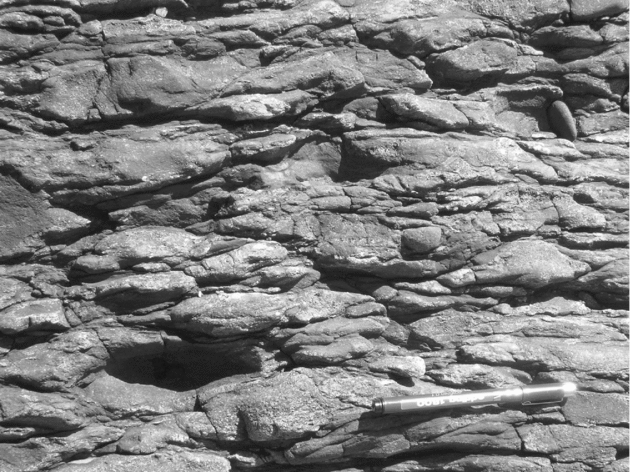
These beach exposures (Fig. 4 (i)) reveal lenses of matrix-supported conglomerate (Fig. 5), previously unrecorded, that vary in structural thickness from one to several metres (sub-perpendicular to bedding and cleavage). The conglomerate clasts include a range from coarse sandstone through to mudstone, all now aligned in the first cleavage (S1) (Fig. 5). Clast long dimensions range from 1 to 20 cm. In two-dimensional views perpendicular to S1, all the clasts appear strongly ‘flattened’ (elliptical). From the limited three-dimensional exposure available, the deformed clasts appear oblate. Some mudstone clasts have a more angular outline and exhibit bedding at a high angle to the clast length. Both the clast lithologies and their matrix are very similar to the neighbouring lithologies in the Rhoscolyn Formation here, suggesting an intrabasinal origin. In particular, no exotic clasts, such as vein quartz or igneous material, have been observed, and no clasts show evidence of an inherited deformational fabric.
The conglomerate at Borth Wen, at locality (i) of Figure 4, viewed in sub-horizontal exposure. Pen is 15 cm long and oriented with top pointing SW, aligned with the S1 trace.

To the southwest, in exposures of the Rhoscolyn Formation closer to the contact (Fig. 4 (ii)) [SH 2708 7495], the thickness of the lateral continuation of the conglomerate horizon is at least 8 m in plan view. Here it is less matrix-rich, and the strongly elliptical clasts have maximum long to short axial ratios of between 5 and 10:1 perpendicular to S1. In thin-section there are seen to be lenses of granule and fine pebble conglomerate here with clasts from 1 to 10 mm in length that locally act as a matrix to the larger clasts.
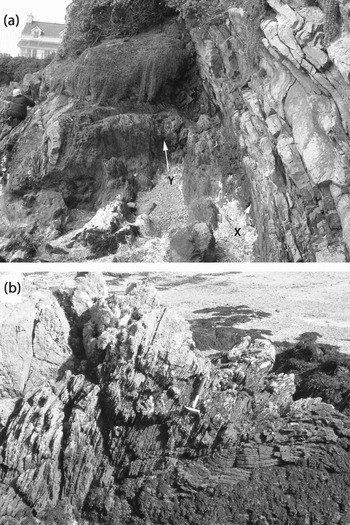
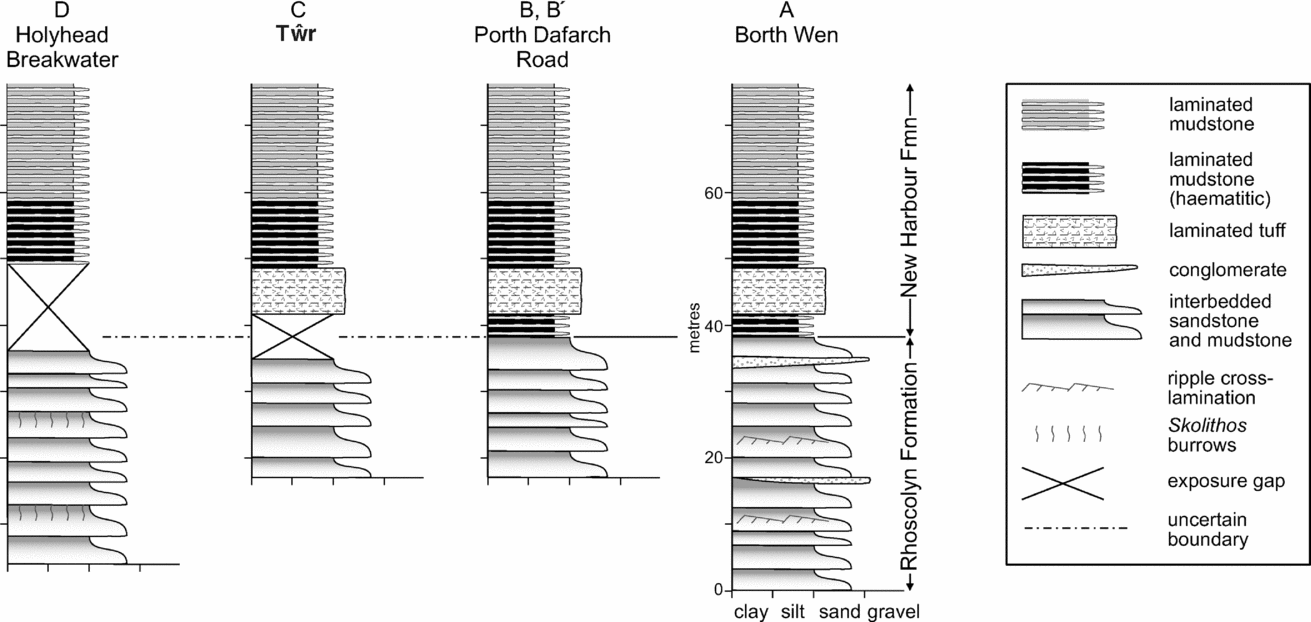
The boundary of the Rhoscolyn Formation with the New Harbour Formation is exposed in a 5 m long cliff on the west side of Porth-y Corwgl [SH 2702 7478], just to the southwest of Borth Wen (Fig. 4 (iii)a), shown in Figure 6a. Below we describe the continuously exposed, near vertically dipping sequence here, from the top of the Rhoscolyn Formation through the 40 m of the succeeding thickness of New Harbour Formation. In this description we refer to thin-sections, 15 of which have been made, five from the top 2 m of the Rhoscolyn Formation, two from the lowest New Harbour Formation, four across the tuff member described in below and the remainder at intervals through the stratigraphically higher New Harbour Formation. A summary log through the succession is given in Figure 7, Log A.
The Rhoscolyn/New Harbour Formation boundary at Porth y Corwgl (Fig. 4), at locality (iii)a. (a) Looking SW, X marks the boundary between the Rhoscolyn Formation (right) and New Harbour Formation, and Y is the boundary of the New Harbour Formation with the tuff horizon, as discussed in the text; person on left for scale. (b) Looking NE, hammer marks upper transitional boundary of tuff with New Harbour Formation (right). Sedimentary layering in the tuff appears as subvertical traces in the pale area, top left.


The Rhoscolyn Formation here is steeply N-dipping and overturned (076°/80°N), and comprises beds of sandstone and subordinate mudstone, 20–50 cm thick. In thin-section the sandstones are seen to be unusually feldspathic and, significantly, locally contain thin (millimetre-scale) stripes of dark opaque minerals (mainly haematite) similar to those seen in the New Harbour Formation above. In the quartzites nearest to the contact (X on Fig. 6a), open NE-plunging folds affect bedding and the S1 schistosity, together with its quartz elongation lineation that plunges steeply at right angles to the fold axes; thus, we attribute these folds to the second deformation (D2). The folds and lineation are equivalent in style and attitude to the main folds and lineation described below in the New Harbour Formation. Laterally (Fig. 4 (iii)b), ~6 m southeast of the exposed boundary, and ~2 m below it stratigraphically, the sandstones of the Rhoscolyn Formation are replaced by matrix-supported conglomerates, in a lens ~10 m long, with similar constituent clasts to the conglomerates described previously. The mudstone matrix to the conglomerate clasts is now schistose.
The boundary of the Rhoscolyn Formation with the New Harbour Formation is perfectly exposed (Fig. 6a, X), with the topmost sandstone of the Rhoscolyn Formation succeeded to its southwest by a unit, about 2 m thick, of finely laminated grey mudstones, of typical New Harbour Formation lithology, other than containing distributed fine haematite. The main schistosity (S1) parallels bedding, emphasizing the pervasive lamination so characteristic of the New Harbour Formation. Thin-sections show this lamination to comprise alternations of quartz/feldspar-rich and chlorite/muscovite/haematite-rich laminae, 1 or 2 mm thick. These dark New Harbour Formation mudstones contain several features that are seen in the Rhoscolyn Formation immediately below the boundary. Locally they contain stripes of dark opaque minerals (mainly haematite) identical to those in the Rhoscolyn Formation; they are affected by minor folds, which are of the same size, style and attitude as the D2 folds seen in the Rhoscolyn Formation; and the folded S1 schistosity contains a quartz elongation lineation identical in its attitude to that in the Rhoscolyn Formation below.
Up section, to the southwest of these schists, there is a sharp boundary (Y on Fig. 6a) with a unit, about 4–5 m wide, of uniformly steep SE-dipping foliated rock of a darker blackish colour and locally pock-marked texture. In thin-section this consists of chlorite, muscovite, quartz, albite and ore minerals; minor heavy minerals include zircon and apatite, and brown oxidized ankerite is seen as an interstitial mineral. The rock is finely laminated, with laminae of relatively coarse quartz and albite alternating with laminae of finer-grained chlorite, muscovite and albite. Chlorite usually dominates over muscovite and the ratio of quartz to albite is variable, but more commonly albite dominates. In one instance it can be seen that randomly oriented albite clasts are pseudomorphed by metamorphic albite. The dark colour of the unit is owing to the presence of haematite, generally as a fine-grained dust but also locally as randomly oriented laths up to a millimetre long. The opaques are most concentrated in chlorite-rich seams, sometimes as distinct layers themselves. This unit also locally contains lenses, 5–10 mm long, of pink ankerite. Sedimentary layering, as well as schistosity, is clear in this unit (Fig. 6).
Greenly (Reference Greenly1919, pp. 261–2) refers to these rocks as tuffs (or tuff-schists). We concur with this term because the rock is clearly laminated, and we conclude a basaltic origin from the mineralogy. Our observations do not support Phillips's (1991a) description of this rock as a metabasalt. As we shall see below, this tuff unit is remarkably persistent in other exposures of the New Harbour Formation at this stratigraphical level across Holy Island.
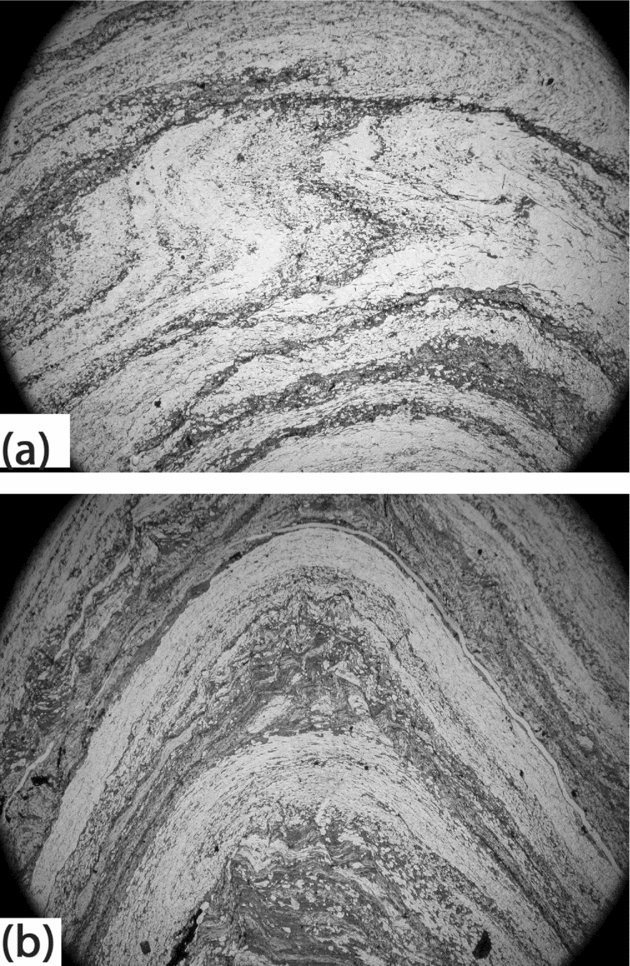
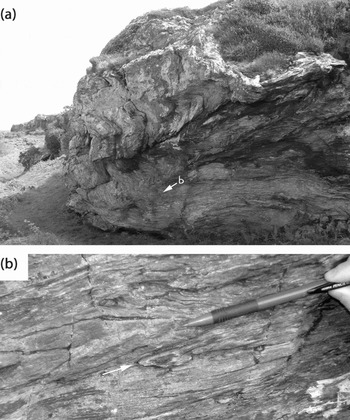
At the SW margin of the tuffs (Fig. 4 (iii)c), there is a transition into the stratigraphically younger part of the New Harbour Formation (Fig. 6b). The New Harbour Formation schists were originally laminated mudstones, comprising alternations of quartz/feldspar- and chlorite/muscovite-rich millimetre-thick laminae. Thin-sections (Fig. 8b) and polished slabs show critically that each original quartzose silt lamina is sharp based and tends to grade up into the overlying mudstone lamina. However, immediately above the tuff, the lithology differs from the typical New Harbour Formation in that it include stripes of dark opaque minerals, seen in thin-section to be dominantly haematite, as seen in the New Harbour Formation lithology below the tuffs. These mudstones, with a dark sheen, give way after ~8 m to the typical New Harbour Formation schistose mudstones. The mudstones are commonly affected by NW-verging, NE-plunging D2 metre-scale folds, as seen in Figure 6b, with a gently NW-dipping axial-planar crenulation cleavage. Folds of this scale and geometry are seen in all the New Harbour Formation schists on Holy Island and are best illustrated at Tŵr, locality C (see Fig. 9a). Above these haematite-rich New Harbour Formation mudstones, ~25 m from the boundary, exposures and thin-sections reveal D2 folds refolding small isoclinal folds we consider to be D1 folds. Figure 8a shows tight folds of original sedimentary lamination with a fine axial-planar S1 fabric developed in the hinges. This becomes pronounced and indistinguishable from bedding on isoclinal D1 fold limbs, rendering bedding and S1 sub-parallel, and creating the pronounced foliation and mineral stretching lineation characteristic throughout the New Harbour Formation that is seen folded in later D2 folds (Fig. 8b).
Two adjacent images, 15 mm wide, of a D2 fold in the New Harbour Formation about 25 m above the boundary at Porth y Corwgl (Fig. 4) at [SH 2702 7475]. (a) Upper part shows tight to isoclinal folds of fine sedimentary layers that we interpret as D1 folds, with axial-planar S1 fabric in the hinges, passing into a stronger S1 fabric on fold limbs. Lower part shows outer arc of the D2 fold shown in (b). (b) D2 fold of compositional S1/bedding foliation. Original sedimentary lamination comprises quartz silt grading into chlorite/mica laminae; lamination youngs downwards in this view. S2 crenulation cleavage is weakly developed in the chlorite/mica laminae.

(a) D2 folds in the New Harbour Formation schists at Tŵr (locality C; Fig. 10b (iii)). View looking NE; cliff is ~8 m high. (b) Close-up of isoclinal D1 fold-pair indicated by pencil (15 cm long) and arrow, as located in (a).

Younger New Harbour Formation mudstones are seen immediately across Porth y Corwgl (Fig. 4 (iii)d), about 30 m distant from the latter exposures. These are now the typical finely banded schistose mudstones of the formation, as in Figure 8, lacking the opaque mineral stripes seen in the New Harbour Formation described above. The Rhoscolyn Formation/New Harbour Formation boundary can also be identified in seaweed-covered rocks (Fig. 4 (iv)), evidently displaced by a fault on the east side of Porth y Corwgl.
We conclude from this best-exposed locality (Fig. 7, Log A) that sedimentation is normal and continuous, and that there is no evidence of a tectonic break (c.f. Barber & Max, Reference Barber and Max1979) or a tectonized movement zone (c.f. Phillips, Reference Phillips1991a ). In particular, we emphasize that there is no evidence either in the field or in thin-section for mylonitic textures, shear bands or C-S fabrics.
The position of the Rhoscolyn Formation/New Harbour Formation boundary can be identified in three other localities on Holy Island (Figs 1, 3; B, C and D Section 3.b–d), although none supplies as complete a section as A at Borth Wen. The successions at these localities are also shown in simplified form in Figure 7.
3.b. Porth Dafarch Road, locality B/B′
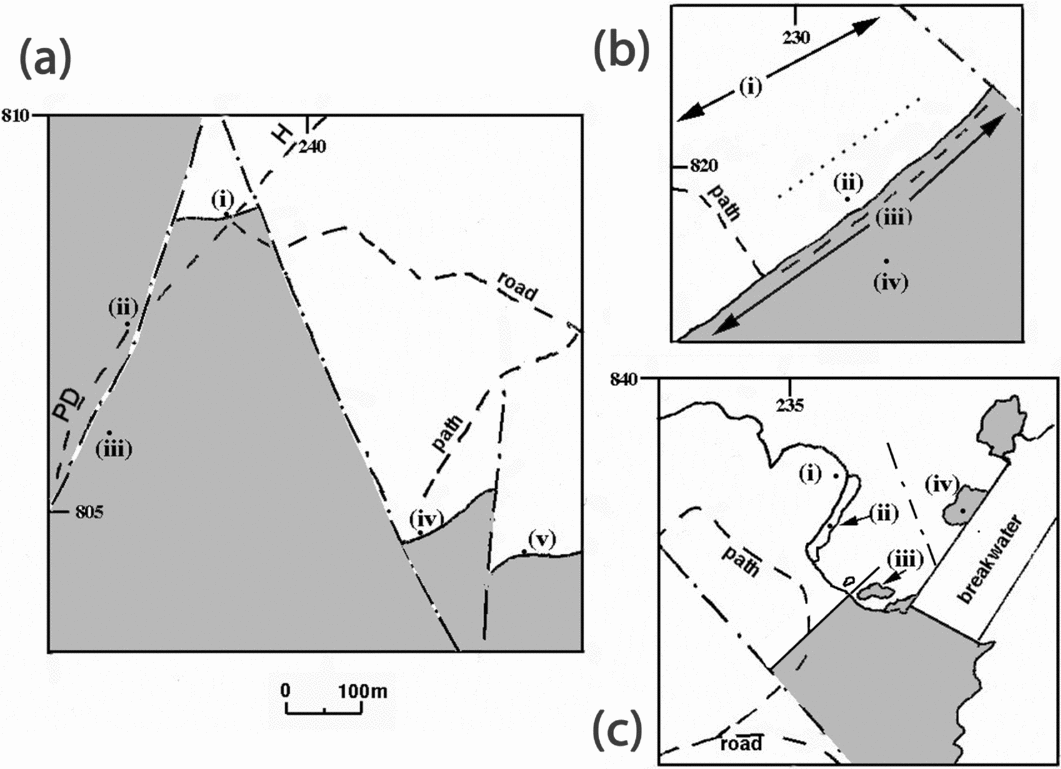
Here, components of the transition between the Rhoscolyn Formation and the New Harbour Formation are seen in outcrop by the Porth Dafarch to Holyhead road (Fig. 7, Log B/B′ and Fig. 10a). The exposures are on the inverted limbs of two D1 minor anticlines that are subsidiary to a major D1 anticline (Fig. 3), which trends E–W and is overturned to the south. The strikes of bedding and the cleavages are here ESE–WNW, in contrast to the NE or ENE strike in localities A, C and D; this is considered to be the result of rotation in this area of unusually intense faulting.
Maps of the Rhoscolyn Formation (blank) and New Harbour Formation (shaded) at localities B/B′, C and D of Figures 1c and 3. Interrupted lines are roads and footpaths; faults are shown as dash–dot lines. (a) Map of localities B and B′, the area around the Porth Dafarch (PD)–Holyhead (H) road, showing locations (i) to (v) discussed in the text. (b) Map of locality C, the area southeast of the South Stack–Holyhead road SE of Tŵr farm. The arrowed areas (i) and (iii) are prominent areas of outcrop of the Rhoscolyn Formation quartzites and the New Harbour Formation schists, respectively. The area between (i) and the dotted line is of scattered outcrop of quartzite; the area between the dotted line and the New Harbour Formation boundary is of scattered outcrop of tuff and schist, and (ii) is the tuff boundary with the New Harbour Formation, discussed in the text. (c) Map of locality D, the area west of the Holyhead Breakwater, showing locations (i) to (iv) discussed in the text.

3.b.1. Locality B
This locality was described by Shackleton (Reference Shackleton and Wood1969 pp. 6–7), but his data were mostly obtained from a quarry immediately north of the roadside contact we describe; the overgrown nature of this quarry now makes it inaccessible. However, the information we report agrees precisely with Shackleton's in the geometry of the folded succession. Our only disagreements are firstly, that we have observed a few metres of New Harbour Formation mudstones between the Rhoscolyn Formation and the tuffs (Fig. 7), and secondly that we identify the folds as being of a second generation, based on the observation of an early cleavage folded by the folds, supported by thin-section evidence.
The boundary of the New Harbour Formation mudstones with the Rhoscolyn Formation sandstones is seen in an exposure at the foot of the crag above the road (Fig. 10a (i)) [SH 2385 8085], immediately opposite the boundary with a minor road. At the top of the crag above the roadside, the Rhoscolyn Formation comprises beds of sandstone containing scattered stretched 1.5 mm long quartz grains, alternating with thin beds of mudstone. In thin-section, the sandstones contain ~5% feldspar and the mudstones are locally rich in fine-grained haematite. The rocks are affected by 10 cm scale D2 folds that trend ESE and verge N with axial-planar S2 cleavage in alternating mudstones; no certain bedding/S1 relations have been observed here. The beds descend steeply (085°/62°N) towards the road.
At the roadside, New Harbour Formation schistose mudstones, that have a characteristic black sheen, are seen in contact with and structurally beneath thinly bedded (1–2 cm thick) graded sandstones of the Rhoscolyn Formation. In thin-section the New Harbour Formation lithology has the same characteristics as those seen at locality A (Borth Wen), immediately above the Rhoscolyn Formation. The boundary trends 080°/48°N. D2 minor folds and bedding/S2 relations in the schists show northerly vergence. The New Harbour Formation schistose mudstones on this N-dipping limb of the anticline, still inverted from the grading in the Rhoscolyn Formation, can be seen in a series of discontinuous exposures to the south, on the northwest of the road. Exposures about 10 m south of the boundary, are typical of the tuff, as already described for locality A: feldspathic, calcitic laminated tuffs with delicate laminae of opaque minerals, mostly haematite. The rocks are affected by minor D2 folds, trending ESE (e.g. 10°/110°) and verging north.
The New Harbour Formation mudstones are seen again (Fig. 10a (ii)) another 100 m further south (S1 095°/26°N), probably separated from the previous exposures by a fault, one of several in the area that trend 020°. The schistose mudstones are seen to be affected by D2 minor folds, folding a stretching lineation trending 110°. These rocks are typical of the finely laminated lithology of the New Harbour Formation, except that they have a black sheen, owing to the concentration of opaque minerals as seen in locality A. Typical New Harbour Formation schistose mudstones without this sheen, and with only a minor opaque mineral content, are seen a further 80 m to the south (Fig. 10a (iii)) [SH 2360 8055] and from thereon to the south.
3.b.2. Locality B′
The boundary of the Rhoscolyn Formation with the New Harbour Formation is also seen in crags [SH 242 805] 300m to the southeast, at B′ (Figs 1c, 3, 10a (iv)). This locality again embraces exposures named by Shackleton (Reference Shackleton and Wood1969, pp 6–7). Here the tuffs, comprising alternating laminae rich in opaque minerals and carbonate, are seen structurally beneath Rhoscolyn Formation sandstones, the boundary dipping 080°/44°N. D2 folds in the New Harbour Formation schistose laminated mudstones and tuffs trend between 080° and 120° with N vergence. They fold a strongly developed quartz stretching lineation (typically 20°/145°) on the flatter limbs of the folds. Most importantly, a penetrative S1 cleavage is seen in exposures of the Rhoscolyn Formation above the boundary [SH 2425 8065]; the cleavage dips at a lower angle (e.g. 056°/45°NW) than bedding (e.g. 056°/52°NW), consistent with the position of these exposures on the overturned limb of a major D1 anticline, facing up to the southeast (Fig. 3). The boundary is seen again (Fig. 10a (v)), displaced by a fault trending NNE. The stratigraphy for B and B′ is summarized in Figure 7.
3.c. Tŵr, locality C
These outcrops occur southeast of the South Stack to Holyhead road, in open land [SH 231 821] near a footpath leading southeast from the farm called Tŵr, at the foot of Holyhead Mountain. Here the main outcrop of the Rhoscolyn Formation (Fig. 10b (i)) is seen as a ridge of prominent outcrops of a white sandstone, vertical-dipping, NE-striking (058°), while 150 m to their southeast is a continuous cliff-like exposure of the schistose mudstones of the New Harbour Formation (Fig. 10b (iii)). Between these two areas of continuous outcrop there are only scattered outcrops (Fig. 10b (ii)) of the lithologies that characterize the upper Rhoscolyn Formation and the New Harbour Formation near the boundary, as seen at Borth Wen and the Porth Dafarch Road localities (A, B). At around [SH 2307 8205], 30 m southeast of the principal outcrop ridge (Fig. 10b (i)) of the Rhoscolyn Formation, the sandstones begin to show a progressively stronger schistosity as their original mud content increases. A penetrative S1 cleavage dips more steeply southeast than bedding (060°/40°SE), and a strong stretching quartz lineation pitches down dip. In the scattered outcrops of these schistose sandstones there are outcrops showing flattened (20 cm long) chloritic, haematite-rich lenses, strongly elongated down dip. Within 50 m of the main cliff of New Harbour Formation schistose mudstones (Fig. 9a), scattered outcrops of the tuff are seen, and in one outcrop (Fig. 10b (ii)) the tuff is seen beneath, and grading into the New Harbour Formation mudstones above, dipping 30°SE. The tuff is the typical tough, black, feldspathic, calcitic laminated lithology, as seen in localities A and B, described in Sections 3.a and 3.b.
The principal exposures of the New Harbour Formation mudstones are seen 20 m to the southeast of this outcrop in a continuously exposed cliff-section (Figs 9a, 10b (iii)), running NE to SW from [SH 2305 8190]. These typical finely laminated mudstones comprise alternations of quartz/feldspar- and chlorite/muscovite-rich millimetre-thick laminae, but are unusually haematite-rich compared with the normal New Harbour Formation lithology, giving them a characteristic black sheen in the field. They exhibit SE-verging D2 folds (Fig. 9a), with a sheet-dip estimated to be 30°SE, similar to that of the tuff contact described above, and taken as representative of the boundary between the Rhoscolyn Formation and the New Harbour Formation here. These folds deform a strongly developed quartz stretching lineation, trending 130° on their flat limbs. Isoclinal D1 folds are seen rarely (Fig. 9b), but exhibit no clear vergence, and neither ‘way-up’ nor bedding/S1 relations have been determined. The typical New Harbour Formation mudstones are seen in prominent ridges further to the southeast (Fig. 10b (iv)), but the precise position of the boundary with the haematite-rich lithology has not been established. The lithologies are represented, stratigraphically, in Figure 7, Log C.
3.d. Holyhead Breakwater, locality D
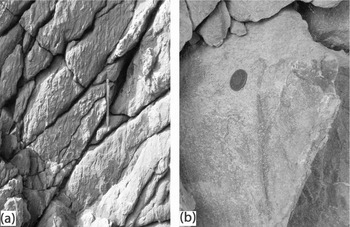
The Rhoscolyn Formation and the New Harbour Formation, respectively, are exposed on the two sides of a bay on the west side of Holyhead Breakwater, with a 40 m gap between them. On the cliff-top to the west of the bay (Fig. 10c (i)), the Rhoscolyn Formation greyish-white sandstones dip SE (050°/65°SE), with a weak anastamosing S1 cleavage (e.g. 052°/80°SE); they are well exposed, becoming more schistose southeastwards towards the cliff edge [SH 2355 8380]. In these exposures Skolithos burrows can locally be detected. On the cliff face below (Fig. 10c (ii)), the honey-coloured rocks again dip steeply SE but here with a well-developed S1 cleavage now dipping steeply NW (065°/80°NW) (Fig. 11a). In these cliff exposures the Skolithos burrows are well exposed in an interval some 20 m thick. The burrows, 5–10 mm across and up to 10 cm long, are prominent, sub-perpendicular to bedding and S1, and are well seen on the cleavage surfaces (Fig. 11b). The tubes consist of a finer-grained whiter sandstone than the surrounding cream sandstone. The predominant orientation in sections perpendicular to bedding and cleavage is sub-parallel to S1, consistent with an original orientation perpendicular to bedding (see Treagus, Reference Treagus1999). However, a more variable orientation is seen on some S1 surfaces, suggesting slight variations in original burrow orientations. Their preservation during the D1 cleavage-forming deformation might indicate a somewhat flattening (oblate) D1 strain ellipsoid.
Rhoscolyn Formation quartzites northwest of the Holyhead Breakwater, at location (ii) of Figure 10c. (a) View looking approximately W at cliff face; trace of S1 cleavage is vertical, parallel to pen (15 cm long), bedding trace is approximately 45° down to left. Skolithos shows in relief, with an orientation dominantly sub-parallel to the S1 trace. (b) Skolithos seen on S1 cleavage surface, coin 2 cm diameter.

The most southeasterly exposures on the shore, and the uppermost stratigraphically, are white sandstone that locally contains white quartzite pebbles 5 mm–2 cm in diameter. To their southeast, across an unexposed 40 m wide beach, New Harbour Formation schistose mudstones are seen in reefs on the shore (Fig. 10c (iii)) and on the cliff at their back, as far as the breakwater [SH 236 837]. These mudstones are typical of the New Harbour Formation, with the lustrous sheen, attributed to the presence of haematite, as described in localities A, B and C immediately above the tuffs, which here are unexposed. The schistose mudstones are affected by D2 minor folds, with varying axial trend between 040° and 090° and verging SE to S, which fold a quartz stretching lineation trending 130°. Some 10 m to the northeast, the typical regional New Harbour Formation lithology, without the lustrous sheen, is exposed on the side of the breakwater (Fig. 10c (iv)) [SH 2364 8380]; this unit must be displaced by a NW-trending fault as shown in Figure 10c. They are strongly affected by D2 folds, here up to 3 m in wavelength, verging SE, as described and illustrated for Borth Wen (Figs 6, 8) and Tŵr (Fig. 9). Isoclinal D1 closures are rarely seen in the New Harbour Formation here, but offer no indication of their overall vergence. The lithological and stratigraphic information for this locality is simplified in Figure 7, Log D.
4. Discussion: tectonic structure
Summarizing from our introduction (see Fig. 2), the boundary between the Rhoscolyn Formation and the New Harbour Formation in the Monian Supergroup of Anglesey, North Wales, has been interpreted previously in three different ways. (1) Greenly (Reference Greenly1919, Reference Greenly1923) considered it a true sedimentary boundary, with unbroken sedimentation from the Rhoscolyn Formation (his South Stack Series) into the New Harbour Formation; as did Shackleton (Reference Shackleton and Wood1969) in his revision of the stratigraphy. (2) Barber & Max (Reference Barber and Max1979) proposed a major structural discordance at this boundary, with the more highly deformed New Harbour Formation (which they considered older and already deformed) thrust over the Rhoscolyn Formation before the South Stack Group began its deformation history. (3) Phillips (Reference Phillips1991a ,Reference Phillips b ) proposed that the boundary was a tectonized sedimentary contact, describing it as a high strain/highly sheared zone.
Our descriptions of the Rhoscolyn Formation/New Harbour Formation boundary at four key localities on Holy Island, Anglesey, demonstrate that there is indeed sedimentary continuity at the boundary, supporting (1) above. We provide particular detail for locality A at Borth Wen, Rhoscolyn, because this is the best place to observe continuity in sedimentation and in structures. Here, we found no evidence of unusually high strain in the vicinity of the boundary, nor at any of the other localities we describe. Importantly, there is no evidence of shear-related structures, such as might be seen in a brittle or ductile shear zone: no asymmetric shear criteria, either in outcrop or thin-section, no significant fractures, and no S-C fabrics or mylonitic textures that would indicate high strain or shear. Instead, there is a simple upward progression of depositional units. The top of the Rhoscolyn Formation sandstones have a clear sedimentary boundary with haematite-rich mudstones (1–2 m), overlain by a tuff unit (2–5 m), and then by the thinly laminated mudstones of the New Harbour Formation. This formation is haematite-rich for several metres, before taking on its more usual characteristics (quartz-chlorite-muscovite schist).
Our thin-section studies of the New Harbour Formation, from its stratigraphically lowermost localities in this paper, and from exposures of New Harbour Formation throughout its succession in W Anglesey, do not support the description in Barber & Max (Reference Barber and Max1979, p. 415) that these rocks have an ‘intense planar schistosity which is frequently mylonitic’. Their interpretation was that ‘deformation has separated the grit bands into thin lenticles by transposition and pressure solution, giving a typical “flaser” appearance to the bedding’. Instead, we conclude that the New Harbour Formation generally preserves a thin sedimentary lamination originally comprising graded silt–mud couplets (Fig. 8b). In places this lamination defines millimetric to centimetric isoclinal folds to which the main schistosity/foliation (S1) can be seen to be axial-planar in thin-section (Fig. 8a). It is this original sedimentary lamination that has been interpreted by others as an early tectonic fabric, leading them to interpret the main foliation as S2 and the later folds as D3 (Cosgrove, Reference Cosgrove1980; Hudson & Stowell, Reference Hudson and Stowell1997; Passchier, Reference Passchier2007). However, this is not our interpretation. We consider the main foliation is S1, as shown in Figure 8, and the pervasive lineation on these surfaces to be L1, so that the later folds are D2. These conclusions thus conform with our two-phase interpretation of structures in the South Stack Group in the Rhoscolyn Anticline (Treagus, Treagus & Droop, Reference Treagus, Treagus and Droop2003). We conclude that the Rhoscolyn Formation and New Harbour Formation were stratigraphically conformable and that they share a two-phase deformation. The second deformation (D2) shows far more obvious continuity in folds and fabrics across the boundary than the first deformation (D1), a point that is highly relevant to previous structural interpretations, as acknowledged in our introduction.
This is not the place to present a full interpretation of the structures in the New Harbour Formation on Anglesey. However, it is relevant to acknowledge the complexity and possible ambiguity of early structures in the New Harbour Formation that pre-date the SE-verging folds that we label D2. In the South Stack Group, there are clear large-scale D1 folds, such as the much-studied Rhoscolyn Anticline introduced earlier. The size and geometry of the D1 folds is presumably controlled by competent sandstone beds, which have different thicknesses and abundances in the South Stack Formation, Holyhead Quartzite Formation and Rhoscolyn Formation. In contrast, the New Harbour Formation lacks thick sandstone beds and therefore the competence contrasts that might lead to the large-scale D1 structures seen in the underlying stratigraphy. Most of the folds we have recorded in the New Harbour Formation are less than 20 cm in wavelength, and many are on a millimetre scale (Fig. 8a). However, because the D1 deformation was associated with the development of a penetrative S1 foliation throughout the South Stack Group and New Harbour Formation, the later D2 deformation that folds this S1 foliation (as well as bedding), and produces an S2 crenulation cleavage, can easily be correlated from the South Stack Group into the New Harbour Formation.
The appearance of several orientations and styles of early folds in the New Harbour Formation, and their variable relationship to the main foliation and lineation, might at first suggest more than one ‘phase’ of deformation before the later (our D2) deformation. This was one reason that Barber & Max (Reference Barber and Max1979) considered the New Harbour Formation older, having suffered a prior deformation before being emplaced over the Rhoscolyn Formation. However, four contributors to the discussion of this paper (Wood, Powell, Maltman & Gibbons in Barber & Max, Reference Barber and Max1979) disagreed. They suggested how and why the South Stack Group and the New Harbour Formation could have shared the same D1 deformation, manifested differently in the different units because of their rheological contrasts. Maltman specifically suggested that the fine sedimentary layering of the New Harbour Formation caused smaller D1 folds to develop (e.g. small-scale chevron folds and conjugate pairs) than those in the underlying thick bedded units of the Rhoscolyn Formation. He argued that every different fold and cleavage orientation on the small scale should not be interpreted as a different tectonic event. We follow the same reasoning, and consider that the New Harbour Formation sediment was initially thinly laminated silt–mud couplets, possessing sufficient rheological anisotropy to develop a range of microscopic to mesoscopic D1 folds and banded structures, as predicted for anisotropic materials (Cobbold, Cosgrove & Summers, Reference Cobbold, Cosgrove and Summers1971; Treagus, Reference Treagus2003). Because of the significant D2 deformation imposed on these rocks (estimated from the Rhoscolyn Anticline as a plane strain ellipse in the anticline profile section, with axial ratio ≈ 3; Treagus, Treagus & Droop, Reference Treagus, Treagus and Droop2003), the present appearance of all these D1 structures in the New Harbour Formation will have been much modified. They are seen now as isoclinal folds of millimetre-scale bedding (Figs 8a, 9b), or microlithons that are remnant hinge zones or kink bands.
This investigation into the nature of the New Harbour Formation/Rhoscolyn Formation boundary has enabled us to construct a new cross-section (Fig. 3) of the Monian succession along the length of Holy Island. There is a clear contrast between the steeply upward NW-facing D1 structures at localities D and C, and the steeply upward SE-facing structures at localities B and A. This contrast reveals the presence of an intervening major D1 syncline, which we propose to call the Holyhead Syncline, of the same generation as the well-known D1 Rhoscolyn Anticline in the southeast of Holy Island. The geometry of the syncline has no doubt been modified by the D2 deformation, in the manner described for the Rhoscolyn Anticline (Treagus, Treagus & Droop, Reference Treagus, Treagus and Droop2003). To the southeast of the Holyhead Syncline we have identified the presence of a further D1 anticline (at locality B, B′), verging to the SE, that we propose to call the Kingsland Anticline, after that district of Holyhead through which the axial trace passes. Other major D1 fold-traces presumably pass through the broadly synclinal intervening ground occupied by the stratigraphically intractable New Harbour Formation (Fig. 3), where the deformation is dominated by the later (D2) folding.
5. Discussion: depositional transition and environments
5.a. The Rhoscolyn/New Harbour Formation boundary
Although there is a significant sedimentary contrast between the thickly bedded Rhoscolyn Formation and the thinly laminated New Harbour Formation, we conclude that there is continuity of sedimentation across the boundary. One subtle indicator is the presence of fine-grained haematite as widely scattered flakes within the top 3 m of the Rhoscolyn Formation quartzite and in the lowermost few metres of the New Harbour Formation schist. It is sufficiently concentrated to give an unusually dark colour to the New Harbour Formation schistose mudstones above the tuff horizon, for up to ~5 m above the boundary. The boundary is also consistently marked by the tuff horizon of Greenly (Reference Greenly1919), just within the base of the New Harbour Formation. The tuff, whose mineralogy has been described in detail at Borth Wen (locality A), contains albite > quartz, plus haematite, chlorite, ankerite and heavy minerals, and has the texture, mineralogy and composition of a fine tuff derived from a basic igneous melt. Greenly (Reference Greenly1919, p.157) noted that the tuff can be observed at this stratigraphic level at more than 20 places on Holy Island, precluding the possibility that the base of the New Harbour Formation is a thrust.
5.b. The Rhoscolyn Formation
Our new observations are consistent with the interpretation of Phillips (Reference Phillips1991a ) that the Rhoscolyn Formation comprises turbidites deposited in a mid-fan setting. Supporting evidence in the sandstone beds for a turbidite origin includes their lateral continuity, their sharp bases, the upward grading from coarser to finer sand, the sporadic ripple cross-lamination and the upward gradation into capping mudstones. Observations of mudstone rafts within some sandstone beds are interpreted as rip-up clasts of partially consolidated mudstone. The turbidity flows concerned were therefore energetic enough to erode along their depositional pathway, and had grain concentrations high enough for mudstone clasts to be suspended within the flow (Lowe, Reference Lowe1979) rather than being low-concentration flows (Bouma, Reference Bouma1962).
The lenticular bodies of matrix-supported conglomerate observed at the Borth Wen locality are here interpreted as debris flows. The bodies lack erosional channelized bases, so their lenticular form is interpreted instead as the cross-sectional geometry of lobate debris flows with positive relief. The clasts are entirely of Rhoscolyn Formation lithologies, and the matrix is, as far as can be deduced in its metamorphosed state, compositionally similar to the turbidite mudstones capping the graded sandstone beds. The debris flows need not, therefore, be far-travelled and could even be the locally remobilized tops of recently deposited turbidites.
Association of turbidites and debrites is well described in the literature. Debrites are classically assigned to an inner fan setting (Walker, Reference Walker1976) such as the slope apron examples in Wales from the Yr Allt Formation (upper Ordovician) (Davies et al. Reference Davies, Fletcher, Waters, Wilson, Woodhall and Zalasiewicz1997), but they are now known from mid-fan settings too. The best such examples in Wales come from the Aberystwyth Grits Group of Silurian age (Talling et al. Reference Talling, Amy, Wynn, Peakall and Robinson2004), where the debrites are considered to be deposited along with the turbidites as hybrid flows. Another example, geographically and stratigraphically closer to the Rhoscolyn Formation, is in the lower Ordovician Lady Port Formation of the Manx Group, Isle of Man (Woodcock & Morris, Reference Woodcock, Morris, Woodcock, Quirk, Fitches and Barnes1999). Given such examples, there is certainly no need to invoke a shallow-water origin for the Rhoscolyn Formation conglomerates: in a shallow-water setting, they would be more obviously clast-supported.
Apparently in conflict with a deep-water origin for the Rhoscolyn Formation are the supposedly shallow-marine Skolithos burrows observed at the Holyhead Breakwater (locality D). Greenly (Reference Greenly1919) and Barber & Max (Reference Barber and Max1979) have recorded rare Skolithos also from the South Stack Formation. McIlroy & Horák (Reference McIlroy, Horák, Brenchley and Rawson2006) record hummocky and swaley cross-stratification from the Holyhead Formation and therefore suggest a shelfal storm sands origin for this and the South Stack Formation. However, although vertical burrows of the Skolithos ichnofacies are most common in nearshore marine shelf environments and in mid-shelfal storm sands, they occur, exceptionally, in deep-water turbidites (e.g. Frey, Pemberton & Saunders, Reference Frey, Pemberton and Saunders1990; Pemberton, MacEachern & Frey, Reference Pemberton, MacEachern, Frey, Walker and James1992). They can be made in the tops of turbidites by ‘doomed pioneers’ (Föllmi & Grimm, Reference Föllmi and Grimm1990): shallow-water organisms carried by turbidity flows into deep and even anoxic water. Therefore, we continue to interpret the Rhoscolyn Formation as deposited in deep water, that is, below storm wave base, until more persuasive evidence accumulates.
5.c. New Harbour Formation
Our new observations of sporadic siltstone–mudstone couplets in the New Harbour Formation have shown that some couplets are sharp based and graded from silt up to mud, but the polyphase structural complexity obscures their usefulness in determining regional way-up in these rocks. We interpret each couplet as a discrete depositional event from a low-concentration density flow with velocities that waned during deposition. A fine-grained component from vertical fallout of suspended hemipelagic sediment cannot be excluded, but the diagnostic very fine lamination would be obliterated by recrystallization. In the absence of other sedimentary structures, it is impossible to deduce palaeo-water depth from such a facies. However, no vertical burrows are preserved, implying that the sediment–water interface was either too deep or too low in oxygen to support an infauna.
Laminated facies like that of the New Harbour Formation are common in turbidite basins. They are particularly widespread in the belt of Cambro-Ordovician rocks from the Skiddaw Group of NW England through the Manx Group of the Isle of Man to the Ribband Group of SE Ireland. Examples of the facies are the Kirk Stile Formation in the Skiddaw Group (Cooper et al. Reference Cooper, Rushton, Molyneux, Hughes, Moore and Webb1995), the Maughold Formation and fine-grained components of the Lady Port Formation in the Manx Group (Woodcock et al. Reference Woodcock, Morris, Quirk, Barnes, Burnett, Fitches, Kennan, Power, Woodcock, Quirk, Fitches and Barnes1999; Woodcock & Morris, Reference Woodcock, Morris, Woodcock, Quirk, Fitches and Barnes1999), and the Riverchapel or Maulin formations in the Ribband Group (McConnell, Morris & Kennan, Reference McConnell, Morris, Kennan, Woodcock, Quirk, Fitches and Barnes1999).
The origin of the haematite-rich variant of the New Harbour Formation is unclear. One possibility is that the iron was originally fixed by diagenesis as dispersed pyrite rather than haematite, only later to be oxidized during metamorphism. This hypothesis is consistent with enhanced dysaerobic conditions in the basinal bottom waters at the time of the Rhoscolyn Formation/New Harbour Formation boundary. A similar interpretation could apply also to the haematite-rich part of the Rhoscolyn Formation below the boundary.
The tuff near the base of the New Harbour Formation was presumably deposited in the same deep, quiescent and possibly anoxic bottom waters as the New Harbour Formation. The lack of any cross-lamination suggests that any lateral flow velocities during deposition were below the threshold for forming ripples. However, the well-developed depositional lamination implies that deposition either took place in a succession of low-volume events or possibly as one high-volume event with a pulsed sediment delivery through time.
5.d. The Rhoscolyn/New Harbour transition
On our favoured interpretation that both the Rhoscolyn Formation and New Harbour Formation were deposited as deep-water turbidites and possible associated hemipelagic fallout, the boundary represents a major shut-down or diversion of sand supply in the Monian depositional basin. In general, such a change could either represent a major sea-level rise, or the tectonically induced isolation of the former quartz-rich source area. Phillips (Reference Phillips1991a ) deduced that the South Stack Group had been supplied with quartz sand from the southeast, whereas the New Harbour Group had been sourced from a volcanic arc. This provenance for the New Harbour Formation awaits confirmation from the type New Harbour Formation on Holy Island. It is tempting, but too simplistic, to take the basaltic tuff near the base of the New Harbour Formation to indicate the onset of arc volcanism, and to blame associated tectonics for diverting the quartz-rich source for the sand turbidites of the Rhoscolyn Formation.
6. Conclusions
(1) New observations from key locations on Holy Island, Anglesey, of the boundary between the Rhoscolyn Formation (South Stack Group) and the overlying New Harbour Formation demonstrate stratigraphic conformity and continuity in sedimentation.
(2) The Rhoscolyn Formation preserves medium to thickly bedded graded sandstone–mudstone beds with sporadic lenticular matrix-supported conglomerates. These were probably deposited as turbidites and debrites below storm wave base, though occasional vertical burrows need special explanation.
(3) The New Harbour Formation mostly preserves laminated mudstones, comprising graded silt–mud couplets. These record intermittent deposition from low-concentration sediment flows, almost certainly turbidites, in uncertain water depths.
(4) The basal 10 m of the New Harbour Formation tends to be rich in haematite and to include a laminated tuff unit.
(5) No evidence is found for a tectonic boundary between the Rhoscolyn Formation and New Harbour Formation, such as a thrust or shear zone, as described in some previous studies.
(6) Changes in scale and style of first deformation (D1) structures in the Rhoscolyn Formation and New Harbour Formation across the boundary are explained by differences in bed thickness between the two formations, leading to differences in their rheology and anisotropy during D1 and its related metamorphism.
(7) The later (D2) deformation shows continuity in style of folds and fabrics across the transitional boundary, confirming a shared tectonic history.
(8) Mapping around the key localities of the boundary of the Rhoscolyn Formation and New Harbour Formation leads to a new cross-section of major D1 folds on Holy Island. We identify two new major folds, the Kingsland Anticline and the Holyhead Syncline, and a marked change in facing direction along the line of section.
Acknowledgements
We acknowledge use of facilities in SEAES, University of Manchester, over many years. We particularly thank Giles Droop and Richard Pattrick for their advice on the mineralogy in the tuff and New Harbour Formation schists. Thanks also go to Richard Lisle for pointing out newly exposed conglomerate at Borthwen, in 2002. We appreciate the comments of referees on earlier versions of this work and particularly thank David Schofield for his careful review of the present version.