I. INTRODUCTION
Ni–Fe–Cr alloy 028 (alloy 028) is one of the high-alloyed corrosion resistant steel grades, which is widely used in petrochemical and chemical industries. Some of its applications include evaporator tubes used in the phosphoric acid production; production tubing, casing, and liners in deep and sour gas wells; heat exchangers in nuclear power plants, and seawater-carrying piping and seawater-cooled heat exchangers. Reference Bankiewicz, Vainikka, Lindberg, Frantsi, Silvennoinen, Yrjas and Hupa1–Reference Bellezze, Roventi and Fratesi5 The alloy is selected for such applications mainly because of its excellent combination of corrosion resistance and cost-effectiveness. The presence of the nickel-based austenitic structure elevates its ductility and failure resistance related to thermal and mechanical stresses. Reference Kim, Mitton and Latanision6–Reference Panin, Pleshanov, Kobzeva and Burkova8 High percentages of chromium, molybdenum, and copper offer additional resistance to the acids and salts typically present in service environments. Reference Da Cunha Belo, Hakiki and Ferreira9,Reference Yin, Zhao, Lai and Zhao10 Moreover, alloy 028 is considered cost effective due to its higher amount of iron compared with other similar alloys.
It is known that the presence of chloride ions (Cl−) can both inhibit and accelerate the dissolution of metals, Reference Wasberg and Horányi11,Reference Abd EI-Haleem and Abd EI-Wanees12 since the Cl− ion has a relatively small radius and strong penetration properties. Localized corrosion, such as pitting or crevice type could occur in the presence of Cl−. An abundance of literature and data shows that the deceleration effect is often related to the concentrations of Cl−. Reference Cardoso, Amaral and Martini13–Reference Zhao, Liu, Song and Atrens17 Mahmoud reports that the pitting potential shifts to more negative values with an increase in concentration of NaCl for Cu–Fe alloy. Reference Mahmoud16 The corrosion rate of Mg alloys usually increases with the increase of Cl− ion concentration. Reference Altun and Sen14,Reference Zhao, Liu, Song and Atrens17
Researchers have investigated the general corrosion behavior and electrochemical properties of alloy 028 in various media. Bellezze et al. studied the heating-element sheathing and measured the corrosion potential (E corr), pitting potential (E pit), and protection potential (E pro) of alloy 028 under Cl− ion environment. Reference Bellezze, Roventi and Fratesi5 Cheng et al. studied several compositions and structures of passive films formed on the surface in a high temperature environment containing different partial pressures of CO2 and H2S. Reference Chen, Jiang, Zhang, Zheng and Ge18 The results obtained with an energy dispersive spectrometer (EDS) and x-ray photoelectron spectroscope (XPS) showed the higher sulfur content in the areas where pitting corrosion occurred. Wei et al. studied the electrochemical and semiconductive properties of the passive protective film formed on the surface of alloy 028. Reference Wei, Zhao, Liu and Cai19
Generally, the microstructural characteristics of alloys strongly influence their performances. Reference Lin and Tsai20–Reference Yang, Yan, Wang and Yin24 In many heavily alloyed steels, a variety of desired and nondesired precipitates inevitably form during heat treatments and welding processes, which could greatly affect the mechanical properties and corrosion resistance of the steels. Reference Akisanya, Obi and Renton25–Reference Koutsoukis, Redjaïmia and Fourlaris27 The alloy 028 is one of the prime examples where the two common phases σ and carbide (M23C6) precipitates form during heat treatment. The σ phase is a brittle intermetallic Fe–Cr phase with a tetragonal crystal structure. Many elements such as Fe, Cr, Mo, and Ni could be beneficial for the formation of σ phase. Reference Wang, Liu, Bao and Cheng28 The adverse effects of σ and carbide phases on the corrosion behavior of the stainless steel grades have been investigated. Reference Lin and Tsai20,Reference Akisanya, Obi and Renton25,Reference Koutsoukis, Redjaïmia and Fourlaris27,Reference Sahlaoui, Markhlouf, Sidhom and Philibert29–Reference Lo and Tsai31 Wasnik et al. reported that lower amount of chromium (less than 12–13%) at the depleted regions surrounding the grain boundaries induces the sensitization for stainless steels. Reference Wasnik, Kain, Samajdar, Verlinden and De32 However, only few reports are available on the effect of heat treatment parameters on the microstructure, mechanical property, and corrosion behavior of alloy 028.
In this study, the microstructure evolution of alloy 028 subjected to solution treatment at 1200 °C for half an hour followed by aging treatments from 850 to 950 °C for different durations of time was investigated. The techniques of potentiodynamic polarization and electrochemical impedance spectroscopy (EIS) were applied to evaluate the localized corrosion behavior of the different microstructures.
II. EXPERIMENTAL
A. Material and heat treatments
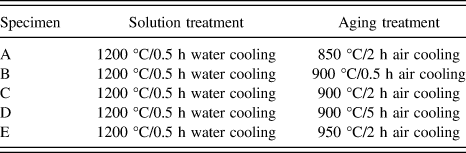
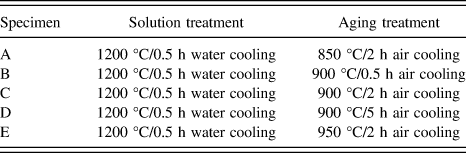
The ingot was obtained by melting the tested material in an electric arc furnace (EAF) under an argon atmosphere, followed by forging and hot extrusion. The chemical composition is listed in Table I. The material was then heat treated according to Table II, through solution annealing at 1200 °C for half an hour followed by aging at different temperatures.
Chemical composition of alloy 028 (wt%).

Heat treatments of alloy 028.
B. Experimental procedure
The specimens for the microstructure observation were mechanically polished with silicon paper up to 1 µm, followed by electrolytic polishing and etching in 80 mL CH3OH + 20 mL H2SO4, 100 mL HCl + 3 g oxalic acid, respectively. The microstructure was investigated using optical microscopy and scanning electron microscopy (SEM). The chemical composition of precipitated phases was identified by energy dispersive spectroscopy (EDS). The quantitative analysis of precipitates was conducted through the image-analysis software. The predetermination of precipitation behavior was calculated by the Thermo-Calc software.
In addition, the influence of heat treatment on the hardness of alloy 028 was measured at different locations using the Mitutoyo MVK-H1 hardness tester at a load of 200 g. The mean value of 9 measurements was reported for each sample.
Electrochemical corrosion tests were performed on mechanically polished samples (up to 1 µm polishing). Prior to each experiment, samples were rinsed with distilled water and placed in an acetone ultrasonic bath for 5 min. The test solution was a 0.5 mol/L neutral sodium chloride (NaCl) solution. The three conventional electrodes were selected for these electrochemical experiments. A standard calomel electrode (SCE) and a graphite plate were used as the reference and counter electrodes, respectively. Data acquisition and analysis were performed using Gamry Interface 1000 Potentiostat. The potentiodynamic polarization tests were carried out with a scan rate of 1 mV/s for obtaining polarization curves that were then applied to characterize the corrosion potential (E corr), corrosion current density (i corr), and corrosion rate during these processes. The EIS spectra were recorded in the frequency range from 100 kHz to 0.1 Hz at the AC potential amplitude of 10 mV. All experiments were conducted at room temperature (around 25 °C) and repeated three times to ensure the reproducibility.
All specimens were submitted to optical microscopy and SEM investigations prior and after the corrosion experiments, steps were undertaken to investigate whether the morphology of corrosion exhibited a consistency with the electrochemical results.
III. RESULTS AND DISCUSSION
A. Microstructure analysis
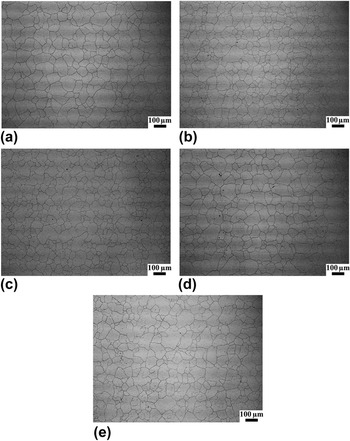
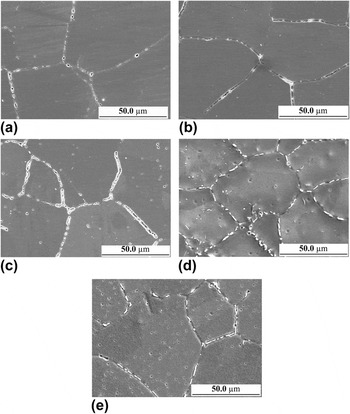
Figure 1 presents the optical images of microstructure characteristics of alloy 028. The influence of heat treatments (Table II) on grain size is small. The average grain size of the specimens that underwent the identified solution treatment and different aging treatments is around 68 µm. As it is possible to exclude the influence of grain size on the performance of this alloy.
Optical images of the specimens after different heat treatments: (a) heat treatment A; (b) heat treatment B; (c) heat treatment C; (d) heat treatment D; (e) heat treatment E.

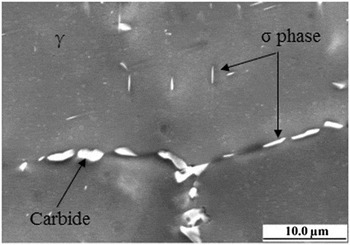
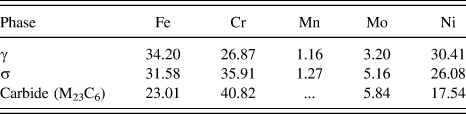
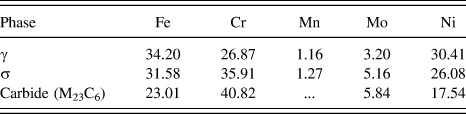
However, SEM analysis results show that some precipitates appear in grains and some at grain boundaries. The chemical composition of the precipitates was identified by EDS. Figure 2 illustrates a SEM micrograph of different phases of the specimen D (exposed to the heat treatment D), and the element content of these phases is listed in Table III. As shown, σ phase and carbides are richer in Cr and Mo contents compared to the austenitic matrix.
SEM micrograph of specimen D.

EDS results of the major chemical composition of various phases of specimen D (wt%).
The precipitation behavior of alloy 028, illustrated in Fig. 3, went through different aging treatments. Some small granular carbide and short rod-like shaped σ phases are present in chain structures at the grain boundaries after a thermal treatment at 850 °C for 2 h, as shown in Fig. 3(a). The precipitation behavior of the specimens aged at 900 °C for 0.5 to 5 h is given in Figs. 3(b)–3(d): σ phase precipitates at grain boundaries have quite small and short rod shape structures after 0.5 h of aging [Fig. 3(b)]. Following 2 h of aging, the σ particles are coarser and are distributed more continuously at grain boundaries, with a few needle-like σ phase precipitates observed in grains, and moreover, some granular carbide phases are observed at the grain boundaries [Fig. 3(c)]. By extending the aging time to 5 h, the number of coarse and needle-like precipitates increases both at the grain boundaries and in grains [Fig. 3(d)]. The precipitates prefer also to appear discontinuously at grain boundaries in short structures after 2 h of aging at 950 °C as shown in Fig. 3(e).
Microstructures of the specimens after different heat treatments: (a) heat treatment A; (b) heat treatment B; (c) heat treatment C; (d) heat treatment D; (e) heat treatment E.

Based on the above analysis, we can summarize that firstly, precipitates intermittently distribute at the grain boundaries. The σ phase has a shape of short rod-like structure, and the carbide prefers assuming a particle structure. Then, the precipitates evolve into coarser structures and finally arrange into chain structures with prolonging the holding time. Additionally, σ phase is sporadically present within grains, has needle-like shapes, and the amount of such structural configuration increases with extending aging time.
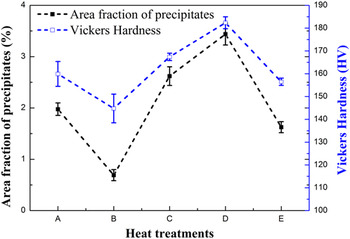
The influence of aging time and temperature on the quantity of precipitates is illustrated in Fig. 4. It is clear that by increasing the aging time at 900 °C, the area fraction of precipitates increases from 0.69 to 3.44%, implying the formation of more precipitates both in grains and at grain boundaries. On the other hand, for the same holding time (at 850, 900, and 950 °C), the area fraction of precipitates reaches its maximum at 900 °C meaning that the precipitation rate at 900 °C occurs more rapidly than at 850 and 950 °C. This is in agreement with a similar observation by Akisanya et al. Reference Akisanya, Obi and Renton25 and Lin et al. Reference Lin, Zhang, Shan and Song33
Influence of heat treatments on precipitation.

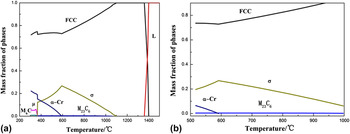
The thermodynamic calculations could be used for evaluation of precipitation behavior of the material. Figure 5 illustrates the calculated phase diagrams of alloy 028 by using the Thermo-Calc software. Reference Andersson, Helander, Höglund, Shi and Sundma34 As shown, the σ phase initially precipitates at 1090 °C and reaches the maximum around 600 °C. Carbide appears at 1060 °C, and its content remains quite low in the whole precipitation temperature range. In other words, the dominant factor of precipitation is σ phase.
Calculated phase diagrams of alloy 028 using Thermo-Calc software: (a) relationship of mass fraction of phases to temperature; (b) partial enlarged detail of (a).

At low temperatures, carbon solubility is low, and the thermodynamic driving force for precipitation is high. At higher temperatures, even though the carbon solubility and chromium diffusivity increase, the precipitation growth is ceased. Reference Beltran, Maldonado, Murr and Fisher35 Thus, the number of Cr-rich precipitates decreases with increasing temperature.
In equilibrium conditions, the amount of σ phase decreases with the temperature from 600 to 1090 °C. However, the experimental observations do not completely agree with the calculated results; i.e., for the same time duration at 850, 900, and 950 °C, the highest amount of precipitate is presented at 900 °C. This difference between the Thermo-Calc prediction and experimental results should be attributed to the kinetics of precipitates formation. Therefore, the precipitation is regarded as a kind of dynamic process and should balance various parameters such as the thermodynamic stability, kinetics, and ease of nucleation. Reference Beltran, Maldonado, Murr and Fisher35
B. Hardness
As an indication of changes of mechanical properties, the hardness of samples was measured. Figure 6 illustrates the mean values of Vickers hardness of samples that underwent heat treatment at different temperatures for various durations. Present results combined with the data on area fraction of precipitates provide a clear evidence that the increase of hardness depends on the fraction of precipitates in the investigated alloy. Sample D shows the maximum value of hardness which has the highest area fraction of precipitates compared with the other samples. Renton reported that the hardness of σ phase is almost twice as high as that for austenite. Reference Renton36 The influence of precipitates on hardness was confirmed by investigations of similar corrosion resistant stainless steels. Reference Angelini, De Benedetti and Rosalbino21,Reference Qu, Lang, Chen, Rong, Kang, Yang and Qin22,Reference Akisanya, Obi and Renton25,Reference Wallinder, Pan, Leygraf and Delblanc-Bauer37
Influence of precipitation on Vickers hardness.

C. Electrochemical analysis
1. Potentiodynamic polarization
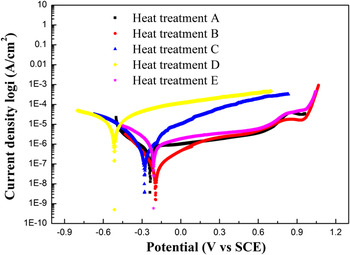
Figure 7 presents the potentiodynamic polarization curves of alloy 028 after various heat treatments. Obviously, the specimens demonstrate different electrochemical performances in a neutral 0.5 mol/L NaCl solution. A comparative evaluation shows that the E corr cathodically shifts when the aging time at 900 °C increases. The most negative value (−515 mV) is observed for specimen D. The E corr of specimen E is a little higher than specimen C and specimen A.
Potentiodynamic polarization curves in 0.5 mol/L NaCl solution at room temperature. The specimens were aged at different temperatures for various durations.

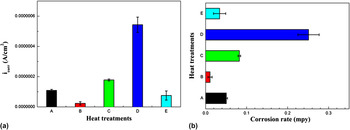
Figures 8(a) and 8(b) demonstrate the variation of the i corr and corrosion rate of the specimens after different aging treatments. The highest corrosion rate was obtained for specimen D with the i corr value of 5.43 × 10⁻⁷ A/cm2 [Fig. 8(a)]. Based on a number of investigations on similar materials, the results obtained suggest that precipitates are responsible for the deterioration of corrosion resistance. Reference Lin and Tsai20,Reference Angelini, De Benedetti and Rosalbino21,Reference Tavares, Moura, da Costa, Ferreira and Pardal23,Reference Yang, Yan, Wang and Yin24,Reference Hong, Han, Tan, Li and Jiang30,Reference Choi, Kim, Park and Park38 Comparing the variation of i corr [Fig. 8(a)], corrosion rate [Fig. 8(b)], and fraction of precipitates (Fig. 4) we can conclude that a small fraction of precipitates slightly affect the corrosion properties (specimen B). However when increasing the aging time, more and more coarse carbide and σ phase precipitates are formed in grains and at grain boundaries, and this greatly enhances the metal sensitivity to localized corrosion (specimen C and D). The lower i corr and corrosion rate of specimen E should be attributed to the higher aging temperature (950 °C) which allows to increase the diffusion of alloying elements such as Cr and Mo and consequently inhibits the formation of Cr or Mo-rich precipitates. Therefore, a thorough understanding of corrosion behavior of high-alloyed materials should be correlated to precipitation behavior.
Variations of (a) i corr and (b) corrosion rate of the specimens after different heat treatments.

2. Electrochemical impedance spectroscopy
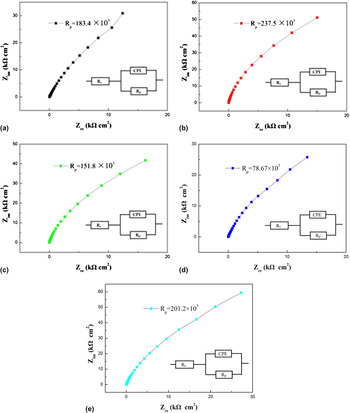
EIS, as a powerful nondestructive technique, offers a unique way to evaluate the corrosion resistance of materials. The Bode plots in Fig. 9 show the corrosion behavior of the specimens at open circuit potential in a neutral 0.5 mol/L NaCl solution. An equivalent circuit is used to evaluate the EIS spectra. In this model, R s presents the electrolyte or solution resistance; R p is the polarization resistance, used to measure the corrosion resistance of samples; the constant phase element (CPE) is used like a capacitor in a non-ideal situation. Reference Wallinder, Pan, Leygraf and Delblanc-Bauer37,Reference Trdan and Grum39 The relationship between the impedance of CPE (Z CPE) and the capacitance is given as the following:
 $${Z_{{\rm{CPE}}}} = {\left[ {C\left(\,{j{\omega ^{ - n}}} \right)} \right]^{ - 1}}\quad {\rm{,}}$$
where C is the magnitude of the CPE; j 2 = −1 is the imaginary number; ω is the angular frequency, and n is an exponential factor. When n = 0, the CPE resembles a resistor; when n = 1, the CPE acts as a pure capacitor, and n deviates from 1 under normal experimental conditions.
EIS spectra presented as Nyquist plots. The specimens subjected to different heat treatments: (a) heat treatment A; (b) heat treatment B; (c) heat treatment C; (d) heat treatment D; (e) heat treatment E.

In Fig. 9, the specimen with the lowest amount of precipitates exhibits the highest R p value [Fig. 9(b), R p = 237.5 × 10³ kΩ cm2], and with the increase of precipitate fraction, the R p gradually decreases [Figs. 9(e), 9(a), and 9(c)] which signals the deterioration of the corrosion prevention in the material. The R p of specimen D decreases by an order of magnitude [Fig. 9(d), R p = 78.67 × 10³ kΩ cm2]. These results obtained from EIS measurements are in agreement with the potentiodynamic polarization test results.
D. Corrosion mechanism analysis
The difference in corrosion behavior of the specimens can be explained on the basis of their microstructural characteristics. Based on our experimental results, it is notable that the Cr-rich precipitates preferentially occur at grain boundaries and this is associated with the presence of chromium-depleted zones surrounding these Cr-rich phases. Moreover, another significant structural characteristic is the morphology of the precipitates. Reference Zhao, Liu, Song and Atrens40–Reference Ralston, Birbilis, Weyland and Hutchinson42 If the precipitates are present as small and short structures at the grain boundaries, a discontinuous range of depleted zones in the vicinity of precipitates exists.
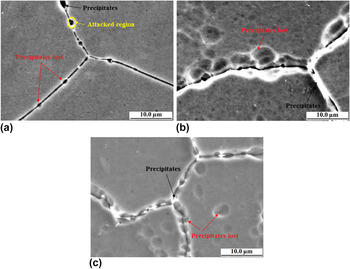
For more comprehensive understanding of the corrosion mechanism, the detailed characteristics of the corroded surfaces were analyzed by SEM. Figure 10 illustrates as the following. (1) The Cr-depleted region [the yellow enclosure in Fig. 10(a)] around precipitates is attacked by corrosion. (2) Some regions surrounding the granular precipitates are completely corroded and the precipitates are detached from the grain boundaries [indicated by red arrows in Fig. 10(a)]. (3) With increasing aging time, more and more coarse precipitates appear in grains and at grain boundaries, and these locations are easily attacked by the corrosive ions, and more particles are removed from grains and from grain boundaries leaving mouth-shaped crevices or shallow holes [evidence by red arrow in Fig. 10(b)]. (4) The existence of elongated structure of phases [as shown in black arrow in Figs. 10(b) and 10(c)] implies that these phases also undermine in the corrosion process. (5) Exacerbated effect of precipitates on corrosion resistance is accelerated when the amount of precipitates increases.
Surface morphology (SEM) of the specimens after the measurement of potentiodynamic polarization tests in 0.5 mol/L NaCl solution at room temperature. (a) Heat treatment B; (b) Heat treatment C; (c) Heat treatment D.

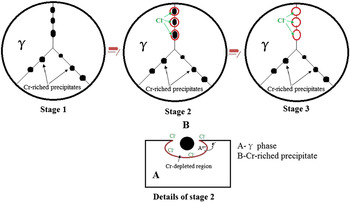
Based on the presented analysis, there is a galvanic effect of Cr-rich phase in the corrosion process. When a small fraction of short structures of Cr-rich phases precipitate at grain boundaries, these particles serve primarily as galvanic cathodes, while the Cr-depleted region around precipitates is anodic and is attacked by Cl− ions. This process can be illustrated in Fig. 11: (i) Cl− ions prefer to attack the matrix region around precipitates where Cr is depleted; (ii) This region is aggressively corroding; (iii) Finally, the precipitated granules detach from the grain boundaries. A similar phenomenon can be observed for the Cu-rich phase of alloy FeCoNiCrCu0.5. Reference Lin and Tsai20 An increase in the amount of precipitates with increasing aging time accelerates the microgalvanic corrosion which is interpreted as the increase of corrosion rate of the investigated alloy.
Schematic illustration of the corrosion process.

IV. CONCLUSIONS
From the study of microstructures and the performance of alloy 028 subjected to a series of heat treatments, the following conclusions can be drawn:
-
(1) The microstructural changes in the aged specimens have been investigated by the SEM, EDS, and image analysis. In terms of precipitation, the precipitates preferentially form at the grain boundaries, the carbides have granular structure, the σ phase forms short rod-like structures. With the increase of aging time, precipitates at grain boundaries are coarsening and also form continuous chain structures. Moreover, the needle-like σ phase is formed in grains with an increase of the holding time.
-
(2) For the identical duration of time, the specimen aged at 900 °C has more precipitates than the specimens after aging treatments at 850 and 950 °C.
-
(3) The hardness increases with the increase of area fraction of precipitates.
-
(4) The potentiodynamic polarization tests show that the i corr and corrosion rate increase by increasing the amount of precipitates, which means that the presence of precipitates deteriorates the corrosion resistance of alloy 028. The results obtained from the EIS test illustrate how the polarization resistance decreases with an increase in the amount of precipitates, which confirms the negative effect of precipitates on the corrosion resistance.
-
(5) The results reveal that the Cr-rich phase acts as a galvanic cathode, the Cr-depleted region that surrounds the precipitates is anodic and is aggressively corroded. Finally, the precipitates detach from the grains or grain boundaries leaving mouth-shaped crevices or shallow holes. Increasing aging time directly accelerates the microgalvanic corrosion which contributes to the increase of corrosion rate.
ACKNOWLEDGMENTS
This work is financially supported by Canadian National Science and Engineering Research Council (NSERC), the National High Technology Research and Development Program of China (863 Program: 2013AA031005), and the China Scholarship Council (CSC). The authors want to express sincere appreciation for these funding supports.