Motivation
Era of big data in materials science
Modern scientists perpetuate the scientific process embodied by the works of Tyco Brahe, Johannes Kepler, and Isaac Newton in the heliocentric revolution. Brahe was the observationalist. He took extensive, precise measurements of the position of planets over time. Kepler was the phenomenologist. From Brahe's measurements, he derived concise analytic expressions that describe the motion of the solar system in a succinct manner. Last, Newton was the theorist. He realized that the mechanism behind the apple falling from the tree is the same as that underlying planets traveling around the sun, which could be formulated into a universal law (Newtonian gravitational law). All three scientific modalities are vital in making scientific discoveries: data acquisition (Brahe), data analysis (Kepler), and derivation from first principles (Newton).
With recent advances in computer science, theoretical modeling, and experimental instrumentation, materials scientists have, in many ways, created a “mechanical Brahe” and marched into a new era of big data. Datasets of materials information, obtained from advanced characterization techniques,[Reference Deelman, Carothers, Mandal, Tierney, Vetter, Baldin, Castillo, Juve, Król, Lynch, Mayer, Meredith, Proffen, Ruth and da Silva1–Reference Ren, Pandolfi, Van Campen, Hexemer and Mehta3] combinatorial experiments,[Reference Stein, Guevarra, Newhouse, Soedarmadji and Gregoire4–Reference Green, Choi, Hattrick-Simpers, Joshi, Takeuchi, Barron, Campo, Chiang, Empedocles, Gregoire, Kusne, Martin, Mehta, Persson, Trautt, Van Duren and Zakutayev6] high-throughput first-principle simulations,[Reference Ye, Chen, Dwaraknath, Jain, Ong and Persson7,Reference Tanaka, Rajan and Wolverton8] literature mining,[Reference Kim, Huang, Saunders, McCallum, Ceder and Olivetti9,Reference Krallinger, Rabal, Lourenço, Oyarzabal and Valencia10] and other techniques, are created at a faster rate every day with less and less human labor. All of this data enables new opportunities to construct novel laws of phenomenological behavior for systems that previously lacked them.
Inspired by the Materials Genome Initiative,[11] the materials community is working collaboratively towards making digital materials data accessible to others. Multiple materials databases, such as Materials Project,[Reference Jain, Ong, Hautier, Chen, Richards, Dacek, Cholia, Gunter, Skinner, Ceder and Persson12] OQMD,[Reference Saal, Kirklin, Aykol, Meredig and Wolverton13] AFLOWLIB,[Reference Curtarolo, Setyawan, Wang, Xue, Yang, Taylor, Nelson, Hart, Sanvito, Buongiorno-Nardelli, Mingo and Levy14] OMDB,[Reference Borysov, Geilhufe and Balatsky15] AiiDA,[Reference Pizzi, Cepellotti, Sabatini, Marzari and Kozinsky16] Citrination and NOMAD, provide public access to millions of materials data points. Accessibility to an immense amount of materials data paves way for the next step of “automating Kepler” in the discovery of governing laws in materials processing–structure–properties–performance relationships, which could advance materials discovery, development, and technology innovation.
Since one of the fundamental research objectives of materials science and engineering is to deliver new materials with optimal performance under specified constraints, it is essential to understand how and which features govern the functionality. In other words, which degrees of freedom (or parameters) and their corresponding intrinsic relationships (or dependencies) to the material properties should be optimized. However, the multiscale nature of materials science,[Reference Alberi, Nardelli, Zakutayev, Mitas, Curtarolo, Jain, Fornari, Marzari, Takeuchi, Green, Kanatzidis, Toney, Butenko, Meredig, Lany, Kattner, Davydov, Toberer, Stevanovic, Walsh, Park, Aspuru-Guzik, Tabor, Nelson, Murphy, Setlur, Gregoire, Li, Xiao, Ludwig, Martin, Rappe, Wei and Perkins5] e.g., from atomic-scale crystal structure to complex mesoscale domain structures and bulk mechanical properties or from femtosecond laser probes to hour-long recrystallization reactions, makes it particularly challenging to study many hierarchical relationships of different materials families. Given such a high-dimensional parameter space (e.g., chemical composition, crystal structure, and external conditions), materials scientists often explore a finite subspace of all the factors that govern materials properties and performance. In addition, the available data are typically sparsely distributed. Although access to a large materials database relieves, in part, the limited-data problem, there is an urgent need for a robust data-processing protocol to help discern governing laws in materials science and to deliver designer materials and synthesis/processing procedures.
Alternative to machine learning methods
Much of the burgeoning field of materials informatics focuses on the aforementioned challenges. Machine learning (ML) models are currently the tools of choice for uncovering these physical laws. Although they have shown some promising performance in predicting materials properties,[Reference Zhuo, Tehrani, Oliynyk, Duke and Brgoch17] typical parameterized ML models are not conducive to the next stage of generalizing across domains—the ultimate goal of “automating Newton.”
It is important to note that Newton's challenge was somewhat made easier, because Kepler's laws were parsimonious yet predictive. In a modern context, ML models can be predictive but their descriptions are often too verbose (e.g., deep learning models with thousands of parameters) or mathematically restrictive (e.g., assuming that the target variable is a linear combination of input features). Such black-box models have become more prevalent in modern materials science research; however, the interpretability of such models has always been a problem. Although there is a large body of work on data visualization and model understanding to address these issues, those subjects will be out of the scope of this perspective (see Ref. Reference Hall and Gill18 for a review).
In this Prospective paper, we focus on an alternative to ML models: symbolic regression. Symbolic regression simultaneously searches for the optimal form of a function and set of parameters to the given problem and is a powerful regression technique when little if any a priori knowledge of the data structure/distribution is available.
Figure 1 shows the relative popularity of ML and symbolic regression in different research domains. We use data from the “Web of Science Core Collection” database in this analysis.[19] Among all publications whose topics are related to ML or symbolic regression, over 50% of the contributions come from the computer science research community, while multidisciplinary engineering is second. Social science and physical science each makes less than 20% of the contribution to the total number of publications. These two techniques are not so popular in materials science research, as the relative contribution is almost negligible compared to other research domains.
Relative contribution from different research domains to scientific journals related to ML and symbolic regression. Shaded panels indicate a 20% level of the research domain, emphasizing an opportunity in materials science. (inset) The trend in the number of related publications on a natural logarithmic scale (ordinate) related to ML, ML and materials science, and symbolic regression, with respect to time.

It is not surprising to see a dominant contribution from computer science in both the ML and symbolic regression communities, since it is where these techniques were born. It is interesting to notice that symbolic regression is relatively more popular than ML in social science research. One possible reason for this trend is that social science problems typically do not have a (known) physically motivated governing equation as in many physical sciences, where, for example, Newtonian equations of motion and the Schrodinger equation can be written formally. Symbolic regression arises naturally as a problem solver since it has the potential to find an appropriate functional form from social science datasets, e.g., questionnaire results and behavior patterns.
We also report the trend in the number of publications (in a natural logarithm scale) in the following research domains (Fig. 1 (inset)): ML, application of ML in materials science, and symbolic regression. All three domains exhibit a rapid (almost exponential) growth rate, whereas the number of ML-related publications is orders of magnitude larger than the other two. The trend of symbolic regression applications in materials science is not shown here since the base number is too small; nonetheless, it also reveals a potential previously underappreciated research domain. For materials science problems, one is often also presented with the problem of unknown relationships among many variables. Symbolic regression presents an opportunity then to help in the formulation of structure–property relationships derived from these variables.
In this Prospective paper, we encourage materials scientists and engineers to utilize symbolic regression techniques in solving their domain problems. To facilitate a better understanding of the utility and application of symbolic regression, we next introduce the genetic programming-based symbolic regression (GPSR) method and describe current research frontiers in symbolic regression. Next, we discuss several industrial applications of symbolic regression and propose potential uses in materials science. In addition, we present how GPSR can learn the Johnson–Mehl–Avrami–Kolmogorov (or Avrami; JMAK) equation to describe recrystallization kinetics, as well as the Landau free energy expansion describing the structural-phase transition in LaNiO3. Last, we conclude with some open challenges in materials research that may benefit from symbolic regression methods.
Symbolic regression and current state-of-the-art methods
Genetic programming-based symbolic regression
Symbolic regression is a method of finding a suitable mathematical model to describe observed data.[Reference Augusto and Barbosa20] In conventional regression techniques, one optimizes parameters for a particular model provided as a starting point to the algorithm. For instance, a linear regression model is based on the assumption that the relationship of the dependent variables and regression is linear[Reference Seber and Lee21]; an artificial neural network (ANN) is a nonlinear model which relies on a predefined network infrastructure such as neuron connections and activation function (e.g., sigmoid and softmax function).
In symbolic regression, however, no such a priori assumptions on the specific form of the function are required. Instead, one provides a mathematical expression space containing candidate function building blocks, e.g., mathematical operators, state variables, constants, analytic functions, and then symbolic regression searches through the space spanned by these primitive building blocks to find the most appropriate solution. In other words, both model structures and model parameters are optimized in symbolic regression. Since there is no need for a predefined function form, optimization algorithms used in symbolic regression are different from conventional analytic/numerical optimization methods (e.g., conjugate gradient and Newton–Raphson methods). In this section, we briefly introduce one of the most prevalent methods used in symbolic regression by means of genetic programming (GP).
GP was developed by Koza[Reference Koza22] as a specific implementation of genetic algorithms (GAs),[Reference Forrest23] which are often utilized in the materials community for atomic structure prediction.[Reference Meredig and Wolverton24–Reference Mohn, Stølen and Kob26] The idea is to evolve the solution of a given problem following Darwin's theory of evolution and to find the fittest solution after a number of generations. Instead of using strings of binary digits to represent chromosomes as in GA, solutions in GP are represented as tree-structured chromosomes with nodes and terminals. Figure 2(a) shows a chromosome example of the mathematical function 1 + exp(−x 1). The tree consists of a set of interior nodes with mathematical operations (+, ×, exp) and terminal nodes with variables (x 1) and constants (±1). A depth-first search can be used to traverse the tree to get the final mathematical expression of each individual solution.
Tree structure chromosome representation of computer programs in GP. (a) parent 1 (1 + exp(−x 1)); (b) parent 2 $\left(kx_5/\sqrt {x_2^2 + 4} \right)$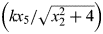 ; (c) child of genetic crossover operation $\left(1 + \exp \left(-\sqrt {x_2^2 + 4} \right)\right)$
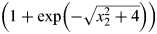 ; and (d) child of subtree mutation operation (x 7 − 0.5 + exp(−x 1)).

The structure of a chromosome tree is not necessarily binary; its structure depends on the number of arguments the mathematical operator takes. For demonstration purposes, we only introduce simple operators that are either unary or binary. Users of GP could include a variety of functions suitable for their target problems. A large number of trees will be generated based on specified user settings and evaluated throughout the GP process. Each tree represents a potential solution of the problem. The way new trees are generated from the initial mathematical building blocks is a unique feature of GP since it mimics the natural evolution of Earth's ecosystem, i.e., through artificial sexual recombination and a natural selection process.
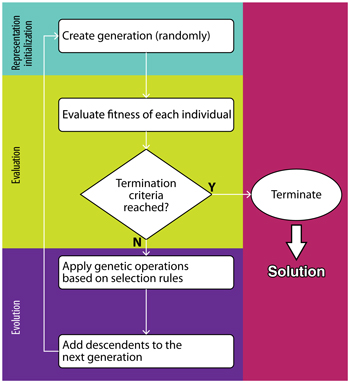
Figure 3 illustrates the process by which a solution of the symbolic regression problem is obtained using GP. The procedure starts with a set of randomly generated initial terminal nodes (variables, constants) and functions, forming individual trees with different sizes and structures (Figs. 2(a)–2(d)). These fundamental building blocks come from a user-defined input set. This starting population typically has a large variety of tree structures due to the random process, which facilitates further exploration of the variable space and reduces the potential risk of being trapped in local minima. The initialization process terminates once the number of individuals reaches a user-defined population size, where the natural selection process then comes into play. The “fitness” of each individual solution in the initial population is then evaluated by comparing their function output with the true value from the dataset. This fitness value describes how well the program performs in terms of solving the problem. The common error metrics used include mean squared error and root mean squared error. Then, GP evolves the current generation by randomly applying genetic operations to individuals, e.g., crossover and mutation. One or more individuals from the current generation will be selected as parent(s) based on the fitness score, typically the higher the score, the larger probability to be selected for reproduction. Such a selection rule agrees with the “survival-of-the-fittest” rule since good features are more likely to be inherited by the next generation, which is the essential step towards the optimal solution.
GP flowchart depicting the iterative solution-finding process.

The genetic crossover operation takes two winners of the selection process as parents to breed their offspring. For instance, the two structures in Figs. 2(a) and 2(b) are taken as parents. The crossover operator then randomly takes a subtree from parent (b) and substitutes another random subtree in parent (a) with that from (b). One possible offspring from the crossover operator is illustrated in Fig. 2(c). Crossover is usually the dominant operation in the recombination process. Figure 2(d) shows an example of an offspring from the mutation operation. The mutation operator only takes one parent structure and randomly substitutes a subtree with another randomly generated structure; in case (d), the constant 1 is mutated to (x 7 − 0.5). Although this operation is more aggressive compared to the crossover operation, since it adds randomness to the system, it is important to have a finite chance of mutation to introduce new variations, e.g., new constants and new features, and avoid being trapped in local minima.
The third category of genetic operations is reproduction, which duplicates the selected program and directly inserts its offspring to the next generation. It guarantees that some of the current generation will be preserved by the next generation and partially protects the similarity between two generations. Detailed definitions and implementations of each genetic operation can vary from case to case, but the main features should be the similar to what we described here.
The newborns are then added to the next generation after each genetic operation, until the new population size reaches the specified set number. Then, the new generation goes through the fitness evaluation and the natural selection process again until the fitness value reaches a certain criterion or the maximum number of generations is reached. After the termination of GP, the surviving individuals are expected to be highly evolved to adapt to the problem-dependent selection rule. More comprehensive descriptions of GP can be found in Koza's original paper.[Reference Koza22]
Advances in symbolic regression
Since Koza introduced the idea of GP in 1992, there have been significant efforts made to improve the performance of the original GPSR algorithm. The major problems to overcome in GPSR include:
(i) Non-deterministic optimization: It is not guaranteed that the performance of the descendent generations will be better than their parents.
(ii) Difficulty in finding the proper constants: Since the way GP generates constants is random, either in the initial input set or those brought into the population by mutations, there is no effective way to obtain the ideal coefficients as in other numerical regression methods.
(iii) Limited capability to preserve good components of the equation due to the fitness evaluation method. The fitness is evaluated based on the complete structure of an individual. Having a good feature in a sub-branch does not necessarily lead to better individual performance, thus good equation components may get lost in the next generation.
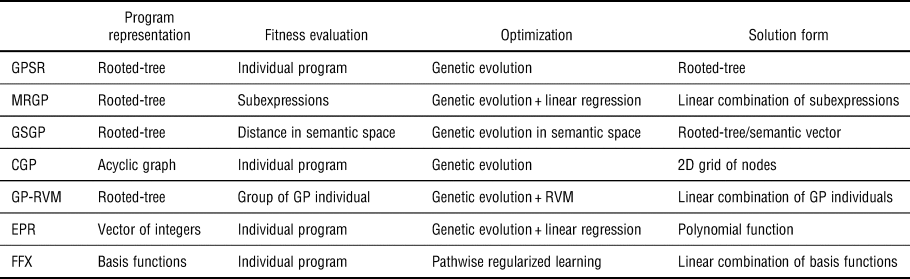
We summarize some of the most popular alternative methods to conventional GPSR in Table I and discuss their similarities as well as the differences in four aspects, namely program representation, fitness evaluation, optimization method, and the solution form.
Comparison of GPSR and its alternative methods: MRGP, GSGP, CGP, GP-RVM, EPR, and FFX.

Multiple regression genetic programming (MRGP)[Reference Arnaldo, Krawiec and O'Reilly27] improves the program evaluation process by performing multiple regression on subexpressions of the solution functions. Instead of evaluating the fitness of each individual solution as a whole, MRGP decouples its mathematical expression tree into subtrees. The fitness of the solution is evaluated based on the best linear combination of these subtree structures. A least angle regression algorithm is used to solve the linear regression problem here. Such a fitness evaluation scheme places more emphasis on finding good components even though it might only be a partial solution. For instance, the individuals that contain a correct form of a subtree structure of the correct solution (if known) are more likely to survive the natural selection process and pass these good features to the descendents. MRGP essentially decouples the current basis functions to find the best solution in an enlarged space at the vicinity of the original GP space. Indeed, this feature may be well suited for multiscale materials problems where modeling of systems across different length/time-scale is desired.[Reference Moore, Ma, Domel and Liu28] While some subexpressions capture relationship among variables within each scale, the final symbolic regression solution assembles models across the scale and returns the multiscale model.
Geometric semantic genetic programming (GSGP)[Reference Castelli, Silva and Vanneschi29] evaluates the semantic performance of a computer program instead of the syntax performance as in conventional GPSR. While still using a rooted-tree structure to represent computer programs, GSGP focuses on its semantics, i.e., the behavior of a program. For instance, add(x 1, x 1) is equivalent to mul(2, x 1) in semantic space, but quite different in terms of syntax. It is reasonable to care more about the behavior of the program than how the function appears. By representing each program in a high-dimensional semantic space, the fitness evaluation is rather straightforward; one only needs to measure the distance of the program from the target point in that space. The closer a program is to the target point, the better performance it has in solving the given problem. Interestingly, the offspring of two parent vectors in semantic space lies between its parents in the semantic space; therefore, the offspring should be at least no worse performing than the poor-performing parent. Optimizing program semantics rather than syntax further frees symbolic regression from specific function forms, potentially making SR more efficient.[Reference Castelli, Silva and Vanneschi29]
Cartesian genetic programming (CGP)[Reference Miller, Job and Vassilev30] has a more sophisticated design than conventional GP. Here, a computer program is represented as a directed acyclic graph, which may be visualized as a two-dimensional grid of nodes. Each node owns a set of genes that determines the input–output and mathematical function that the node performs; the whole set of genes of the computer programs forms its genotype. Decoding the genotype leads to the phenotype, i.e., the function forms of the computer programs. The genotype–phenotype mapping is a unique feature of CGP which makes it closer to the real natural process.
GP-based relevance vector machine (RVM)[Reference Rad, Feng and Iba31] is an alternative GP method that combines Kaizen programming (KP) and an RVM algorithm to solve symbolic regression problems. KP is a collaborative version of GP, where individuals work together with each other to solve the problem. The solution of a Kaizen process is a linear combination of GP individuals, and thus the fitness evaluation is based on a group of individual partial solutions instead of an individual program as a complete solution. RVM is a Bayesian kernel method that could extract important basis functions from the basis set without the prior knowledge to set a threshold and automatically deals with singularity. GP-RVM leverages advantages from both evolutionary algorithm and Bayesian kernel methods: the former mainly explores the parameter space, while the latter extracts basis functions to build and solve for the optimal solution function within that space.
Evolutionary polynomial regression (EPR)[Reference Giustolisi and Savic32] hybridizes the parameter estimation used in conventional numerical regression methods with the evolutionary optimization scheme in GPSR. EPR first explores the function space using GAs and then performs linear regression (e.g., least squares) to optimize the coefficients of each mathematical building block. Although EPR specifically uses polynomial expansions for the form of the functions, the solution is not necessarily a simple polynomial function since the transformed variables used in the polynomial expansion could be nonlinear functions of independent input variables. Such a hybrid method improves the stochastic GPSR method moving it towards a more deterministic approach although the computational cost may be relatively higher. In fact, the polynomial form of the expressions could make EPR suitable for materials design or multiobjective optimization purposes. Since the analytic gradient and Hessian of the solution can be evaluated, materials scientists may have more insights regarding the system and know what parameters to tune in order to achieve optimal design.
Fast function extraction (FFX)[Reference McConaghy33] is an efficient way to find good basis functions and solve for the best solution within the space it spans. The first step in FFX is to generate a large number of candidate basis functions built from input variables and other predefined variables. The evolutionary optimization scheme is not involved in FFX; instead, a pathwise regularized learning technique is used to identify the best coefficients and basis functions for the solution. Then, models obtained from the previous step are assessed based on the validation dataset as well as their model complexity in order to identify the best solution. FFX is more efficient compared to other GP-based methods due to the deterministic optimization technique. Materials scientists could first use FFX to see whether the input function/variable basis is sufficient for their research problem, before further investigation using symbolic regression methods (either FFX or other variants).
The performance of some of the recently developed symbolic regression techniques has been assessed against popular ML methods,[Reference Orzechowski, La Cava and Moore34] and it is reported that symbolic regression performs considerably well compared to state-of-the-art ML algorithms with regard to predictive accuracy. However, the two methods do not simply exist in competition to one another. We also observe a trend of more hybridization between conventional ML algorithms and GP in symbolic regression solvers.[Reference Icke and Bongard35–Reference Li, Fan, Singh and Riley38] These advances have enabled symbolic regression to be used for solving real-world problems, which we will discuss in the following section.
Applications of symbolic regression
Although it seems that equations obtained from first principles (e.g., the Schrödiner equation) and empirical observations (e.g., the 18-electron rule[Reference Tolman39]) are quite contradictory to each other, we see quite often that they symbiotically work together in solving real-world problems. For instance, both ab initio and experimental data have been used to develop effective interatomic force fields[Reference Van Beest, Kramer and Van Santen40] or exchange–correlation functionals.[Reference Yanai, Tew and Handy41] In fact, symbolic regression has the potential to serve as the bridge connecting experimental data to first principles. Schmidt and Lipson[Reference Schmidt and Lipson42] demonstrated that symbolic regression is capable of predicting connections between dynamics of subcomponents of the system and distill natural laws from experimental data. Moreover, symbolic regression provides researchers with analytic equations, which expectably would have better interpretability over the raw data and potentially other black-box models. The equations could reveal how the dependent variable (system output) responds to multiple independent variables (system input), as well as the relationships between independent variables of the underlying function. We show this later in the section “Industrial applications.”
Common motivations underlying the use of GPSR for complex problem solving include when the system in question is not effectively modeled by a linear model. Existing multiple linear regression models are much faster and are already easy to interpret. GPSR is best used for systems with complex interactions between observable variables for which the form is not known beforehand—a situation common in materials science and engineering.
In addition, a GPSR approach could be useful for design optimization purposes. Although the evolutionary search process is a black box, the final solution is analytic, which potentially contains important information (e.g., regarding the gradient or Hessian) about relationships between the design variables and objectives. There is also need for multiobjective optimization such as finding the Pareto optimal combination of model performance and complexity in various domains—it is here that the symbolic regression technique has shown to be effective and interpretable.[Reference Gout, Quade, Shafi, Niven and Abel43] We next describe some applications of symbolic regression in various science and technology domains.
Industrial applications
GPSR has been applied to a wide variety of problems in fields outside of materials science and chemistry. Most prominently featured in the popular press was work published by Schmidt and Lipson in Science,[Reference Schmidt and Lipson42] which showed that GPSR could discover Hamiltonians and Lagrangians for systems of simple harmonic oscillators and double pendulums. Reports of using GPSR for real-world systems, however, have been published since Koza's origination of the idea in the early 1990s and continue today.
Arkov et al.[Reference Arkov, Evans, Fleming, Hill, Norton, Pratt, Rees and Rodríguez-Vázquez44] used GPSR to identify equations governing gas turbine engines under multiple optimization conditions. Berardi et al.[Reference Berardi, Giustolisi, Kapelan and Savic45] used GPSR to find easy to interpret models for pipe failures in a UK water distribution system. Bongard and Lipson[Reference Bongard and Lipson46] applied GPSR to generate symbolic equations for nonlinear-coupled dynamical systems in mechanics, ecology, and systems biology. The authors also emphasized that their symbolic models are easier to interpret than numerical models, which makes understanding more complex systems easier for future applications.
Cai et al.[Reference Cai, Pacheco-Vega, Sen and Yang47] identified correlation equations from experimental heat transfer measurements using GPSR with a sparsifying constraint. The authors’ predicted correlations had lower percentage error than models developed graphically and numerically, albeit with more formula complexity than those traditional methods. Can and Heavey[Reference Can and Heavey48] applied GPSR to develop metamodels for predicting throughput rates in industrial serial production lines. McKay et al.[Reference McKay, Willis and Barton49] developed steady-state models for a vacuum distillation column and a chemical reactor.
La Cava et al.[Reference La Cava, Danai and Spector50] applied GPSR to identify nonlinear governing equations of wind turbines. The Pareto front from their paper is reproduced in Fig. 4. The Pareto front illustrates the trade-off between their model complexity as defined by the number and type of operations in the equation and the normalized variance in the prediction error. La Cava et al.[Reference La Cava, Danai, Spector, Fleming, Wright and Lackner51] also tested modifying standard GPSR with features from epigenetics, such as passive structure, phenotypic plasticity, and inheritable gene regulation. These researchers demonstrated their modifications improved the performance over standard GPSR by finding compact dynamic equations for synthetic data from nonlinear ordinary differential equations as well as real-world systems, e.g., cascaded tanks, a chemical distillation tower, and an industrial wind turbine. GPSR has also been applied to testing the efficient market hypothesis,[Reference Chen and Yeh52] formulating the synchronization control in oscillator networks,[Reference Gout, Quade, Shafi, Niven and Abel43] identifying the structure of helicopter engine dynamics,[Reference Gray, Murray-Smith, Li, Sharman and Weinbrenner53] real-time runoff forecasting in France[Reference Khu, Liong, Babovic, Madsen and Muttil54] and Singapore,[Reference Liong, Gautam, Khu, Babovic, Keijzer and Muttil55] designing circuits,[Reference Miller, Job and Vassilev30] predicting solar power production,[Reference Quade, Abel, Shafi, Niven and Noack56] finding dynamical equations for metabolic networks[Reference Schmidt, Vallabhajosyula, Jenkins, Hood, Soni, Wikswo and Lipson57] in both cases where a starting model was known and from scratch, modeling global temperature changes,[Reference Stanislawska, Krawiec and Kundzewicz58] and synthesizing second-order coefficient insensitive digital filter structures.[Reference Uesaka and Kawamata59]
Example Pareto front showing trade-off between solution complexity and variance accounted for (VAF). Reproduced with permission from La Cava et al.[Reference La Cava, Danai and Spector50]

The existing uses of GPSR within chemistry are more extensive than that for materials science. We refer the reader to the review by Vyas et al.[Reference Vyas, Goel and Tambe60] for further details. Some key studies with relevance to materials science are summarized here: Langdon and Barrett[Reference Langdon and Barrett61] developed a model for oral bioavailability of a small molecule given a few hundred data points from expensive experiments. Their model based on chemical descriptors showed promise for rapid drug screening, but had difficulty generalizing to novel molecules. Vyas et al.[Reference Vyas, Goel, Karthikeyan, Tambe and Kulkarni62] also discovered structure–property relationships for drug absorption using GPSR. Here, they demonstrated R 2 values comparable to those achieved with ANNs and support vector regression. Barmpalexis et al.[Reference Barmpalexis, Kachrimanis, Tsakonas and Georgarakis63] performed a multiobjective optimization using GPSR. They found a function mapping levels of four polymers to three different properties of a pharmaceutical release tablet that was more predictive than a shallow neural network. Lastly, Muzny et al.[Reference Muzny, Huber and Kazakov64] built a correlation model for the viscosity of hydrogen as a function of temperature and pressure.
Opportunities in materials science
Materials science has many potential areas where GPSR can be applied for the same reasons it find use in other disciplines. Nonlinear systems are abundant in materials science. Changes in materials properties occurring in response to structural, composition, and other external perturbations are frequently nonlinear in proximity to phase transitions or for large stimuli. For instance, changing the concentration of oxygen vacancies in a transition metal compound by an atomic percent can alter its ionic or electronic conductivity by orders of magnitude.[Reference Markov, Patrakeev, Kharton, Pivak, Leonidov and Kozhevnikov65,Reference Nakamura and Wagner66] The dynamical behavior of materials performance as a function of time is also of broad interest and technological importance, e.g., corrosion of nickel cathodes under different conditions.[Reference Daza, Rangel, Baranda, Casais, Mart´ınez and Alonso67] These are the areas where a dynamical multivariable model would be ideal to understand the correlation among the variables and assist optimization of materials properties, e.g., corrosion resistance.
Frequently, materials scientists look for relationships (f) among multiple variables with the aim to find some closed-form expression such as y = f(X), where y is the objective value and X is a set of variables. These equations are typically expressed in differential form, e.g., the Schrödinger equation $(i\hbar (d/dt)\vert {{\rm \Psi} \lpar t \rpar } = \hat{H}\vert {{\rm \Psi} (t)} )$ or Newton's second law (F = m(d v/dt)). It has been shown that symbolic regression can generate ordinary nonlinear partial differential equations for nonlinear-coupled dynamical systems[Reference Bongard and Lipson46,Reference Maslyaev, Hvatov and Kalyuzhnaya68] as well as approximate ordinary differential equations.[Reference Gaucel, Keijzer, Lutton and Tonda69] Meanwhile, an often desire is to find conservation laws in physical systems. The ability to unearth conservation laws with symbolic regression goes beyond the aim of materials property predictions and helps researchers establish insight into the materials systems they study.[Reference Schmidt and Lipson42,Reference Schmidt and Lipson70] In fact, we do not necessarily need a rigorous expression of natural laws in every case; sometimes, an approximation with a simple yet effective expression serves well for the research purpose.[Reference von Barth and Hedin71] Symbolic regression could potentially balance the trade-off between model accuracy and simplicity, and might even help scientists discover new equations that redefine our understanding of functional materials in the same way those of Hall and Petch, and Harper and Dorn changed our understanding of the mechanical properties of metals or as, more recently, how Berry phases and topological band theory changed our understanding of electronic structures.
As we mentioned earlier, materials properties and performance are affected by phenomena that involve multiple length scales. Most theoretical models are formulated to be optimal at a particular length scale. However, recent emphasis has been placed on multiscale and hierarchical modeling in the materials science community,[Reference Moore, Ma, Domel and Liu28,72,Reference Yadollahi, Shamsaei, Thompson and Seely73] and there is an increased need for effective, descriptive, and predicative, multiscale models. Symbolic regression techniques are potential solutions to this challenge by directly searching for the interactions among variables operating and passing between multiple spatial and temporal scales. Another possible approach is to utilize existing simulation methods within each length scale, while using symbolic regression to find the suitable coupling interactions between scales, i.e., connecting models of different scales.
Other applications of GPSR in materials and molecular systems are in areas where supervised ML has already demonstrated usefulness in providing new insight or solutions. While ML has produced many impressive results,[Reference Alberi, Nardelli, Zakutayev, Mitas, Curtarolo, Jain, Fornari, Marzari, Takeuchi, Green, Kanatzidis, Toney, Butenko, Meredig, Lany, Kattner, Davydov, Toberer, Stevanovic, Walsh, Park, Aspuru-Guzik, Tabor, Nelson, Murphy, Setlur, Gregoire, Li, Xiao, Ludwig, Martin, Rappe, Wei and Perkins5,Reference Zhuo, Tehrani, Oliynyk, Duke and Brgoch17,Reference Ward and Wolverton74] it is commonly understood that ML models exhibit a trade-off between performance on prediction metrics and the ability to explain the predictions of a model due to the complexity of state-of-the-art models like deep neural networks or gradient-boosted decision trees. GPSR offers a middle ground with comparable performance but with the added ability to read and directly interpret the output function.
GPSR is also well suited to the development of new descriptors[Reference Ghiringhelli, Vybiral, Levchenko, Draxl and Scheffler75] for materials properties. By combining features in a manner best suited to fitting data, new features are created that can be used as proxies for the property in question. This is also a common application of compressed sensing.[Reference Ghiringhelli, Vybiral, Ahmetcik, Ouyang, Levchenko, Draxl and Scheffler76,Reference Ouyang, Curtarolo, Ahmetcik, Scheffler and Ghiringhelli77] Compressed sensing differs from GPSR in that while GPSR uses GP to iteratively evolve a solution, compressed sensing tries to enumerate as many combinations of primary features as possible and then uses sparsifying operators to find a small dimensional subset that correlates with the target.
Materials scientists are not just interested in making predictions. They also want to identify the controlling features of a property and what role each feature plays; they want to understand which degrees of freedom to design or optimize to achieve targeted properties. Given some desired properties as objectives and the relevant variables, there are a number of numerical algorithms available for performing optimization,[Reference Vanderplaats78] but they typically require some a priori knowledge of the mathematical relationships within the system. The symbolic equations derived from GPSR offer insight into which microscopic or macroscopic knobs to turn for the design of desired functionality, such as corrosion resistance in steels.[Reference Shimada, Kokawa, Wang, Sato and Karibe79]
Some novel ideas include targeting physical variables for which we do not know the proper mathematical expressions. For instance, the exchange–correlation functional used in density functional theory, or the correlation function for the viscosity of normal hydrogen.[Reference Muzny, Huber and Kazakov64] Contraindicated material property pairs such as ferromagnetism and ferroelectricity or optical transparency and electrical conductivity would be interesting areas to pursue in search for routes to decouple or circumvent perceived coexistence incompatibilities. In these cases, GPSR could provide candidate representations of these terms, where our physical knowledge can be used to filter meaningful results. One advantage of using symbolic regression is that the balance between model accuracy and complexity is tunable with GPSR settings, e.g., stopping criteria and penalty on individual size. This advantage is particularly evident when designing with constraints or optimizing for performance. The recommendations coming from the learned symbolic equations are more actionable than learned functions only optimized for test set accuracy since they are rigorously made to use fewer terms.
Use-cases in materials science
Discovering the JMAK equation
We now show how to use GPSR to learn the JMAK, hereafter, Avrami equation. The Avrami equation quantitatively describes the growth kinetics of phases in materials at constant temperature. Here, we specifically study the recrystallization process of copper; the original experimental data were obtained from Ref. Reference Decker and Harker80. We expect the form of the function to be

where the phase fraction of transformation y is a function of time t. The coefficients k and n are unknown and change with respect to temperature and other environmental conditions.
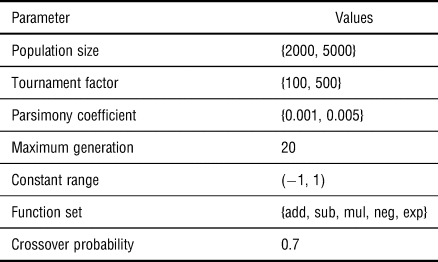
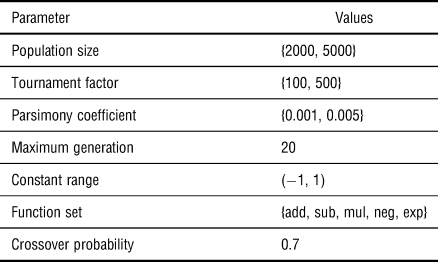
We use GPSR as implemented in gplearn[Reference Stephens81] to predict the relationship between fraction transformed y and time t. The hyperparameters used in GPSR are listed in Table II. When the population size is divided by the tournament factor, one obtains the number of individuals competing for reproduction each round. The parsimony coefficient regularizes the size of individuals by penalizing over-sized structures. We include operations of addition, subtraction, multiplication, negation, and the natural exponential function into the function set. The power function is not included since it easily causes numerical overflow or invalid operations (e.g., power(−1,0.5)). In general, this can be an issue when evaluating power law-dependent phenomena such as electrical transport equations. Working with log transforms of the original variables may be a more stable approach. Crossover operations dominate the genetic operations with a 70% probability to be applied; the other 30% chance corresponds to mutation operations (e.g., point mutation and subtree mutation). Additional details concerning the usage of gplearn are given in its documentation.
List of hyperparameters used in GPSR to learn the Avrami equation. A grid-search method is used to find the optimal hyperparameters from the top three parameter sets.
Data preprocessing is an essential step in ML before feeding data into the solver. Conventional preprocessing methods include shifting data to be zero-centered and scaling data to unit standard deviation. However, the conventional preprocessing methods are not ideal choices in our case. Zero-centered shifting is not applicable to either the phase fraction transformed (y) or time (t) since we want to obtain the exact function form of the Avrami equation. Furthermore, scaling the time frame would only change the constant k in the Avrami equation. Here, we scale time from 0 to 10 for all datasets so that the constant t lies in the range [−1, 1]. The y values remain unchanged as the experimental data range over [0, 1].
We take the experimental copper recrystallization data at temperatures 135, 113, and 102 °C as input and scale the time variable before performing regression. Since the experimental data only contain several points at each temperature (less than 10), we also take data points from interpolated lines and perform symbolic regression on the interpolated data for comparison. An ideal dataset is also generated, where y values are directly calculated as 1 − exp(−0.6t 2). The optimal k and n values in each dataset are obtained from numerical fitting using Scipy, given the form of the Avrami function. Ideally GPSR should be able to recover the correct function form as well as k and n constants for all datasets.
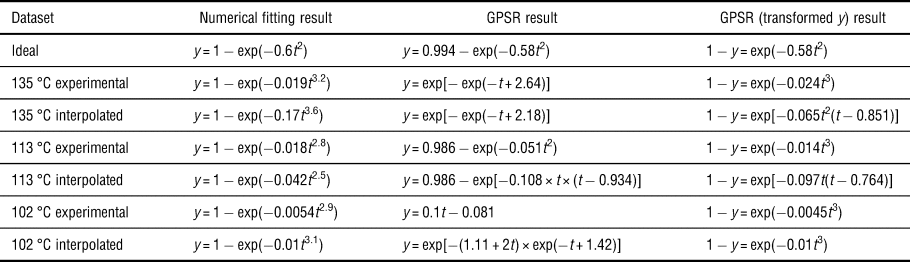
The best individual after 20 generations of evolution is collected for each hyperparameter setting. Finally, we manually pick the optimal individual with closest function form and constants to the Avrami equation within each dataset. Our parameter fitting and GPSR evolution results are shown in Table III and Fig. 5.
Functions predicted by GPSR and numerical fitting results for the Avarmi equation describing copper recrystallization.

GPSR prediction and performance with different datasets. Left panels correspond to the direct experimental data while right panels use interpolated experimental data (a) 135 °C experimental data, (b) 135 °C extrapolated data, (c) 113 °C experimental data, (d) 113 °C extrapolated data, (e) 102 °C experimental data, and (f) 102 °C extrapolated data.

Gplearn successfully recovers the relationship between time (t) and fraction transformed (y) in most cases. With the ideal input data, gplearn evolves almost a perfect form of the Avarmi function as well as the constants (see the first row of Table III). The performance on the raw experimental and interpolated data is generally worse than the ideal case but still reasonable. In most cases, the exponential function form and polynomial function of t are both recovered. One source of error is the lack of the power function in function set, which was intentionally omitted as non-integer powers of variables cannot be correctly represented here. Rather, polynomial functions are used as an approximation. With the limited choice of mathematical functions, GP produces results that are very close semantically but exhibit different syntax.
We see in multiple cases that GPSR produces functions of the exp[−exp(Θ)] form, where the expected function form is 1 − exp(Θ). Here, we introduce a mathematical trick to show their equivalence. The functions e x and 1 + x are called equivalent infinitesimals because

In our case, the exponent − exp(Θ) quickly reaches zero when Θ (ideally having the form − kt n) becomes more negative; therefore, the equivalent infinitesimal relationship holds and the predicted form of the function is equivalent to the expected one appearing in the Avrami expression. Based on this example, we encourage professional materials researchers, who are novice data scientists, to perform careful analysis of GPSR results when making the final interpretation of the obtained model.
In real-world applications where the actual function forms in unknown, the exact syntax of GPSR results may not matter. There are potentially many cases where GPSR would produce semantically similar/equivalent functions that vary in their syntax, i.e., different function forms. Considering the trade-off between model accuracy and complexity, in some cases it might be a virtue to find a simple approximated solution instead of using rigorous but complex relationships among multiple variables.
The GPSR result from the 102 °C experimental dataset (Fig. 5(e)) turns out to be a linear relationship and deviates significantly from the original data. The poor result may be caused by the relatively small slope of the original data and the insufficient number of available data points. Taking the model performance and complexity into consideration, we find that the linear relationship survives due to its simple form. With interpolated data as input, functions evolved from GPSR agree better with the Avrami equation, as shown in Fig. 5(f). Therefore, having more training data could improve the performance of GPSR, which also applies to other data-driven methods.
Interestingly, the performance of GPSR can also be improved by transforming (or simplifying) the mathematical expression. We compare results of directly training y ~ t relationships with (1 − y) ~ t, where in the latter case the target value 1 − y is the percentage of copper untransformed. The results are shown in the last column of Table III. The transformed functions show improved performance since we have already performed the subtraction function for the model. GPSR not only successfully recovers the exponential form of the equation, but also finds constants closer to the numerical fitting values.
Learning Landau free energy expansion
Next, we present a slightly more complicated case with two variables. The model we studied is the Landau free energy expansion for the cubic-to-rhombohedral structural-phase transition in perovskite LaNiO3, where the free energy G of the system is expanded in powers of an order parameter θ as

where κ and λ are temperature-independent coefficients and θ is the angle of rotation about the [111] direction. This rotation angle of the corner-connected NiO6 is the order parameter for the displacive transition. The parameters we used are obtained from ab initio DFT simulations,[Reference Gou, Grinberg, Rappe and Rondinelli82] where κ = 1.696 meV 10−3 K/(°)2, λ = 0.0171 meV/(°)4, and T C is estimated to be 2.057 (103 K). We use 103 K as the unit for temperature so that the constants are brought into a smaller range.
In this case, we set the temperature t and order parameter θ as the input variables, and the free energy change G(θ, T) − G 0(T) as the output. We uniformly sampled 11 temperature points between [0, 1] (103 K), and 100 order parameter points within the range [−20°, 20°]. The corresponding value for the change in free energy is calculated from Eq. (1) using the parameters reported in the literature. A population size of 10,000 is used, with tournament size 25, parsimony coefficient 0.02, and constant range [–2.0, 2.0]. In order to simplify the problem, we only consider addition, subtraction, and multiplication operations in our search. Other settings are the same to those in the Avrami case.
The best individual after 15 generations of evolution has the function form

where ${T}^{\prime}_C = 1.894 + 8.32 \times 10^{-3}T^2$ and ξ = (− 1.72T 2 + 1.214T − 0.24)θ − 1.334. The GPSR-learned coefficients are quite close to the reported values, especially for the quartic term. This is probably because the penalty for a larger deviation in the leading (quartic) term is much higher than others. For the quadratic term of θ, GPSR successfully captured the coupling term Tθ 2 and its coefficient, but also an unexpected biquadratic T 2θ 2. It should not have a strong impact on the function owing to its small coefficient (8.32 × 10⁻³).
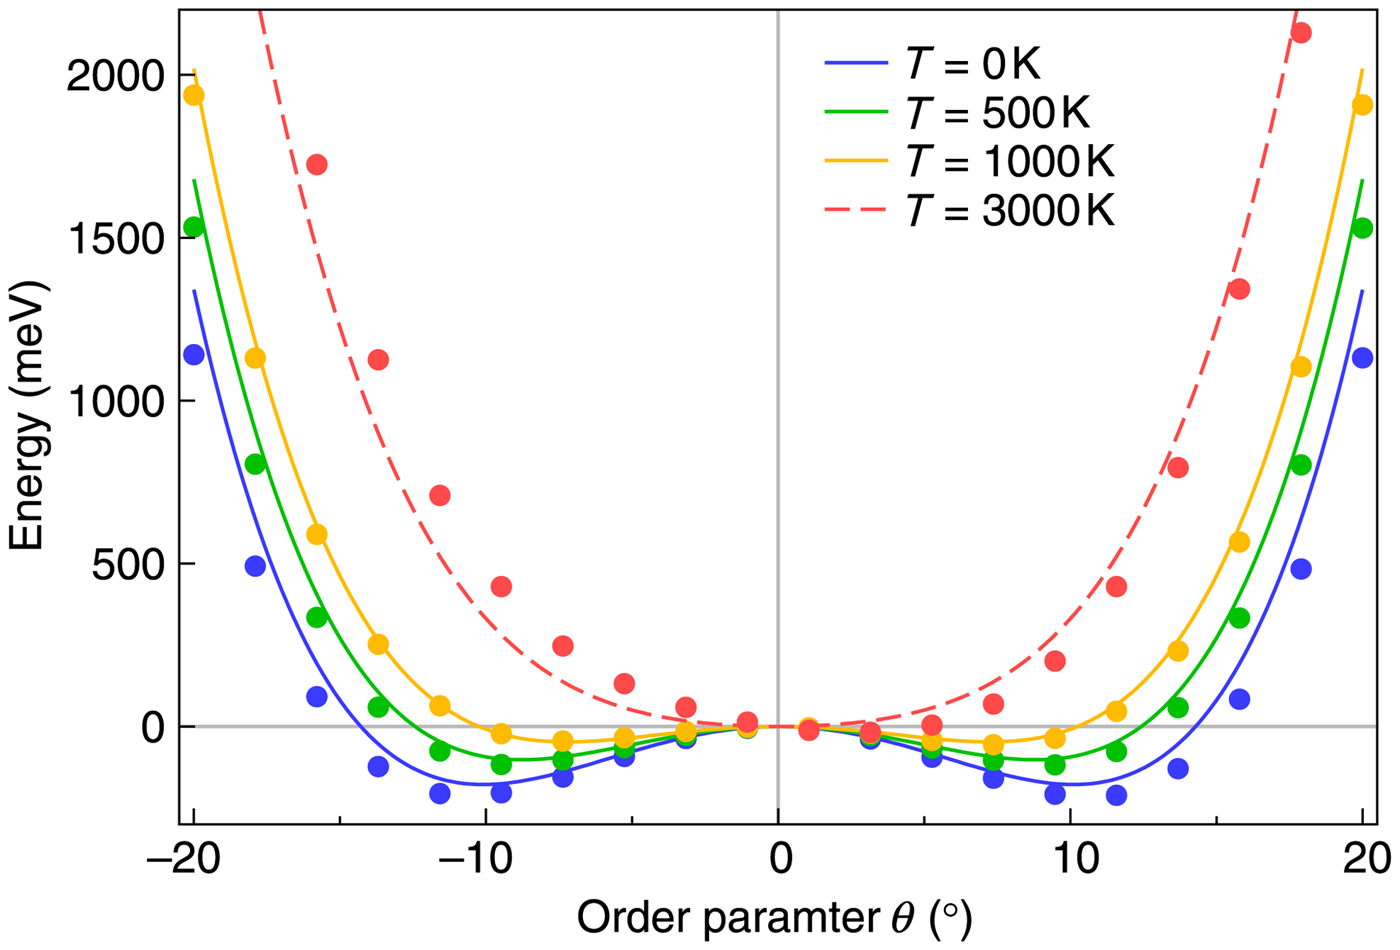
The Landau free energy with respect to the order parameter is plotted in Fig. 6. We find that GPSR results (filled symbols) agree well with the DFT-derived Landau free energy function not only within the training region, i.e., with T = 0, 500 and 1000 K, but also reasonably well beyond it. The dashed red line in Fig. 6 with T = 3000 K is not included in training the GPSR, yet the model reproduces both the shape and the correct global minimum position very well. However, the predicted function contains other coupling terms not present in Eq. (1). These extra terms in ξ destroy the symmetry of the function, i.e., the free energy expansion is an even function by symmetry. This would become an issue especially when T is large, as we can see a minor shift to positive θ values occurs for the red-filled symbols in Fig. 6. Again, the model may need more data to learn the correct even function form. In general, GPSR does an excellent job in learning the relationship between temperature and the order parameter without any knowledge of the physical system. Our results here also reveal the potential to perform effective feature selection using GPSR, where the insignificant variables (features) could be approximated or ignored in post-processing (e.g., terms with negligibly small coefficients).
Landau free energy G for perovksite LaNiO3 as a function of the order parameter θ at different temperatures. Both solid and dashed lines are calculated using Eq. (1) with coefficients reported in Ref. Reference Gou, Grinberg, Rappe and Rondinelli82. Only solid lines are used during the training. The filled symbols correspond to GPSR-predicted results using Eq. (2).

The purpose of these two use-cases for learning the Avrami equation and Landau free energy expansion with GPSR is to show the potential of its application in materials science problems. Although these are relatively simple examples, the understanding and approaches applied could be generalized and utilized to solve real-world challenges. Apart from both function analysis and data preprocessing mentioned previously, hyperparameter tuning is also an essential step to obtain the optimal solution. A grid-search scheme to search the hyperparameter space (e.g., population size, number of generations, and regularization) is recommended since the optimal settings differ from case to case. The grid-searching process can be exhausting, but it might also be rewarding. Comparing the results from different hyperparameter settings could provide insight into the functional form of the optimal solution, especially if components of a particular function appears multiple times in the solution set.
The real challenge, however, is that very often materials science problems cannot be represented using regular functions (analytic and single-valued). A simple example would be to understand how different chemical compositions affect materials properties.[Reference Yu, Young, Wu, Zhang, Rondinelli and Shiv Halasyamani83] This problem originates from the inability to differentiate in the chemical space and is out of the scope of this prospective. It remains an open question in the materials research community.
Summary
Symbolic regression has shown competitive performance to other ML-based regression models in various research domains. While there are some shortcomings of the current state-of-the-art GPSR, e.g., high computational cost and non-deterministic optimization, there are numerous active research efforts focusing on improving the performance of symbolic regression to expand its use in real-world applications. The ability of symbolic regression to distill natural laws from datasets with high-dimensional parameter space makes it an ideal technique for materials science research, since these researchers typically face sparse datasets with multiple variables. Freed from having a fixed form of equations, symbolic regression can potentially reveal the significant interactions among physical variables. We recommend that more materials scientists utilize symbolic regression techniques in their own research domain.
Acknowledgments
Y.W. acknowledges partial support from the Predictive Science and Engineering Design (PS&ED) program at Northwestern University. All authors acknowledge support from the National Science Foundation (NSF) through the Designing Materials to Revolutionize and Engineer our Future (DMREF) program under award no. DMR-1729303.