1 Introduction
The canonical side-by-side arrangements of circular cylinders are common and have a wide range of applications in various fields such as offshore, wind and aerospace engineering. In addition to their great practical relevance in engineering applications, a side-by-side system has a fundamental value due to the richness of nonlinear flow physics associated with the near-wake dynamics and the vortex-to-vortex interactions. There is a considerable difference between the flow dynamics of an isolated cylinder and the multiple-cylinder arrangements. Many comprehensive investigations, e.g. Zdravkovich (Reference Zdravkovich1987), Sumner et al. (Reference Sumner, Wong, Price and Paidoussis1999), Sumner, Price & Paidoussis (Reference Sumner, Price and Paidoussis2000), Lin, Yang & Rockwell (Reference Lin, Yang and Rockwell2002), Sumner (Reference Sumner2010), were performed to understand and describe the mutual flow interference in the basic canonical multi-body systems, in which the importance of the wake and proximity interference was discussed as a function of the gap width between the cylinders and the Reynolds number. Among them, the flip-flopping of gap flow during the flow past two symmetrically arranged cylinders has received significant attention among researchers. Different from the other fundamental flow regimes in a two-dimensional laminar flow, the bi-stable character and chaos-like fluctuation of the flip-flopping pattern have intrigued the research community over the past few decades. In the event of a flip-flop, the gap flow fails to maintain its straight path and has an intrinsic tendency to oscillate intermittently between two asymmetric states.
The phenomenon of flip-flopping flow was reported in several experimental works at relatively large Reynolds numbers
 $(Re=10^{3}\sim 10^{5})$
(Ishigai et al.
Reference Ishigai, Nishikawa, Nishimura and Cho1972; Bearman & Wadcock Reference Bearman and Wadcock1973; Williamson Reference Williamson1985; Kim Reference Kim1988). In particular, the flip-flop was interpreted by Kim (Reference Kim1988) as a complex dynamical state with bi-stable stochastic characteristics and a biased deflected gap-flow regime with asymmetric narrow and wide wakes with distinct predominant frequencies. The gap flow was found to switch intermittently its direction on a time scale which was a few orders of magnitude greater than the frequency of primary vortex shedding. In addition to these experimental works, the flip-flop was also observed within a narrow gap ratio range from 0.3 to 1.25 diameters in a two-dimensional laminar flow from various numerical investigations (Kang Reference Kang2003; Agrawal, Djenidi & Antonia Reference Agrawal, Djenidi and Antonia2006). In the deflected gap-flow regime, the narrow near-wake region involves an enhanced vortex–wake interaction, which results in a higher vortex shedding frequency and mean drag force. On the other hand, a lower frequency is observed in the wide wake. The vortex-shedding frequency of each cylinder dynamically changes with the gap-flow kinematics as the time evolves.
Although the origin of the flip-flopping was investigated by many researchers, there is no common consensus on a general understanding of the phenomenon. To begin, Alam & Sakamoto (Reference Alam and Sakamoto2005) reported that a perfect symmetric structure geometry was a critical condition which originated the intermittent switching of the gap flow. However, the gap-flow flip-flop was also observed in the asymmetric vibrating side-by-side (VSBS) arrangements of Liu & Jaiman (Reference Liu and Jaiman2016). In one of the pioneering studies, Ishigai et al. (Reference Ishigai, Nishikawa, Nishimura and Cho1972) considered the Coanda effect as the origin of the gap-flow flip-flop. Nonetheless, the flip-flop was found in the near-wake region behind a pair of side-by-side flat plates by Bearman & Wadcock (Reference Bearman and Wadcock1973), Williamson (Reference Williamson1985). Peschard & Le Gal (Reference Peschard and Le Gal1996) modelled the dynamics of the deflected gap-flow regime through a system of two coupled Landau oscillators. The study illustrated that the stable deflected gap-flow regime and the flip-flop were formed by different mechanisms. Following the earlier studies, Carini, Giannetti & Auteri (Reference Carini, Giannetti and Auteri2014) reported that the flip-flop could be explained as a secondary instability through the coupling between a Hopf bifurcation (in-phase vortex synchronization) and the pitchfork bifurcation (deflected gap-flow regime). This finding was subsequently supported by Liu & Jaiman (Reference Liu and Jaiman2016) in which the evolution of the flip-flop from the interaction of these two bifurcations was shown in a series of streamline plots as the Reynolds number increased. The flow characteristics were systematically investigated as a function of the gap distance between the two cylinders. The exact instants of the flip-flop and the instantaneous vortex-shedding frequencies were visualized via the Hilbert–Huang transform (HHT) technique of Huang (Reference Huang2014).
In relation to the vibrating side-by-side configuration, Liu & Jaiman (Reference Liu and Jaiman2016) also reported that the flip-flop was suppressed at the lock-in, in which the time-averaged streamwise velocity profile of the gap flow became asymmetric. On the other hand, the lock-in range with respect to the reduced velocity became relatively narrower, owing to the enhanced vortex-to-vortex interaction caused by the gap-flow proximity interference. A topological description based on critical points has also shown that indeterminant two-dimensional saddle-point regions intermittently appeared in the middle path of the gap flow. The appearance of such saddle points was found to be linked with the near-wake instability. These critical points, where the velocity is zero and the streamline slope is indeterminate, contribute to the shear stress and can provide some understanding of the three-dimensional flow structures behind bluff bodies (Zhou & Antonia Reference Zhou and Antonia1994). While there exist several studies on the near-wake instability and three-dimensionality for the canonical case of a circular cylinder, such effects are not explored for stationary side-by-side cylinders. In particular, the mutual effects between the three-dimensionality and the gap-flow interference have not been examined in the past in the context of vibrating side-by-side cylinders. During the lock-in/synchronization, the vibrating cylinder undergoes a complex interaction with the gap flow and the near-wake vortex system behind the two cylinders.
The primary focus of the present study is to investigate the influence of three-dimensional (3-D) flow structures on the dynamics of an immersed side-by-side configuration in a uniform flow. The complete three-dimensional flow field is important for interpreting the topology of flow patterns and the role of critical points in the instability process, however 3-D information is generally difficult to extract from physical experiments. In a 3-D flow behind an isolated circular cylinder (i.e. large gap distance between cylinders), the formation of the rib-like streamwise vortical structures connecting the spanwise Kármán vortices is one of the characteristic flow features of the organized motion. As reviewed in Williamson (Reference Williamson1996b
), there are two types of instability during the wake flow transition, namely mode-A and mode-B. The mode-A instability (
 $180\lesssim Re\lesssim 230$
) is associated with the waviness of the primary Kármán vortices induced by the elliptic instability, whereas the counter-rotating streamwise vortices are formed in the high-strain region between the main spanwise vortex rolls. The conversion of the spanwise vorticity from the Kármán vortex cores into the streamwise vortices is an outcome of the elliptic instability and forms the central element of the mode-A instability. The onset of mode-A instability manifests a hysteretic discontinuity of Strouhal number
 $St$
and the Reynolds number
 $Re$
relationship with a spanwise wavelength of approximately
 $3\sim 4D$
. While the mode-A intrinsically triggers a vortex dislocation in the wake of a stationary isolated circular cylinder during the wake transition, the mode-B (
 $Re\gtrsim 230$
) with a spanwise wavelength of approximately one diameter exhibits a non-hysteretic transition. A relatively high shedding frequency occurred with a more organized three-dimensional state of the mode-B and vice versa. In the present study, we consider the near-wake instability and three-dimensionality for side-by-side cylinders for
 $100\leqslant Re\leqslant 500$
.
In spite of the above investigations, many aspects of the proximity interference and the wake interference from the gap flow remain largely unexplored. A detailed three-dimensional description of the flow dynamics and the wake–body interaction is particularly lacking in the literature. In the context of three-dimensionality associated with the elliptic instability for a single cylinder, the hyperbolic critical points were investigated by Kerswell (Reference Kerswell2002), Le Dizes & Laporte (Reference Le Dizes and Laporte2002) and Meunier, Le Dizes & Leweke (Reference Meunier, Le Dizes and Leweke2005). From the topological theory of separated flows, the two-dimensional streamline orbitals resemble hyperbolas around a hyperbolic critical point, where its central velocity magnitude is zero and all eigenvalues of the velocity gradient have the non-zero real parts. The hyperbolic critical points in the fluid domain had been previously reported as an unstable factor by Lifschitz & Hameiri (Reference Lifschitz and Hameiri1991) and Leblanc (Reference Leblanc1997), where the maximal perturbation growth was found precisely around these hyperbolic points near the vortex wake. Although the role of critical points has been limited to a single cylinder, they have not been examined in the context of side-by-side cylinder wakes. One of the contributions of the present study is to build connections between the near-wake instability, the vortex wake interaction and the fluid momentum. By considering one of the cylinders as elastically mounted in the VSBS arrangement, the coupling between the near-wake dynamics and vortex-induced vibration (VIV) is examined in three dimensions for the first time.
In the present work, we use well-resolved numerical simulations to elucidate some insights into the effects discussed above at Reynolds numbers of
 $100\leqslant Re\leqslant 500$
. Specifically, we explore the spanwise characteristics of the gap-flow and VIV kinematics for 3-D flow through systematic numerical analysis. We employ the recently developed variational finite element solver for fluid–structure interaction (Jaiman, Guan & Miyanawala Reference Jaiman, Guan and Miyanawala2016a
; Jaiman, Pillalamarri & Guan Reference Jaiman, Pillalamarri and Guan2016b
). The fluid and structure equations are coupled in three dimensions by body-conforming treatment of the fluid–solid interface via an arbitrary Lagrangian–Eulerian formulation. Of particular interest is to answer the following questions: How do the VIV kinematics, the gap-flow instability and the hydrodynamic responses accommodate themselves in a 3-D flow? How does the gap-flow kinematics influence the 3-D flow features? How does the spanwise correlation respond to the cylinder’s kinematics and the gap-flow instability? In most engineering applications, flexible multi-body structures subjected to proximity interference and resonant wake–body interaction are much more common. Such multi-body systems can exhibit complex spatial-temporal dynamics as functions of geometric variations and physical parameters. A fundamental understanding of such complex nonlinear coupling is essential for efficient engineering design and safer operations. The incorporation of VIV in the investigation is crucial to reflect the practical effects of structural motion and the interference on the hydrodynamic forces.
The remainder of the paper is organized as follows. The numerical formulation, the problem set-up and the verification are briefly presented in § 2. Following that, the regulation effect of VIV kinematics on the three-dimensional features is discussed in § 3. We next investigate the mutual interference between the 3-D flow and the gap-flow kinematics in stationary side-by-side (SSBS) arrangements in § 4. The coupled dynamical characteristics of the VSBS arrangements are presented in § 5. The primary focus is on the VIV lock-in phenomenon in the VSBS arrangements for a range of reduced velocity at representative gap ratios. We investigate the flow physics of the gap flow and the VIV kinematics in terms of the wake topology, the response characteristics, the force components, the phase and frequency characteristics. The three-dimensional modal analysis is discussed in § 6. Concluding remarks and a summary of main results are provided in § 7.
2 Numerical methodology
2.1 Coupled fluid–structure system
A Petrov–Galerkin finite element formulation is employed to investigate the fluid–structure interaction problem, whereby the body interface is tracked accurately by the arbitrary Lagrangian–Eulerian technique. The traction and the velocity continuity conditions are imposed on the body-conforming fluid–solid interface via the nonlinear iterative force correction procedure (Jaiman et al.
Reference Jaiman, Guan and Miyanawala2016a
,Reference Jaiman, Pillalamarri and Guan
b
). The coupling scheme relies on a dynamic interface force sequence parameter to stabilize the coupled fluid–structure dynamics with strong inertial effects of incompressible flow on immersed solid bodies. The temporal discretizations of both the fluid and structural equations are formulated in the variational generalized-
 $\unicode[STIX]{x1D6FC}$
framework and the systems of linear equations are solved via the generalized minimal residual (GMRES) solver. Further details can be found in Jaiman, Sen & Gurugubelli (Reference Jaiman, Sen and Gurugubelli2015), Jaiman et al. (Reference Jaiman, Pillalamarri and Guan2016b
). Detailed convergence investigations and the validation results of the two- and three-dimensional simulations are reported in Liu & Jaiman (Reference Liu and Jaiman2016), Li et al. (Reference Li, Yao, Yang, Jaiman and Khoo2016) and Mysa, Kaboudian & Jaiman (Reference Mysa, Kaboudian and Jaiman2016), which support the suitability of the fluid–structure solver in simulating the 3-D gap flow and VIV interaction.
2.2 Dynamic mode decomposition
While the proper orthogonal decomposition (POD) modes may not necessarily provide a description of a dynamically evolving flow driven by a momentum input, the dynamic modal decomposition (DMD) allows us to extract the dominant spatial and temporal information about the flow (Schmid Reference Schmid2010). Therefore, we employ the dynamic modal decomposition to fit a discrete-time linear system to a set of snapshots from three-dimensional wake data. The goal of the DMD technique is to approximate the system in a low-dimensional subspace and to construct a set of approximated eigenvectors and eigenvalues to identify the spatial and temporal modes. For a more robust and effective implementation of the DMD technique, the modal amplitude (
 $\unicode[STIX]{x1D6FC}$
) is computed through the best fit between the linearized modes and original snapshot data in a least-squares sense (Jovanovic, Schmid & Nichols Reference Jovanovic, Schmid and Nichols2014). The amplitude can be physically interpreted as the strength of a particular mode in the dynamical response of a flow system. This analysis is useful to examine nonlinear dynamical behaviour with evolving frequencies. Hence one is able to analyse a particular characteristics or mechanism through an appropriate selection of modes based on their spatial distribution, frequency and growth or decay rate. Among various DMD algorithms, the singular value decomposition (SVD)-based DMD is the most popular and robust algorithm against round-off errors. In the literature (Schmid Reference Schmid2010; Schmid et al.
Reference Schmid, Li, Juniper and Pust2011; Liu & Jaiman Reference Liu and Jaiman2016), the DMD technique was demonstrated for several fluid dynamics problems to examine the flow field characteristics in the space, time and frequency domains via DMD modes. Herein, the focus is on the application of one of the variants of DMD technique, sparsity-promoting dynamic mode decomposition (SP-DMD) by Jovanovic et al. (Reference Jovanovic, Schmid and Nichols2014), to analyse the near-wake stability and to decompose the complex flow dynamics in the near-wake region behind the SBS system. Further details of the SP-DMD formulation can be found in Jovanovic et al. (Reference Jovanovic, Schmid and Nichols2014).
2.3 Problem set-up and verification
The basic apparatus comprises a flexibly mounted cylinder of diameter
 $D$
, placed in a uniform free-stream flow stream
 $U$
. For the side-by-side configuration, another cylinder with an equal diameter is placed at gap distance
 $g$
. The cylinders are placed in a three-dimensional hexahedron domain, where the flow is along the streamwise
 $x$
-axis, while the axis of the cylinder is along the spanwise
 $z$
-axis. The numerical set-up for the 3-D simulation is essentially a spanwise extension of the two-dimensional set-up presented in Liu & Jaiman (Reference Liu and Jaiman2016), where the upstream distance, the downstream distance and the overall height of the fluid domain are respectively
 $50D$
,
 $50D$
and
 $100D$
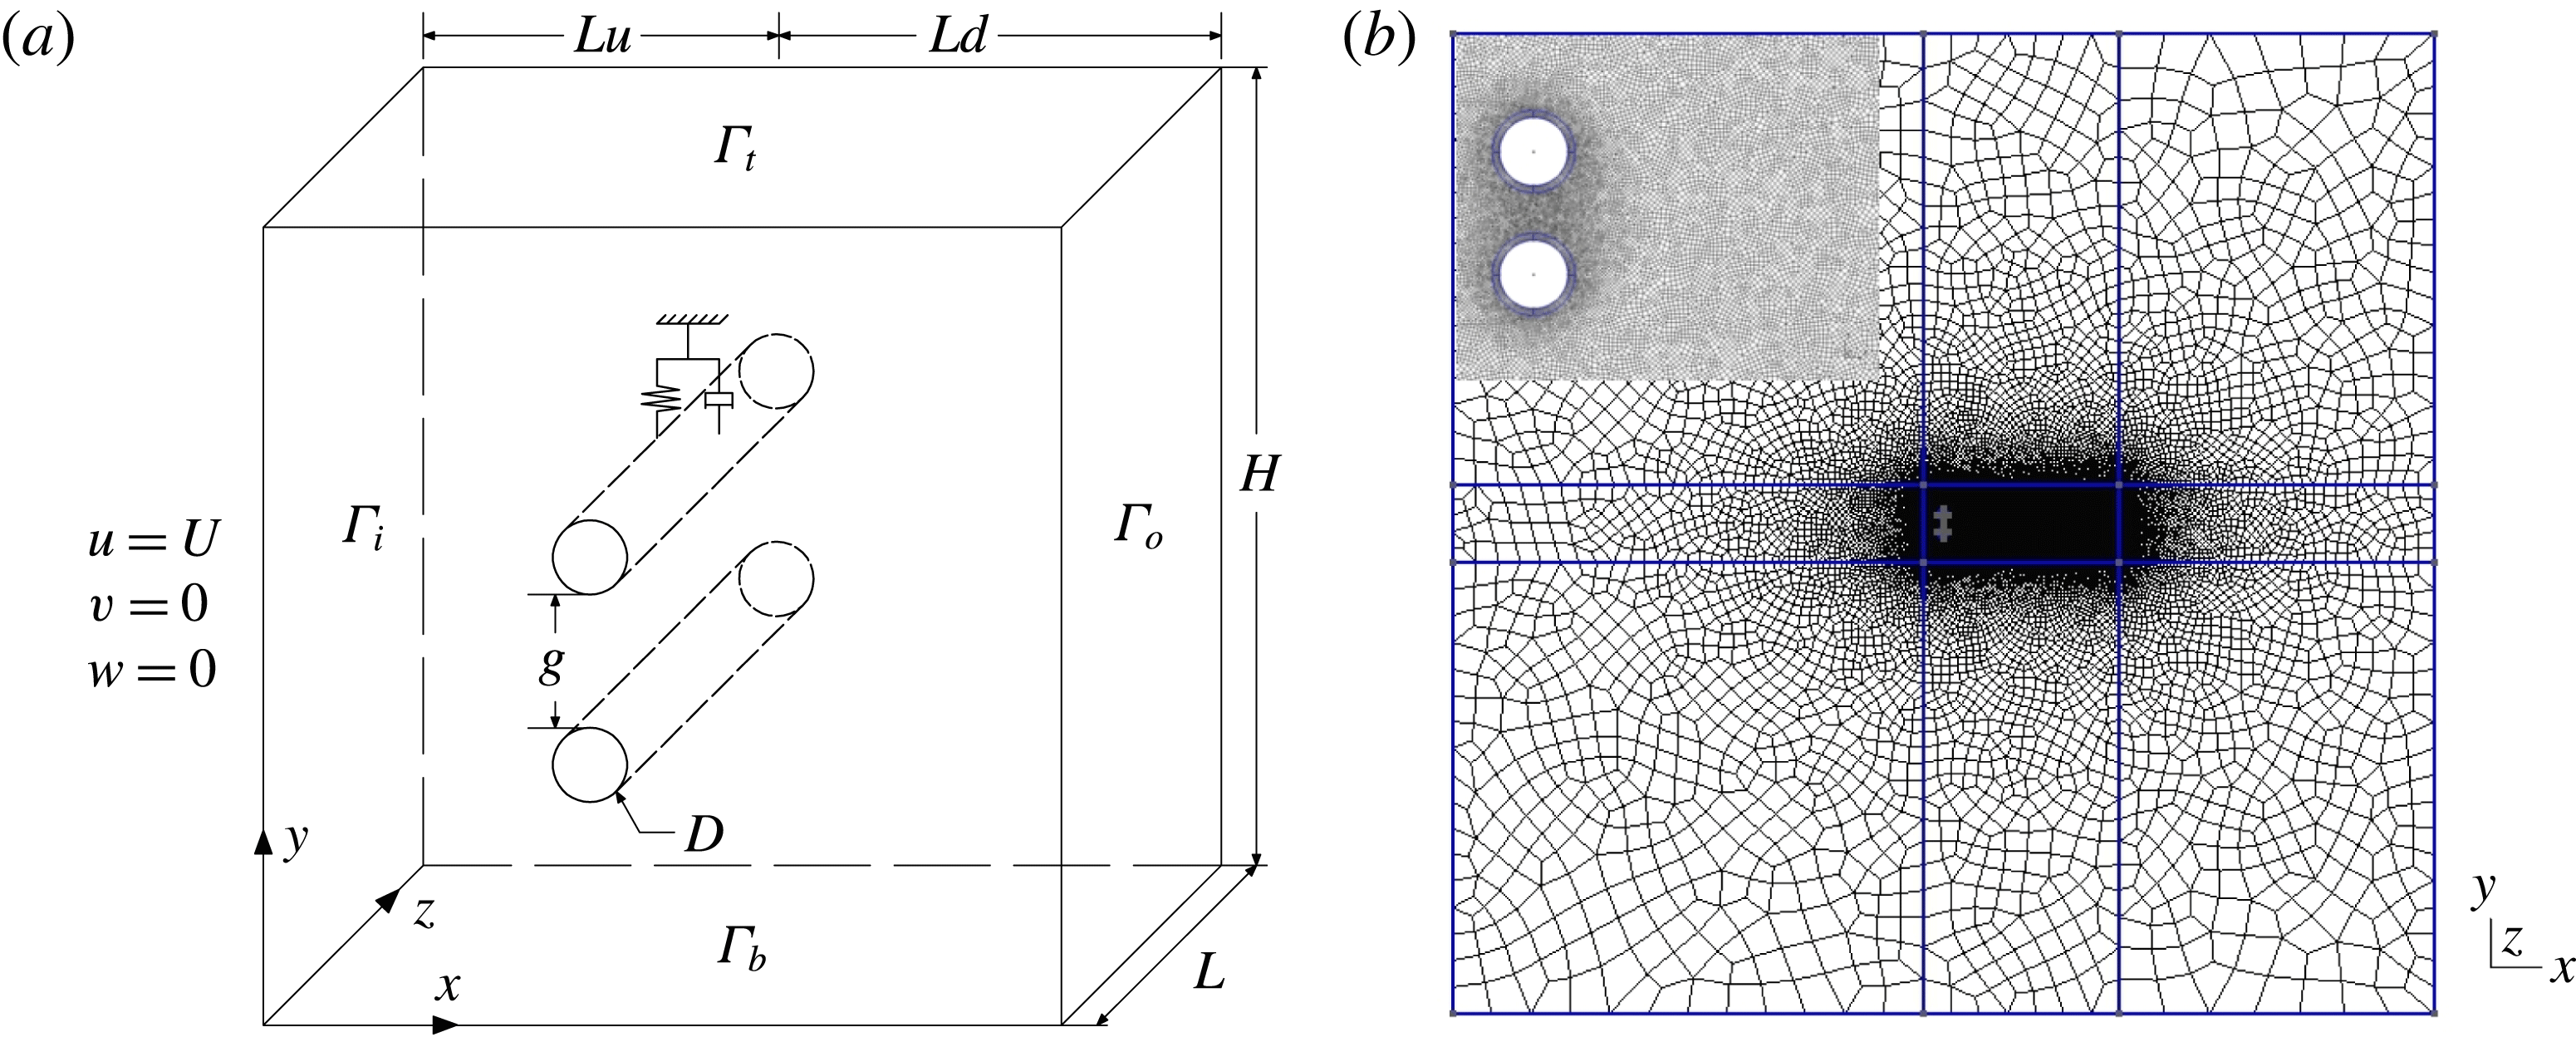
. A schematic diagram of the three-dimensional SBS arrangement is shown in figure 1(a). The traction-free boundary conditions are respectively implemented along the domain boundaries
 $\unicode[STIX]{x1D6E4}_{t}$
,
 $\unicode[STIX]{x1D6E4}_{b}$
and
 $\unicode[STIX]{x1D6E4}_{o}$
. The top cylinder with mass
 $m$
, Cylinder 1, is elastically mounted on a linear spring (with natural frequency
 $f_{n}$
) in the transverse direction for the VSBS arrangements. The blockage ratio is taken as 2 %. A representative
 $(x,y)$
-plane sectional mesh configuration is exhibited in figure 1(b). Based on the mesh convergence analysis in Liu & Jaiman (Reference Liu and Jaiman2016), the spatial discretization error is less than 1 % in the
 $(x,y)$
-plane mesh. For the 3-D flow at
 $Re=500$
, the
 $(x,y)$
sectional mesh is further refined, particularly the mesh within the boundary layer and the near-wake regions. Here
 $\unicode[STIX]{x1D70C}$
and
 $\unicode[STIX]{x1D707}$
denote the fluid density and the dynamic viscosity, respectively. The dimensionless wall distance
 $y^{+}$
is kept less than one (within the viscous sublayer) for the first layer of the structural mesh around bluff bodies. The increment ratio of element size from the boundary layer to the near-wake region and far field is less than
 $1.1$
to reduce the effect of element skewness. Overall, there are approximately
 $80\times 10^{3}$
elements and
 $120\times 10^{3}$
elements for each
 $(x,y)$
section for the isolated cylinder cases and SBS arrangement cases, respectively.
Three-dimensional computational set-up of side-by-side (SBS) arrangement: (a) schematic diagram of the fluid domain and the boundary conditions; (b) representative unstructured mesh distribution in
 $(x,y)$
-plane at
 $g^{\ast }=0.8$
. Here Cylinder 1 is free to vibrate in transverse direction and Cylinder 2 is stationary.

Convergence of global flow quantities at different spanwise mesh resolutions for a stationary isolated circular cylinder at
 $Re=500$
and
 $l^{\ast }=10$
.

Convergence of global flow quantities for different
 $(x,y)$
meshes for a stationary isolated circular cylinder at
 $Re=500$
,
 $\unicode[STIX]{x0394}z=0.15$
and
 $l^{\ast }=10$
.

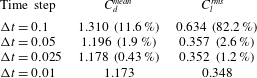
Convergence of integrated force quantities at different time steps for a stationary isolated circular cylinder at
 $Re=500$
,
 $\unicode[STIX]{x0394}z=0.15$
and
 $l^{\ast }=10$
.
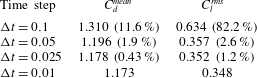
The spanwise length is taken as
 $l^{\ast }=10$
, based on the aspect ratio analysis in the numerical simulations from Lei, Cheng & Kavanagh (Reference Lei, Cheng and Kavanagh2001) and the experiments from Szepessy & Bearman (Reference Szepessy and Bearman1992). A periodic boundary condition is employed at the ends of the cylinder span to eliminate the end-plate effect. The mesh convergence study along the
 $z$
-axis is shown in table 1. The spanwise resolution
 $\unicode[STIX]{x0394}z=0.15$
is chosen such that the spanwise spatial discretization error is controlled within 2.5 % while maintaining the computational efficiency of our parametric study. Furthermore, the
 $(x,y)$
-plane mesh convergence analysis in table 2 shows that the spatial discretization error is within 1 % at the chosen
 $(x,y)$
-plane mesh resolution of
 $81\times 10^{3}$
, which has 160 points along the cylinder surface. Since the gap-flow instability is the key concern of the present investigation, the majority of the investigations are performed at two representative gap ratios
 $g^{\ast }=0.8$
and
 $g^{\ast }=1.0$
. However, the investigations on the boundary circumstances, e.g. around
 $g^{\ast }\approx 0.3$
and
 $g^{\ast }\approx 1.5$
where the gap flow is significantly suppressed and weakened, are still incorporated to facilitate the generality of our analysis. A detailed temporal convergence study of the current numerical solver has been performed in Jaiman et al. (Reference Jaiman, Pillalamarri and Guan2016b
) for two-dimensional cases. The
 $L_{2}$
norm error was reported at approximately 1 % at a constant time step
 $\unicode[STIX]{x0394}t=0.05$
. Results for the temporal convergence of a 3-D stationary isolated circular cylinder at a Reynolds number of 500 are summarized in table 3. The maximum Courant number is approximately 3 for this stationary isolated cylinder case at
 $Re=500$
. Since the fully implicit second-order variational formulation (Jaiman et al.
Reference Jaiman, Pillalamarri and Guan2016b
) based on the generalized-
 $\unicode[STIX]{x1D6FC}$
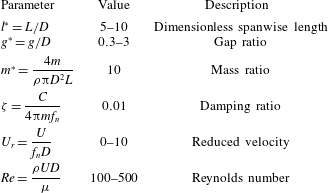
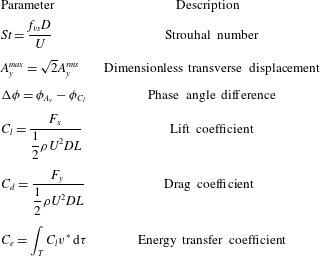
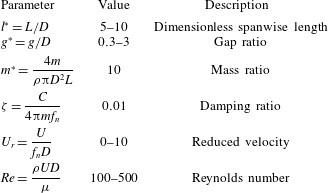
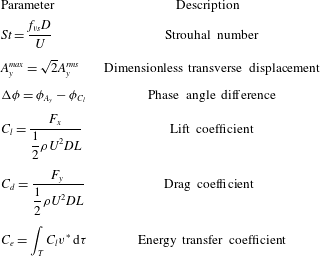
time integration (Jansen, Whiting & Hulbert Reference Jansen, Whiting and Hulbert2000) is employed, the present fluid–structure solver is stable at relatively large Courant numbers while selecting the time step size appropriately to resolve the spatial-temporal dynamics of the vortex-shedding process. The important dimensionless simulation parameters and the post-processing quantities are listed in tables 4 and 5, respectively. In tables 4 and 5, the standard quantities
 $L$
,
 $m$
,
 $C$
,
 $f_{vs}$
,
 $A_{y}^{rms}$
,
 $\unicode[STIX]{x1D719}_{A_{y}}$
,
 $\unicode[STIX]{x1D719}_{C_{l}}$
,
 $F_{x}$
,
 $F_{y}$
and
 $v^{\ast }=v/U$
are respectively the spanwise length of cylinder, the mass of a cylinder, the damping coefficient of structural equation, the vortex-shedding frequency, the root-mean-squared transverse vibration amplitude, the phase angle of
 $A_{y}$
, the phase angle of
 $C_{l}$
, the streamwise hydrodynamic force, the transverse hydrodynamic force and the dimensionless transverse velocity of the vibrating cylinder. Unless otherwise stated, all positions and length scales are normalized by the cylinder diameter
 $D$
, velocities by the free-stream velocity
 $U$
and frequencies by
 $U/D$
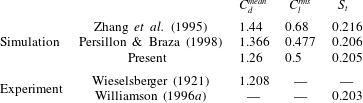
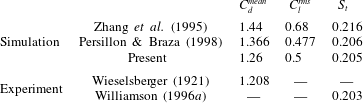
. To validate the numerical formulation in a three-dimensional flow, a comparison with a stationary isolated circular cylinder at
 $Re=300$
is presented in table 6.
Non-dimensional parameters for isolated and side-by-side VIV.
Derived dimensionless quantities for detailed analysis.
Comparison of numerical and experimental results for a stationary isolated circular cylinder at
 $Re=300$
, where
 $C_{d}^{mean}$
is the mean drag coefficient,
 $C_{l}^{rms}$
is the root-mean-squared of lift coefficient fluctuation and
 $St$
is the Strouhal number.
Validation of transverse amplitude
 $A_{y}^{max}$
for a freely vibrating cylinder in three-dimensional flow at
 $m^{\ast }=5.08$
and
 $\unicode[STIX]{x1D701}=0.024$
.

The comparison of the overall VIV response with the previous results of Blackburn et al. (Reference Blackburn, Govardhan and Williamson2001) is shown in table 7. The results are in close agreement with the previous studies, and thus the computational set-up is adequate for our present investigation. A total of eighty-five simulations are performed in the present investigation, comprising seven simulations for the validation of the three-dimensional fluid–structure interaction (FSI) solvers, fifty-two cases for the principal investigation of the isolated, SSBS and VSBS arrangements; and twenty-six two-dimensional cases to investigate the relationship between the near-wake instability, the fluid shearing ratio and the fluid momentum. By taking into consideration a large number of three-dimensional simulations and the involved computational resources, the selected time window is constrained at
 $tU/D\in [250,350]$
, in which the fluid flow is already fully developed for the extraction of flow statistics. In the selected time window, all fluid features, such as the hydrodynamic responses and the vibration amplitude, undergo at least twenty cycles. In particular, we are interested in the behaviour of the flip-flop subjected to the influence of VIV and the three-dimensionality within a short time window.
3 Vortex-induced vibration in three-dimensional flow
Before proceeding to further investigation on the complex coupling between the 3-D flow, the VIV and the gap-flow kinematics in the SBS arrangements, the interference of the VIV on the 3-D flow dynamics is systematically examined first. Similar to the work of Papaioannou et al. (Reference Papaioannou, Yue, Triantafyllou and Karniadakis2006), three-dimensional effects in the near wake are examined via dimensionless enstrophy, as defined below:
 $$\begin{eqnarray}\displaystyle \unicode[STIX]{x1D709}_{i}(t)=\frac{D^{2}}{U^{2}V}\int _{\unicode[STIX]{x1D6FA}}\unicode[STIX]{x1D714}_{i}^{2}(\boldsymbol{x},t)\,\text{d}V, & & \displaystyle\end{eqnarray}$$
where
 $\unicode[STIX]{x1D714}_{i}$
and
 $V$
denote the
 $i$
-component of vorticity vector and the integration volume, respectively. The enstrophy is decomposed into primary
 $\unicode[STIX]{x1D709}_{z}$
and secondary components
 $\unicode[STIX]{x1D709}_{xy}=\unicode[STIX]{x1D709}_{x}+\unicode[STIX]{x1D709}_{y}$
, where
 $\unicode[STIX]{x1D709}_{i}$
is the time-averaged value of
 $\unicode[STIX]{x1D709}_{i}(t)$
over a time interval. The enstrophy is directly associated with the dissipative effects of the fluid kinetic energy, and the generation and breakdown of coherent flow structures. In particular, the ratio of secondary enstrophy
 $\unicode[STIX]{x1D709}_{xy}$
over the total enstrophy
 $\unicode[STIX]{x1D709}_{t}=\unicode[STIX]{x1D709}_{x}+\unicode[STIX]{x1D709}_{y}+\unicode[STIX]{x1D709}_{z}$
is investigated to quantify the three-dimensionality in the near-wake region. The secondary enstrophy should become negligible for two-dimensional flow. The enstrophy values are computed within a representative control volume (
 $V$
) in the near-wake region and incorporate the majority of the near-wake region where coherent structures are concentrated, e.g.
 $x/D\in [0.6,1.6]$
,
 $y/D\in [-4,4]$
and
 $z/D\in [0,10]$
. The number of data-sampling probes is close to the total number of grid points in the chosen control volume. The sampling frequency is 10 times higher than the primary vortex-shedding frequency. The sampling period is approximately 10 primary vortex-shedding cycles starting from the instance of a peak
 $C_{l}$
value. The enstrophy analysis for an isolated cylinder at
 $Re=500$
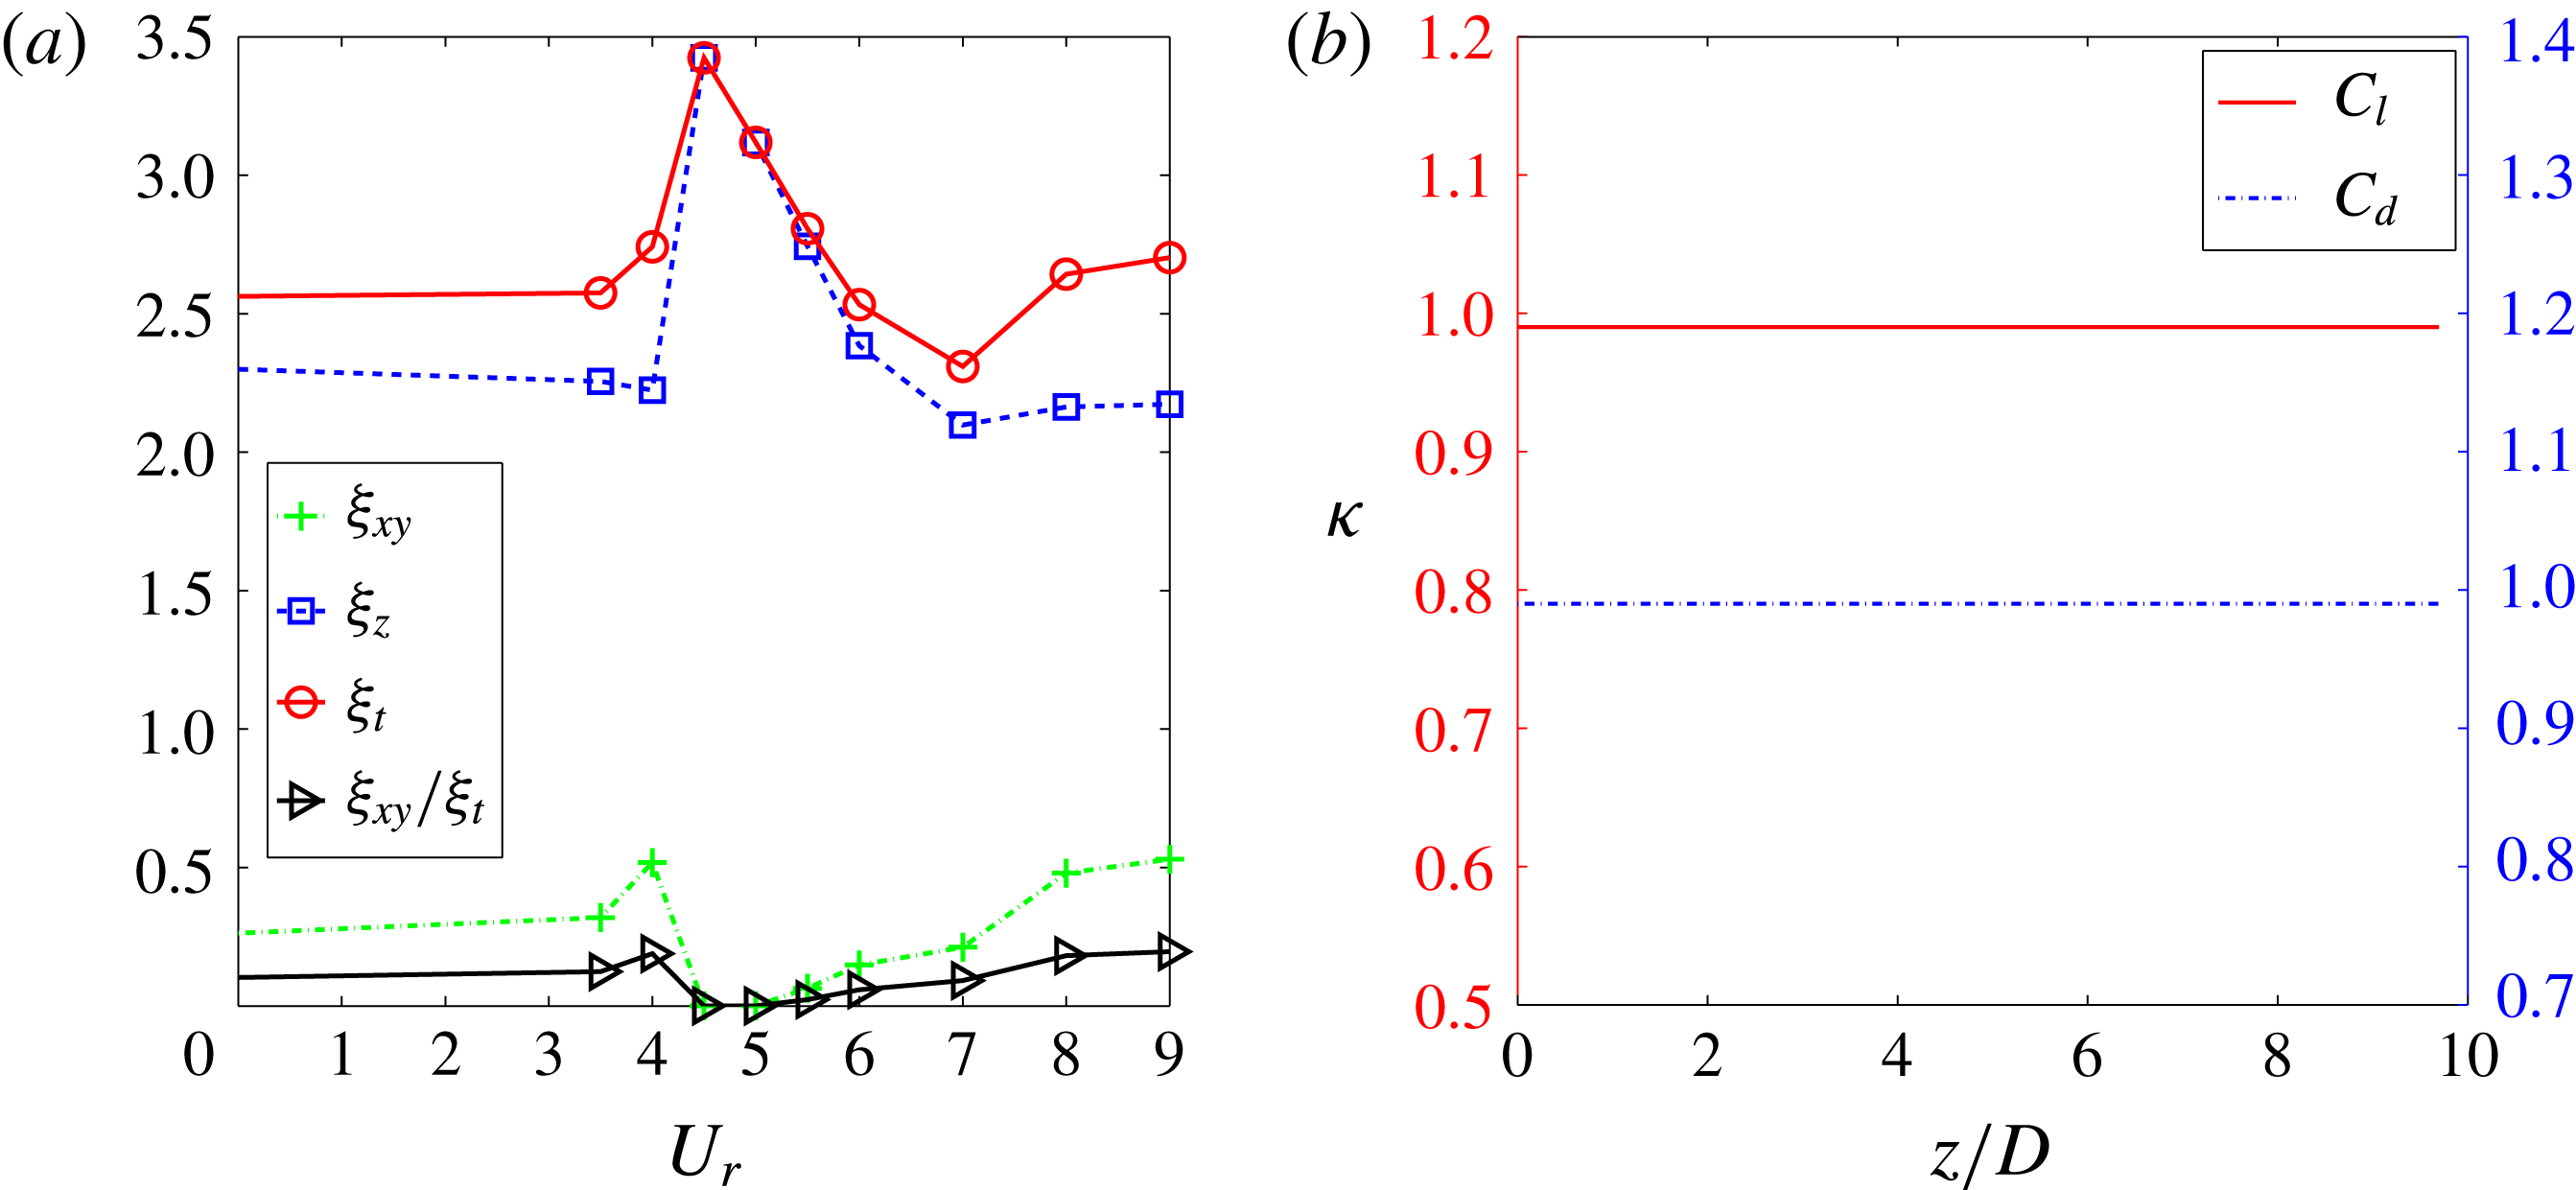
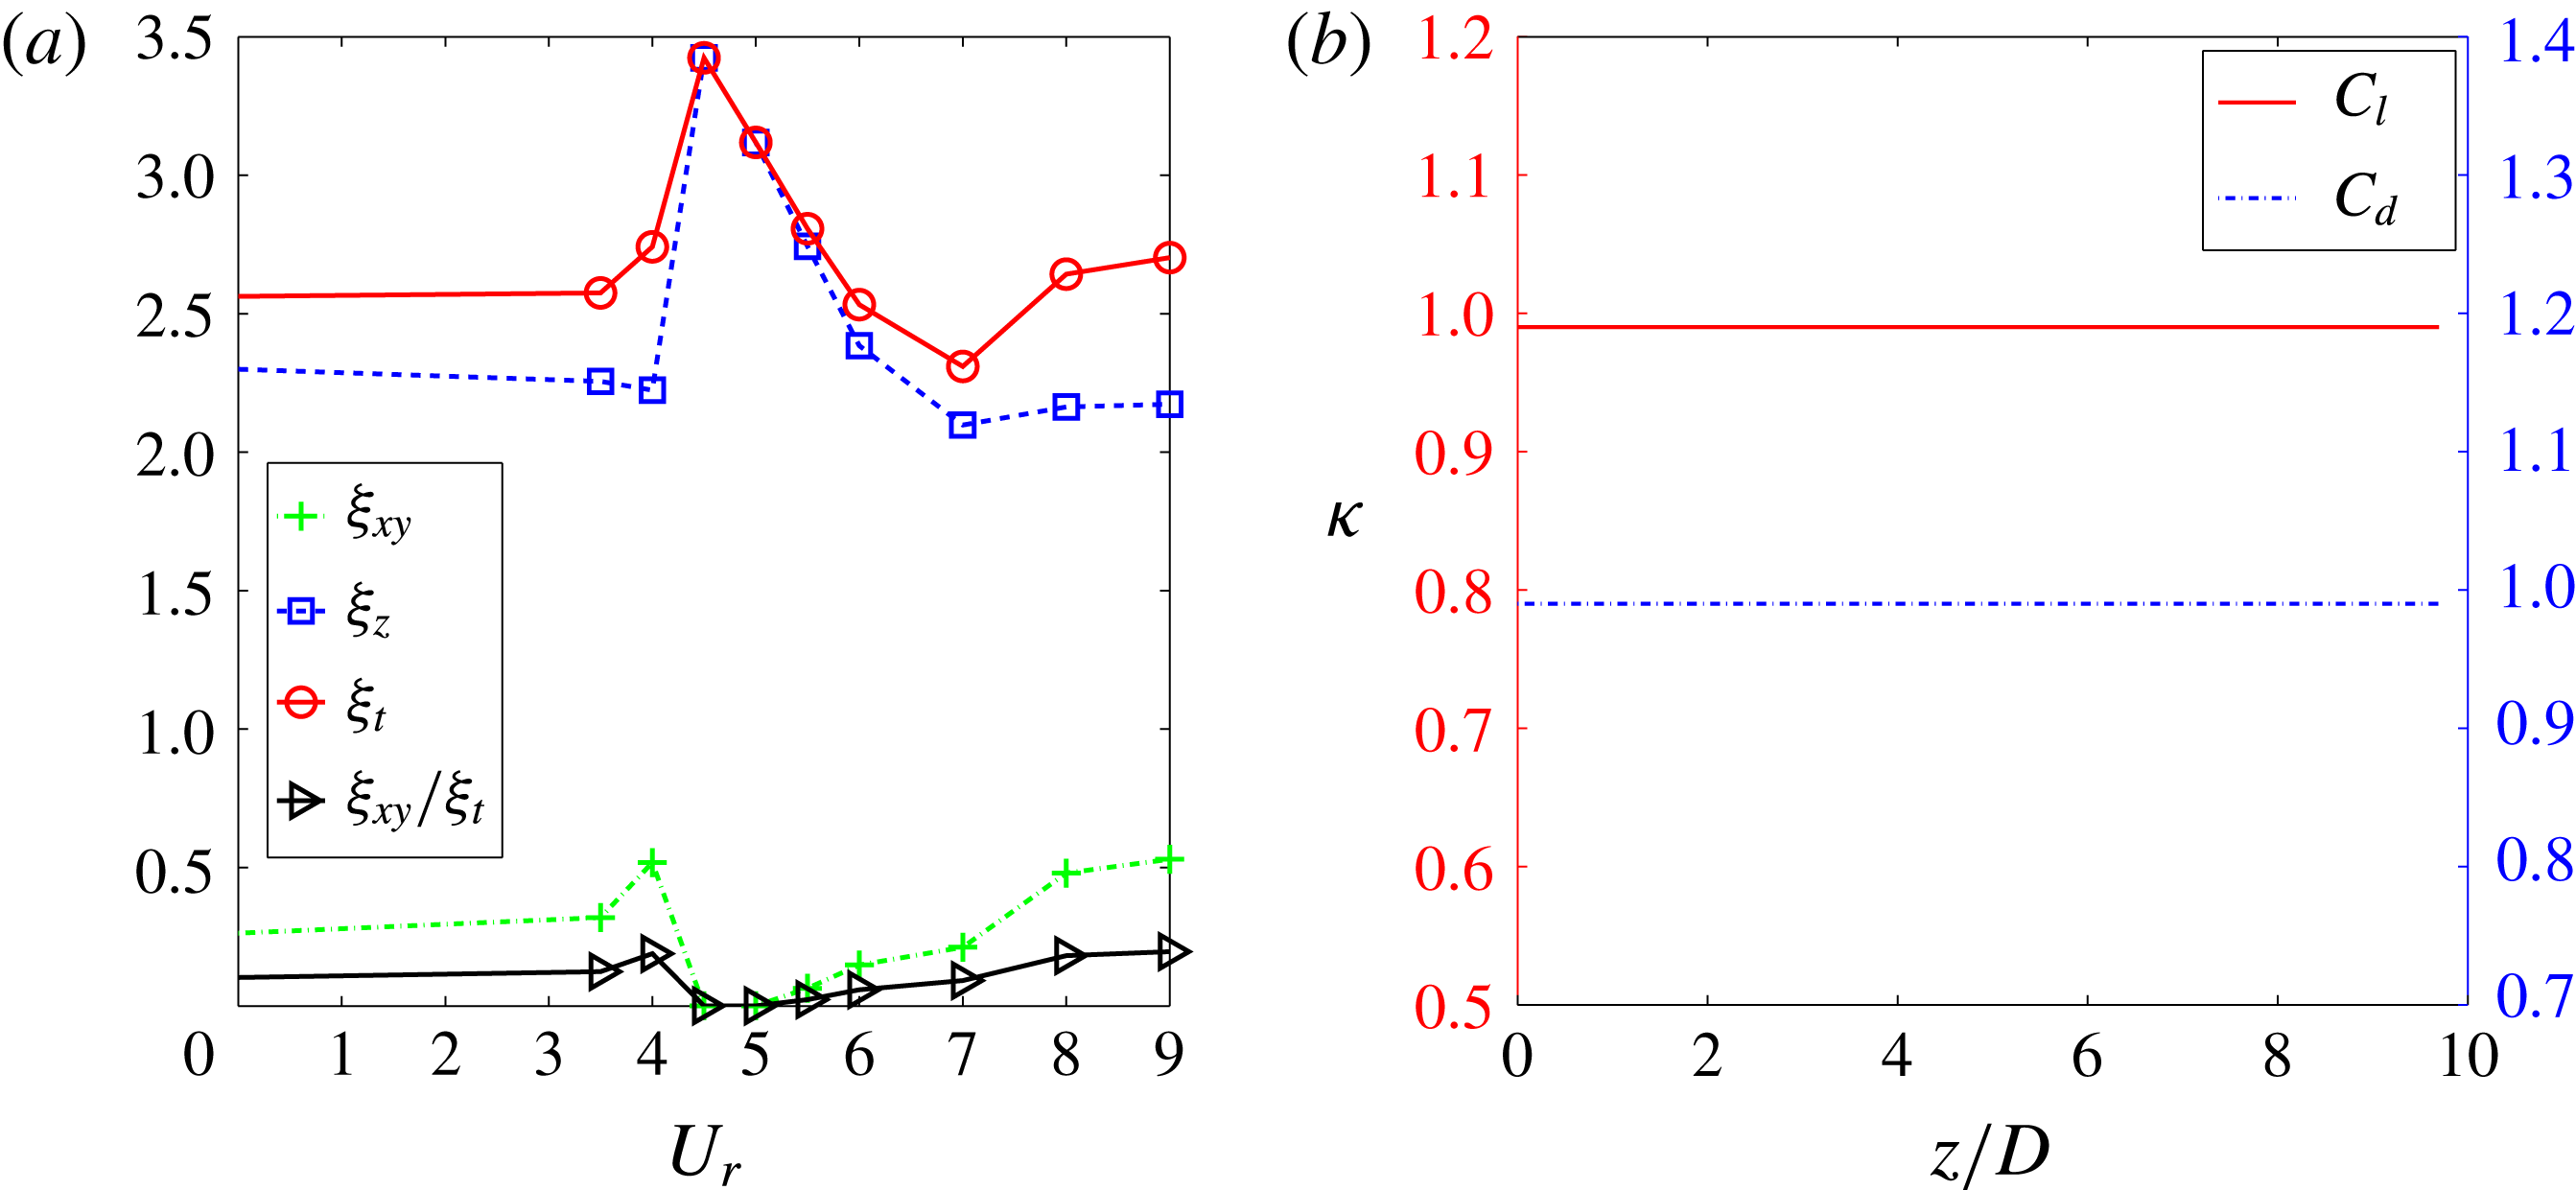
is shown in figure 2(a). Overall, the total enstrophy
 $\unicode[STIX]{x1D709}_{t}$
values are nearly constant at the off lock-in condition. While the values of
 $\unicode[STIX]{x1D709}_{z}$
slightly decrease at post-lock-in,
 $\unicode[STIX]{x1D709}_{xy}$
shows an obvious increase at post-lock-in. Notably, a significant suppression of
 $\unicode[STIX]{x1D709}_{xy}$
,
 $\unicode[STIX]{x1D709}_{xy}/\unicode[STIX]{x1D709}_{t}\approx 0.0$
, is clearly shown at peak lock-in at
 $U_{r}\in [4,5]$
. Sudden variations of
 $\unicode[STIX]{x1D709}_{xy}$
and
 $\unicode[STIX]{x1D709}_{z}$
are observed at the transition from the earlier to the peak lock-in. In a nutshell, we can deduce that (i) the VIV kinematics possesses a regulation effect, whereby the forces are strongly correlated in the spanwise direction at the peak lock-in, and (ii) the streamwise vorticity is significantly suppressed at the peak lock-in.
Quantification of three-dimensionality at
 $Re=500$
,
 $m^{\ast }=10$
,
 $\unicode[STIX]{x1D701}=0.01$
and
 $U_{r}\in [0,9]$
: (a) variation of enstrophy
 $\unicode[STIX]{x1D709}$
with respect to
 $U_{r}$
value, (b) dependence of cross-correlation of hydrodynamic responses at
 $U_{r}=5.0$
.
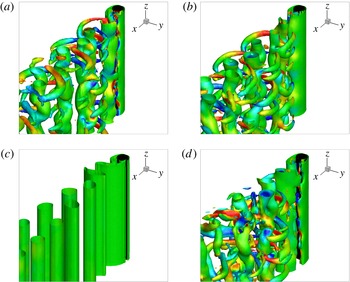
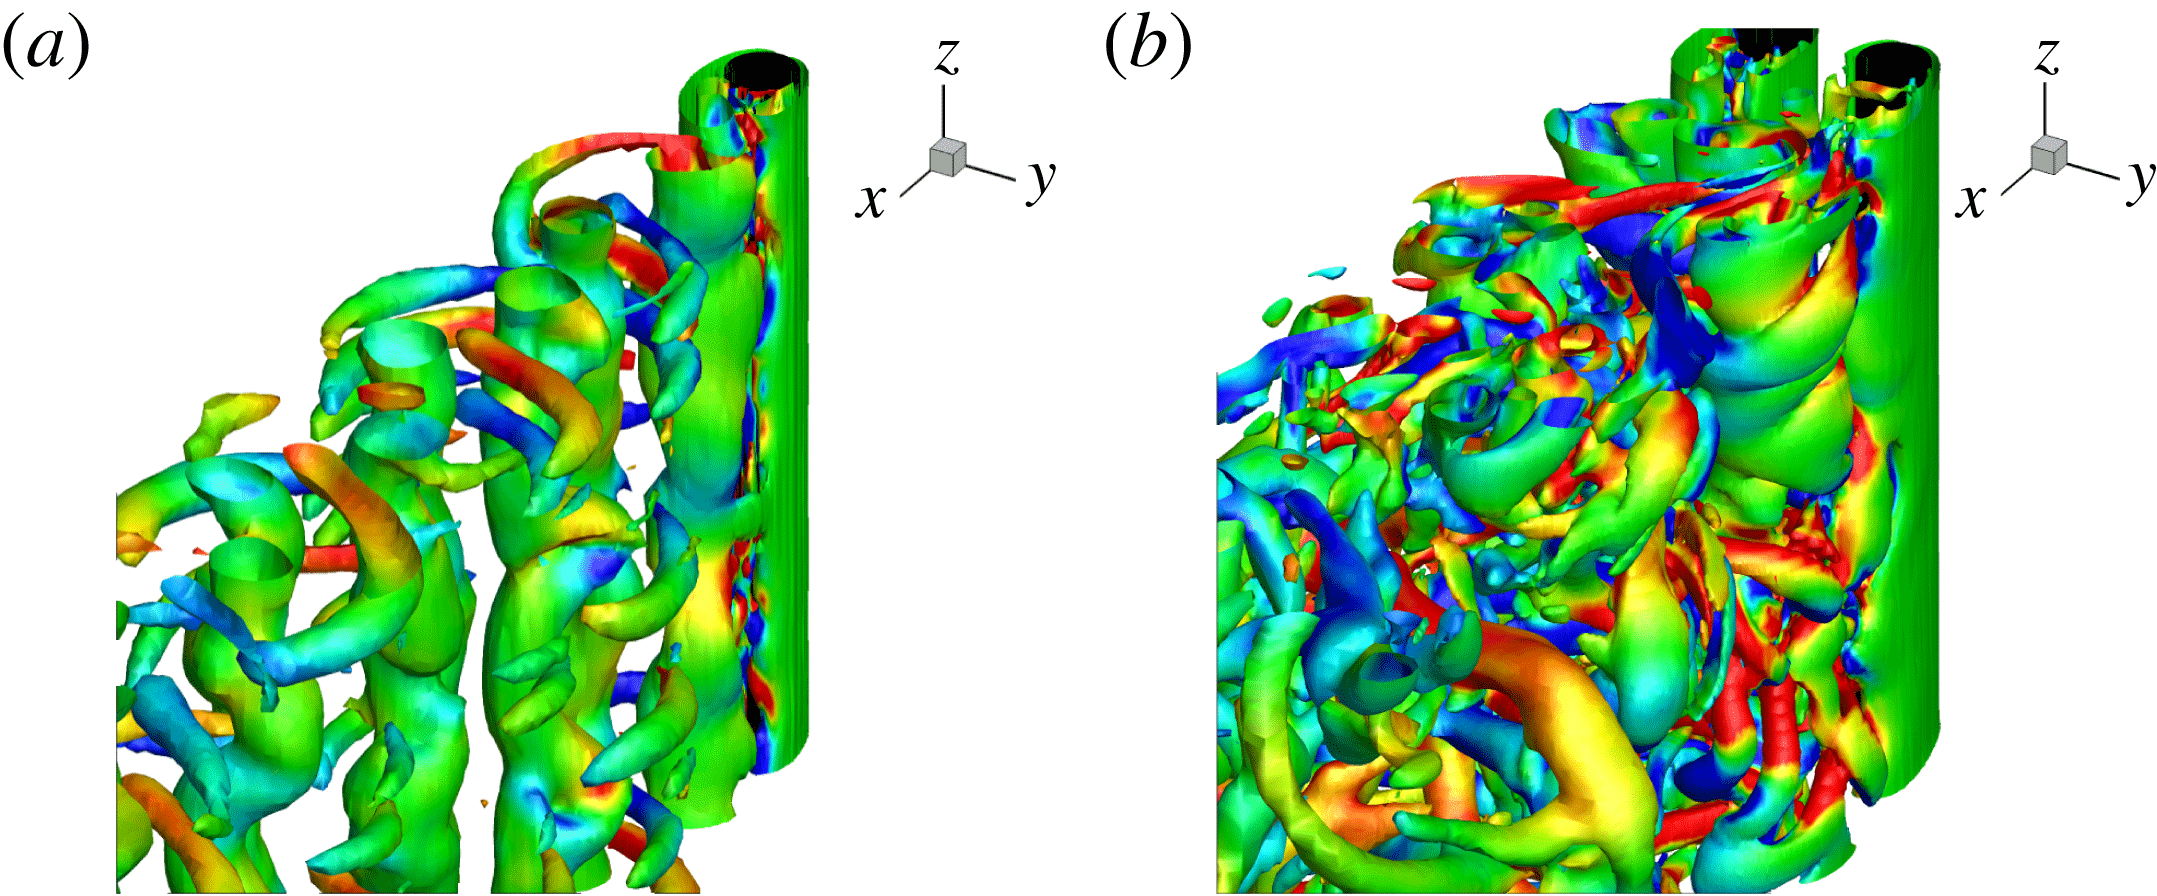
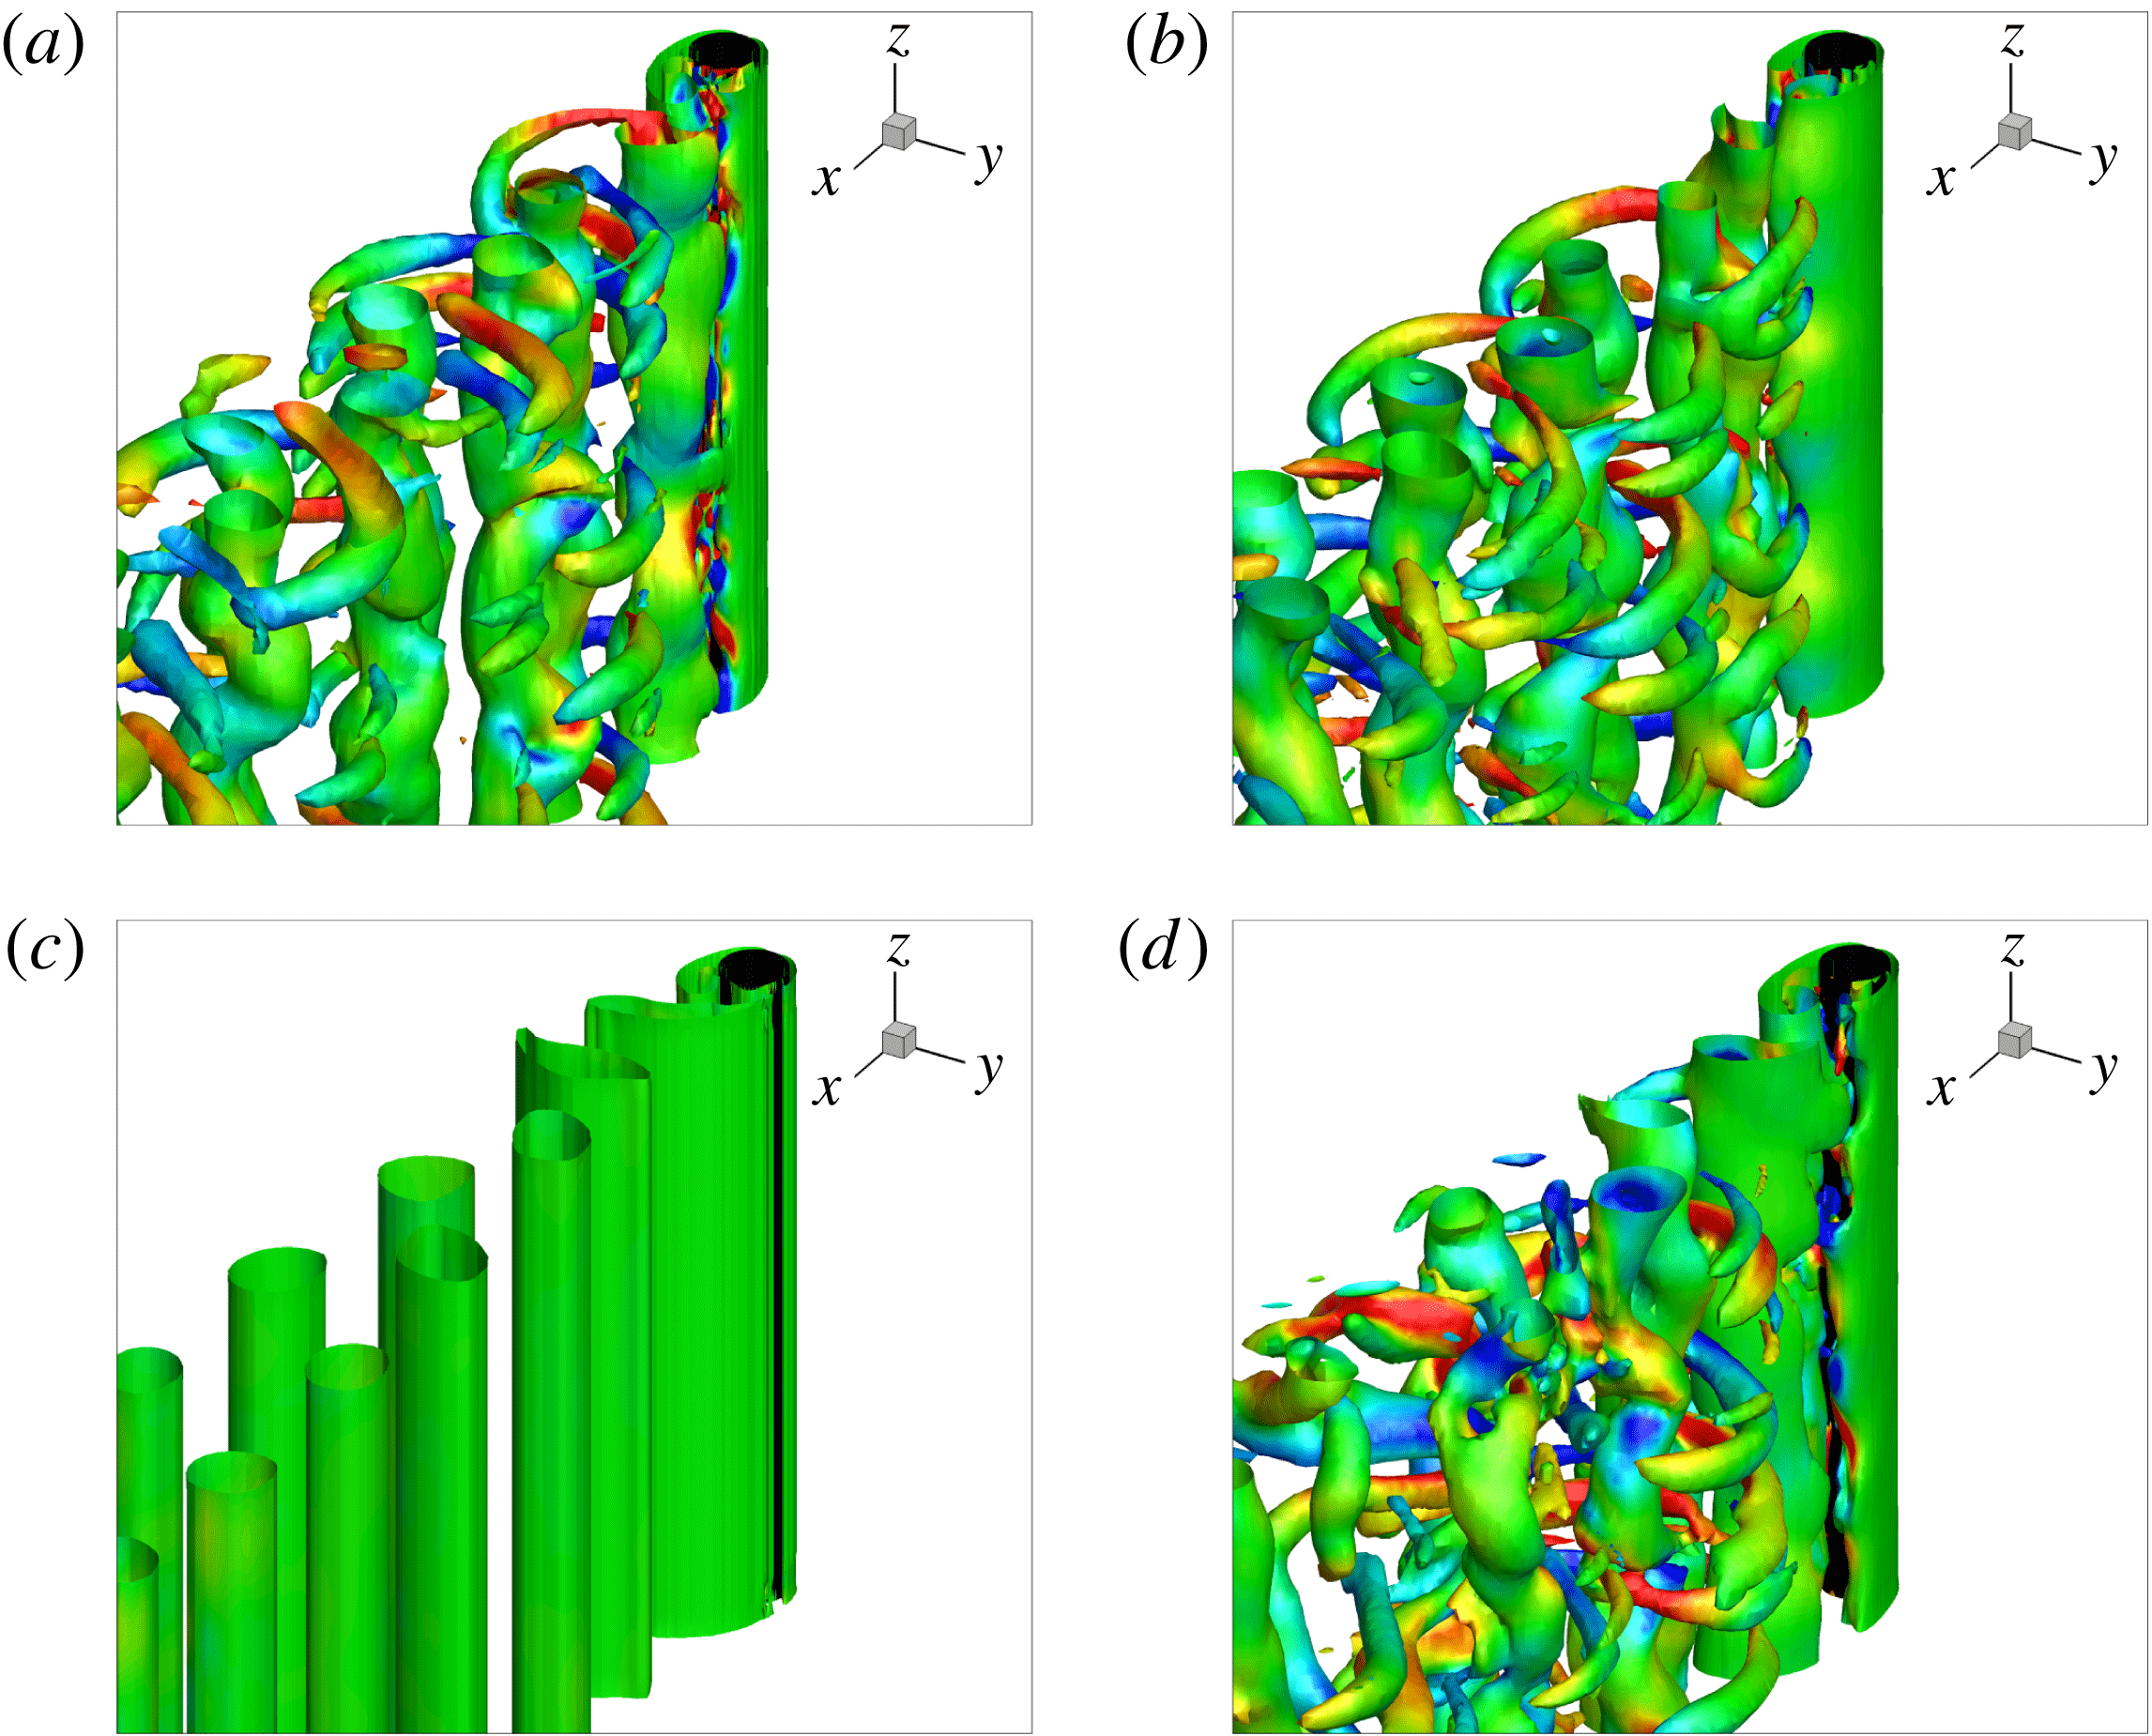
Instantaneous vortical structures using the
 $Q$
-criterion for an isolated cylinder at
 $Re=500$
,
 $Q=0.2$
,
 $\unicode[STIX]{x1D714}_{y}=\pm 1$
(contours) and
 $tU/D=300$
: (a) stationary;
 $U_{r}=$
(b) 3; (c) 5; and (d) 7 at
 $m^{\ast }=10$
and
 $\unicode[STIX]{x1D701}=0.01$
for a freely transversely vibrating cylinder. Streamwise vorticity clusters vanish at the peak lock-in
 $U_{r}=5$
.
Next, we proceed with the spanwise variation of flow dynamics along the cylinder. To measure the waviness of flow properties in the spanwise
 $z$
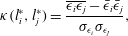
-direction, we quantify the correlation length using the spatial-temporal variations of fluid forces, which are directly dependent on the vorticity distributions in the near-wake region. A correlation length provides a statistical description to identify a representative length scale for the spanwise fluctuations associated with three-dimensional effects. To quantify the degree of spanwise correlation, we define the cross-correlation along the cylinder as follows
 $$\begin{eqnarray}\displaystyle \unicode[STIX]{x1D705}(l_{i}^{\ast },l_{j}^{\ast })=\frac{\overline{\unicode[STIX]{x1D716}_{i}\unicode[STIX]{x1D716}_{j}}-\bar{\unicode[STIX]{x1D716}}_{i}\bar{\unicode[STIX]{x1D716}}_{j}}{\unicode[STIX]{x1D70E}_{\unicode[STIX]{x1D716}_{i}}\unicode[STIX]{x1D70E}_{\unicode[STIX]{x1D716}_{j}}}, & & \displaystyle\end{eqnarray}$$
where
 $i$
and
 $j$
indicate the spanwise locations and
 $\unicode[STIX]{x1D716}_{i}$
,
 $\bar{\unicode[STIX]{x1D716}}_{i}$
and
 $\unicode[STIX]{x1D70E}_{\unicode[STIX]{x1D716}_{i}}$
refer to the scalar quantity at spanwise location
 $l_{i}^{\ast }$
, its time-averaged value and standard deviation, respectively. Using (3.2), we estimate the cross-correlation
 $\unicode[STIX]{x1D705}$
of the spanwise
 $C_{l}$
and
 $C_{d}$
to extract the spanwise fluctuations. While a shorter correlation length implies dominance of spanwise fluctuations (i.e. three-dimensionality), a uniform 2-D flow exhibits a longer correlation length.
A higher value of
 $\unicode[STIX]{x1D705}$
at the peak lock-in in figure 2(b) illustrates the suppression of streamwise vorticity in the near-wake region, as observed in figure 2(a). Such a weakening effect of the spanwise force suggests that there exists a particular regulation mechanism which causes the recovery of 2-D hydrodynamic behaviour along the cylinder. This regulation (stabilization) effect is further visualized by the iso-surfaces of the vortical structures using vortex identification based on the
 $Q$
-criterion (Hunt, Wray & Moin Reference Hunt, Wray and Moin1988) in figure 3. Consistent with these observations, the streamwise vorticity clusters at the lock-in are completely invisible in figure 3(c). An additional 2-D simulation at the identical problem set-up is also performed and the resultant hydrodynamic responses from the 2-D configuration are identical with its 3-D counterpart. Since there is no external energy source to perturb the flow field, we can deduce that the aforementioned recovery of two-dimensionality at the peak lock-in is an intrinsic characteristic of the fluid response, instead of an artificially restricted fluid behaviour.
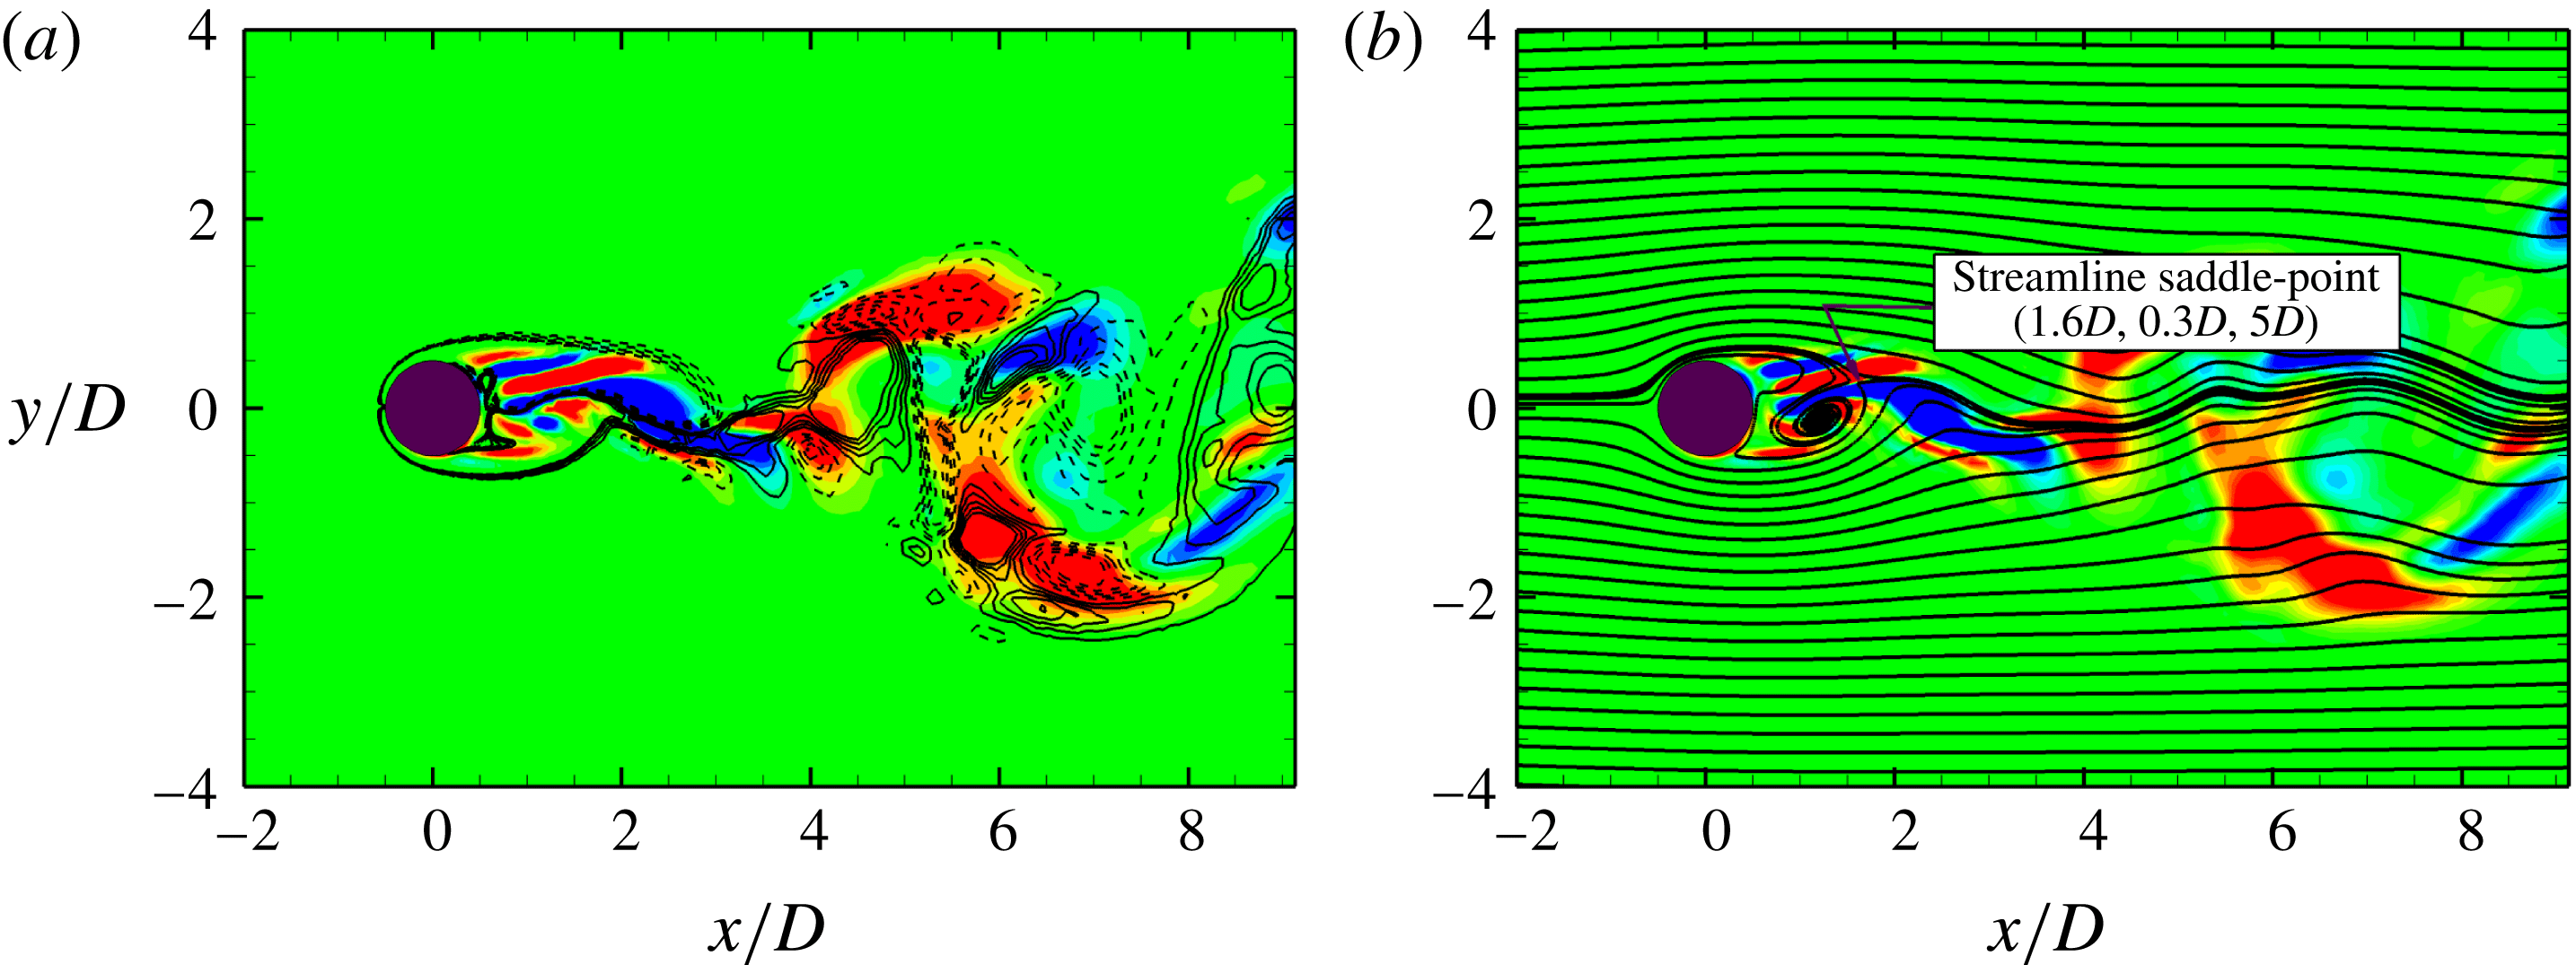
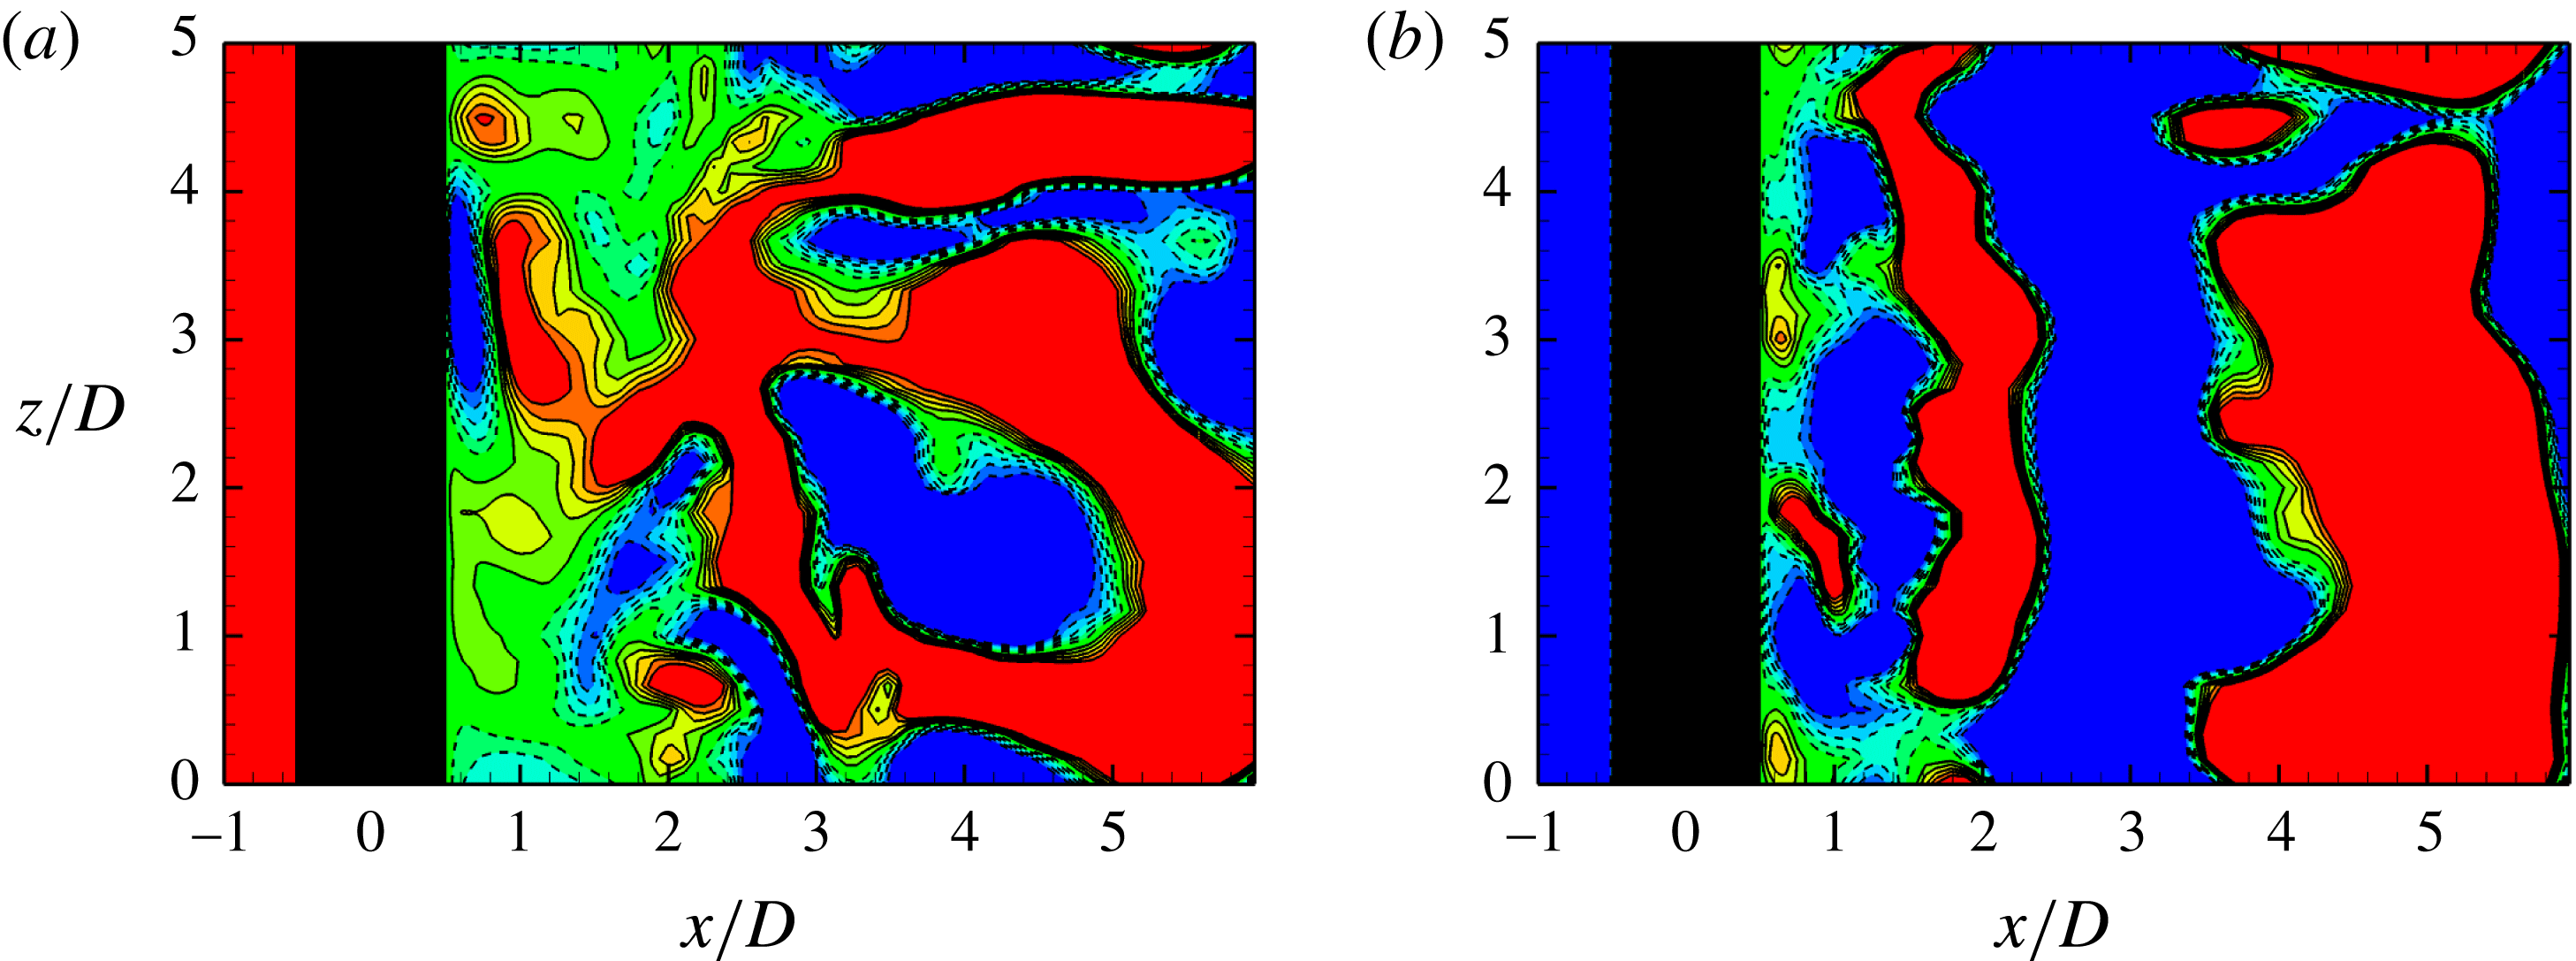
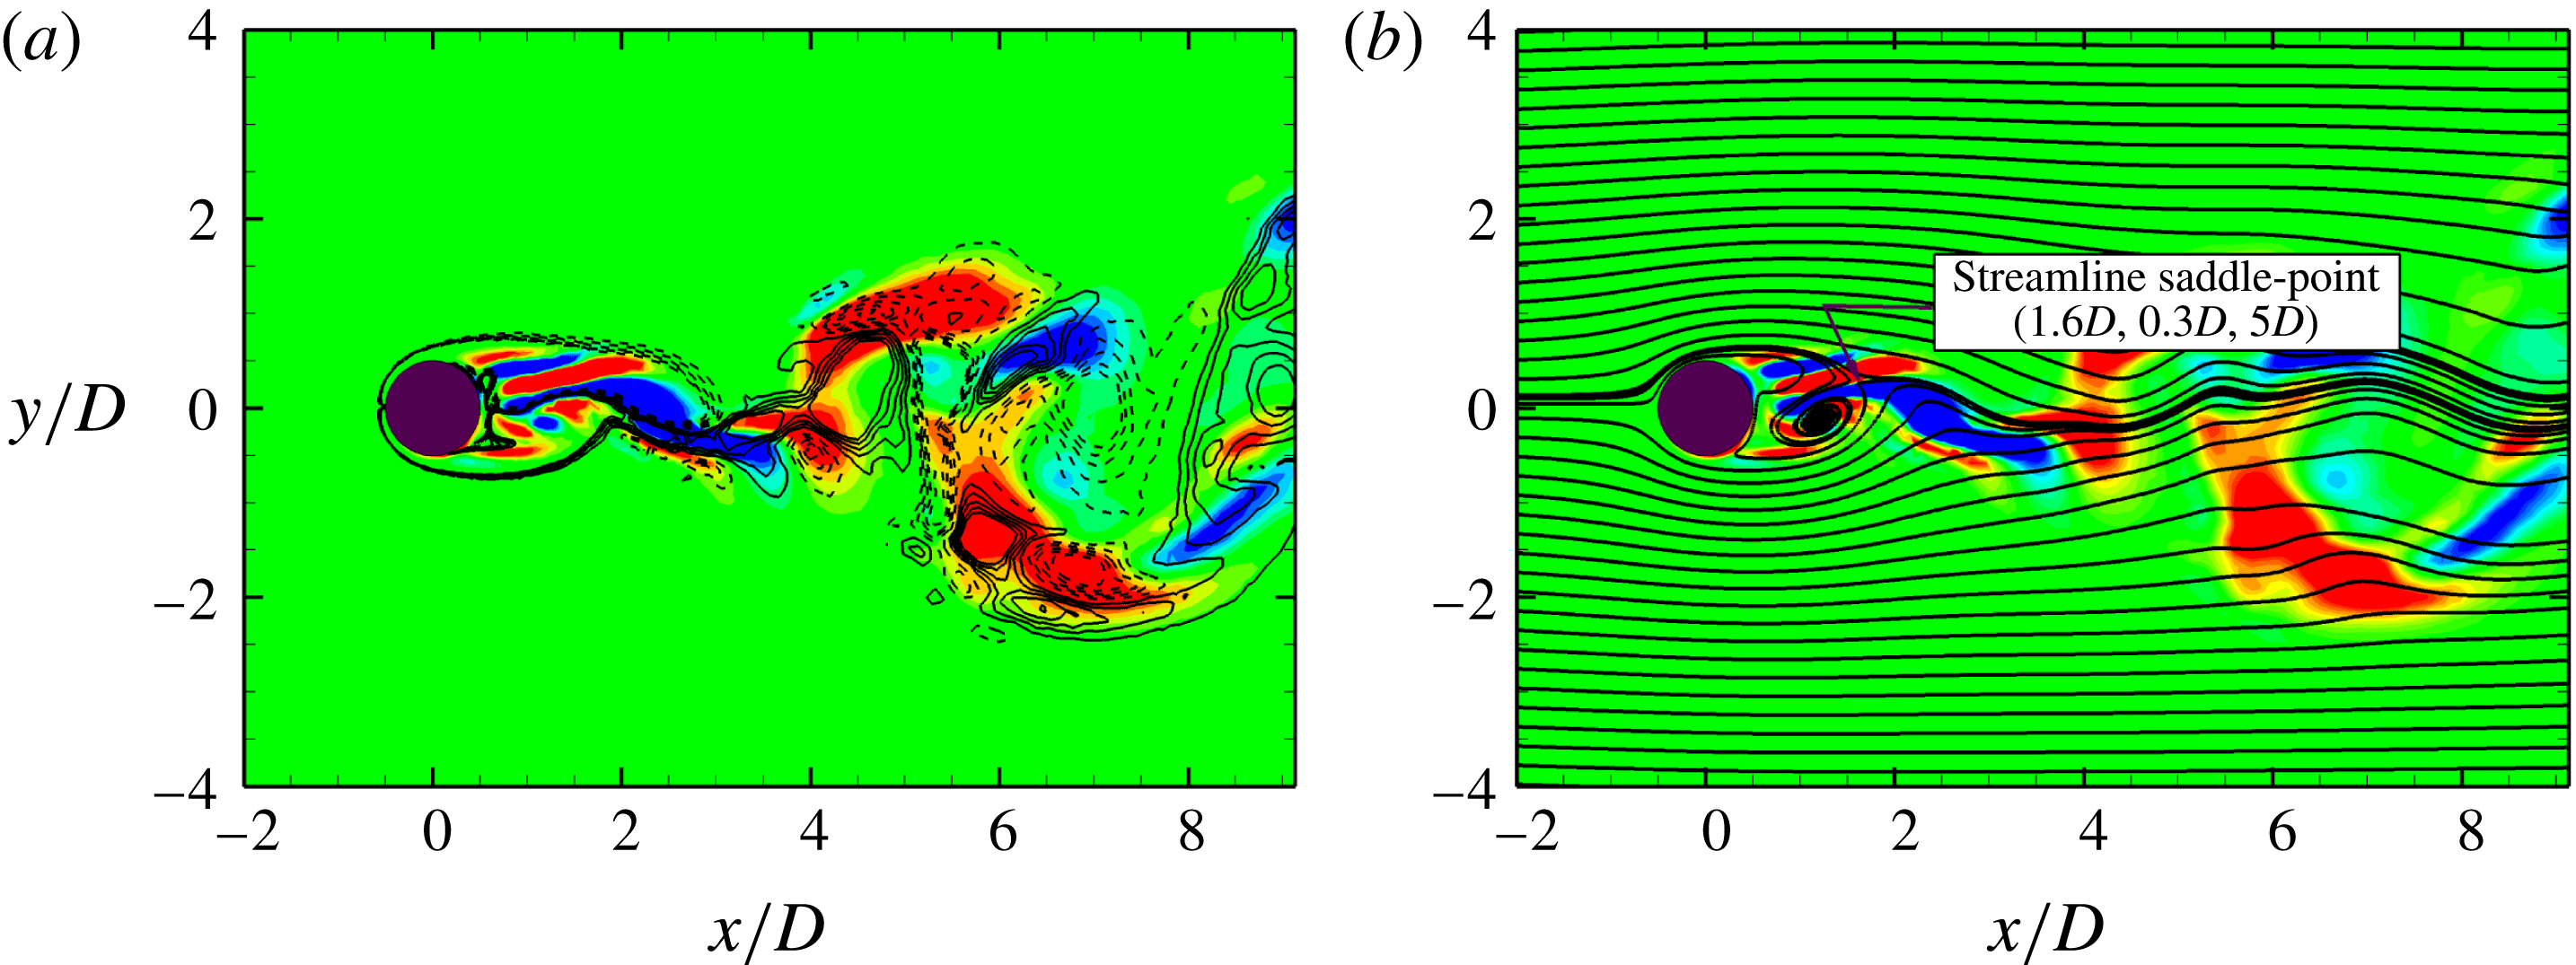
Illustration of saddle-point region along the interface of imbalanced counter-signed vorticity clusters for a stationary cylinder at
 $tU/D=300$
and
 $l^{\ast }=5$
for
 $Re=500$
: (a) contours of
 $\unicode[STIX]{x1D714}_{x}=\pm 1.0$
(solid lines) and
 $\unicode[STIX]{x1D714}_{z}=\pm 1.0$
(dashed lines), and (b) sectional streamlines.
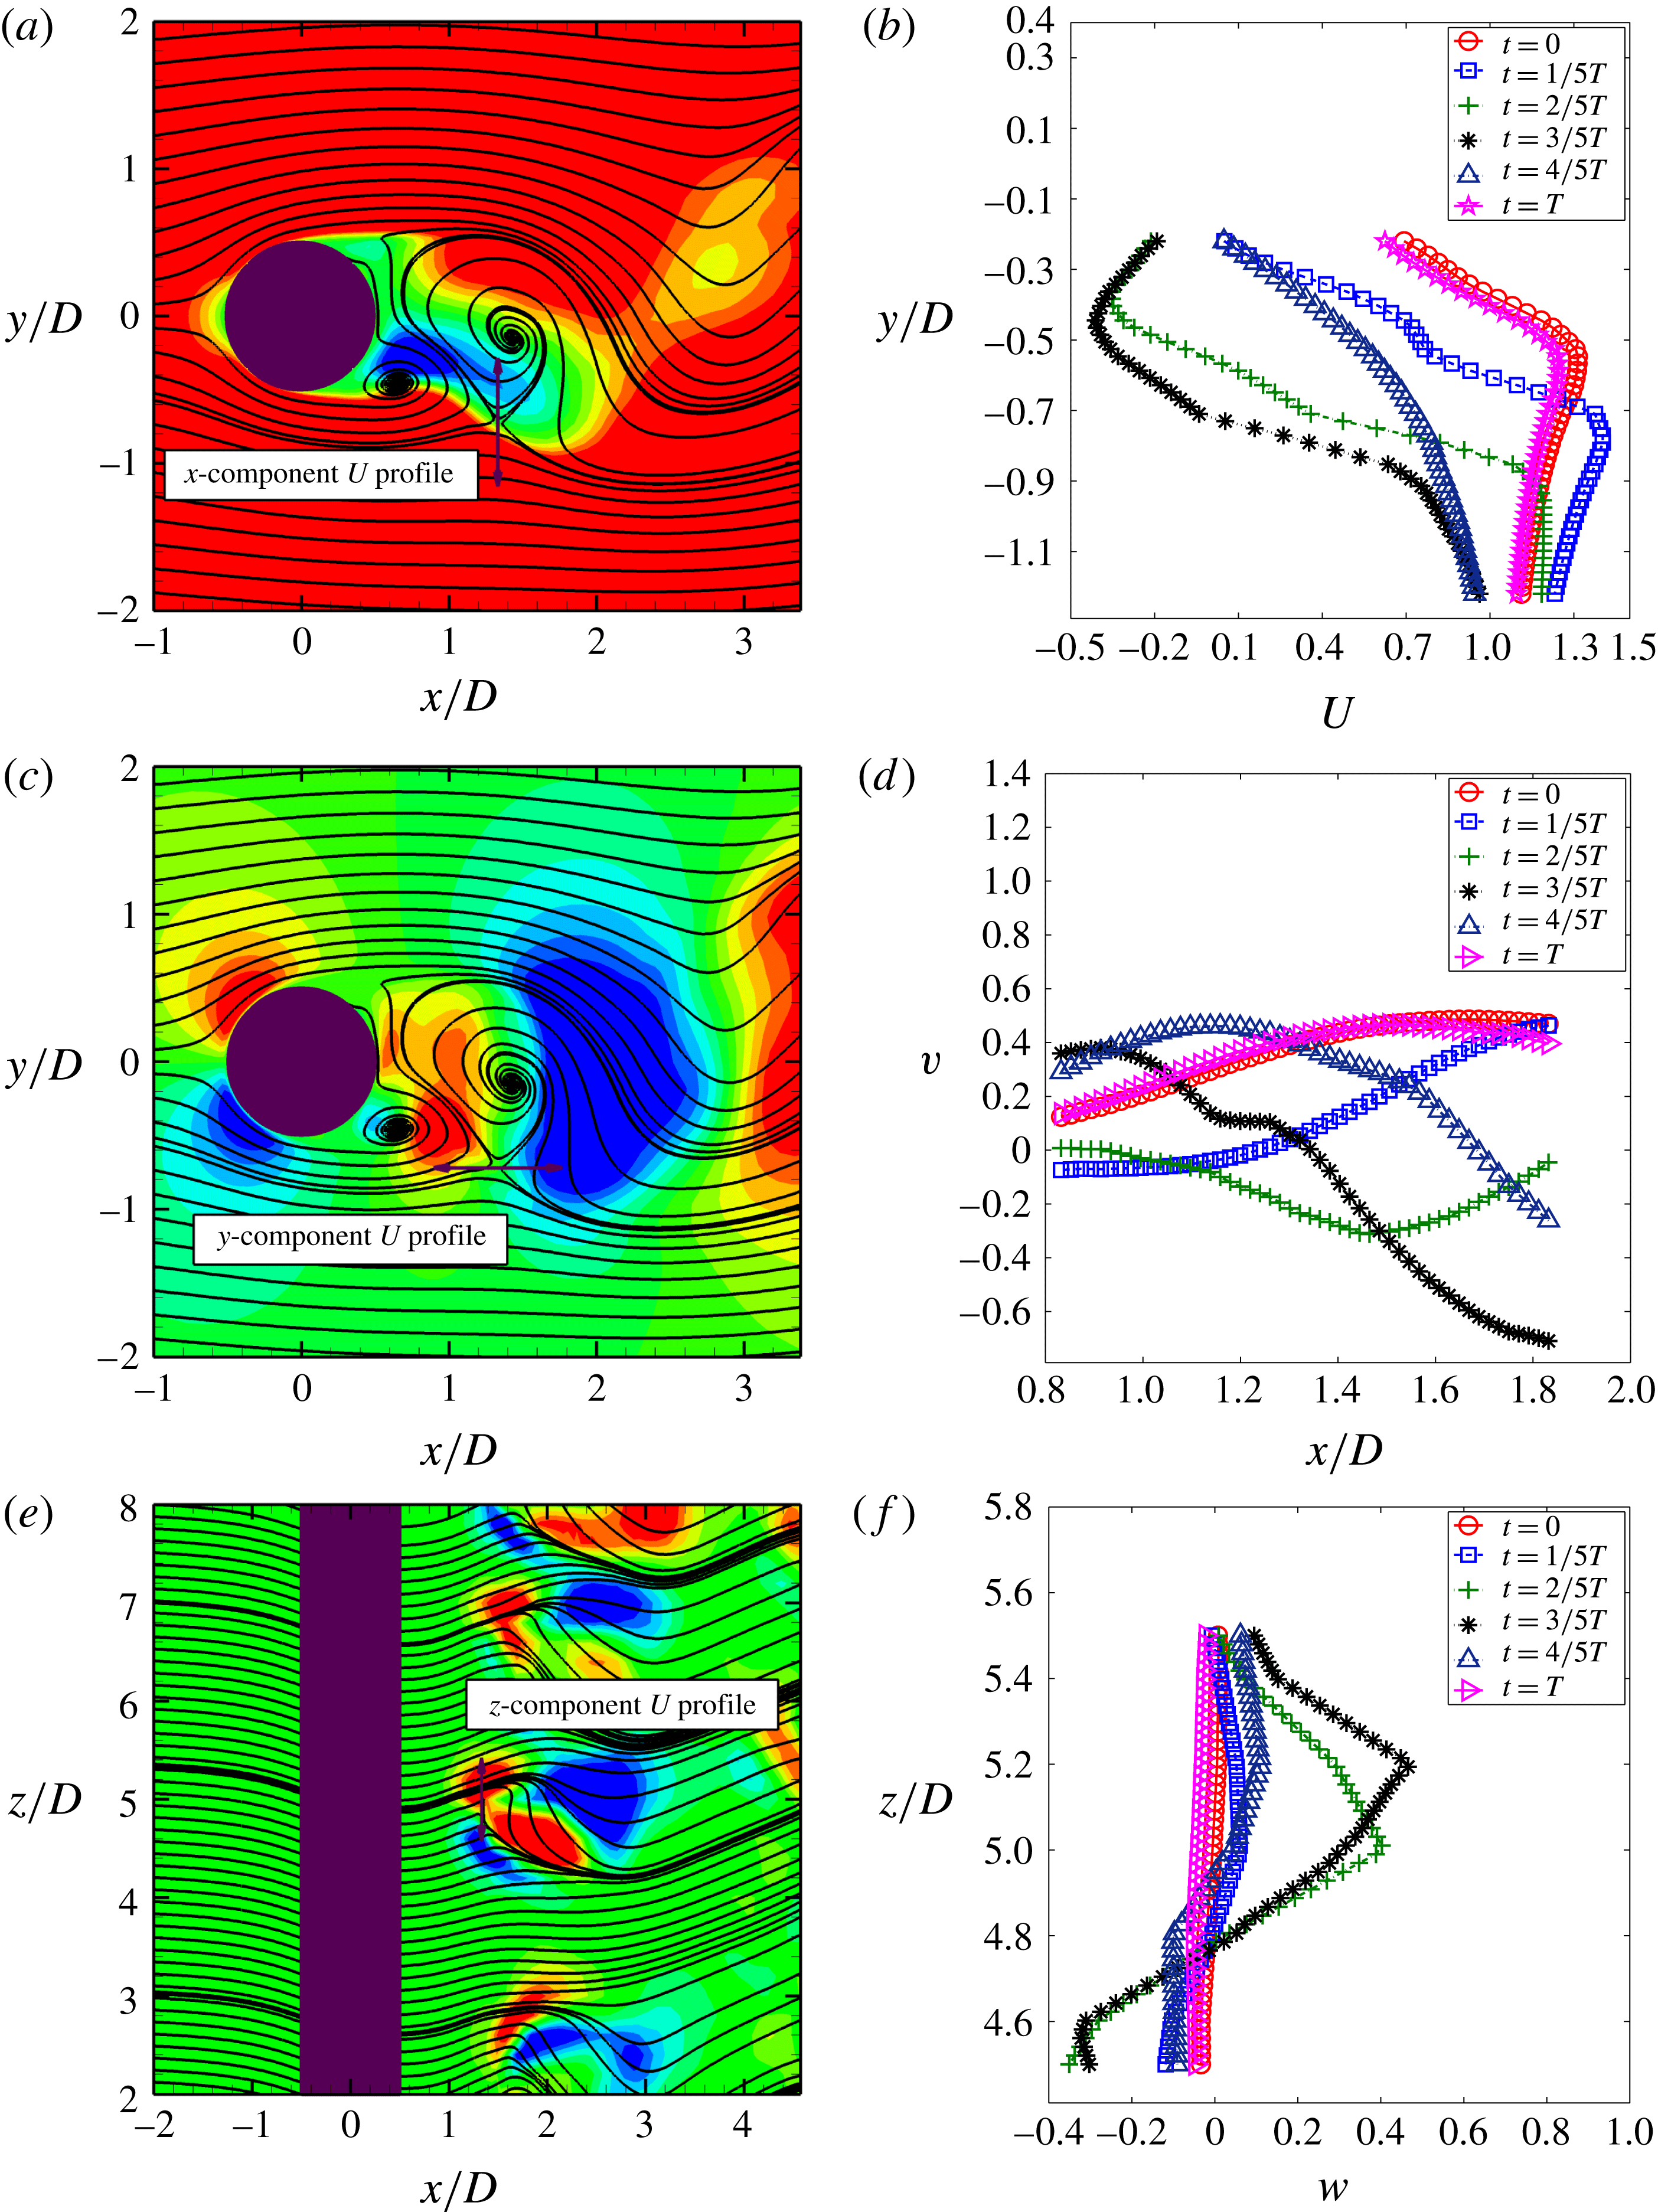
Instantaneous velocity profiles across a streamline saddle point at (
 $1.33D$
,
 $-0.72D$
,
 $5D$
) for a stationary isolated circular cylinder at
 $Re=500$
: (a,b)
 $u$
versus
 $y$
from (
 $1.33D$
,
 $-0.22D$
to
 $-1.22D$
,
 $5D$
),
 $u\in [-0.5,0.5]$
contour; (c,d)
 $v$
versus
 $x$
from (
 $0.83D$
to
 $1.83D$
,
 $-0.72D$
,
 $5D$
),
 $v\in [-0.5,0.5]$
contour; (e,f)
 $w$
versus
 $z$
from (
 $1.33D$
,
 $-0.72D$
,
 $4.5D$
to
 $5.5D$
),
 $w\in [-0.25,0.25]$
contour.
 $T$
is one period of primary vortex-shedding cycle. The inflection points are in the saddle-point region.
Instantaneous contours and sectional streamline topology in the
 $(x,y)$
-plane for a transversely vibrating isolated cylinder at the peak lock-in for one cycle of primary vortex shedding (out-of-phase):
 $Re=500$
,
 $m^{\ast }=10$
,
 $\unicode[STIX]{x1D701}=0.01$
,
 $U_{r}=5$
,
 $l^{\ast }=5$
,
 $\unicode[STIX]{x1D714}_{z}=\pm 1.0$
, contours in (a,c,e), and velocity amplitude
 $|U|=\sqrt{U^{2}+V^{2}}\in [0,1.5]$
, contours in (b,d,f).

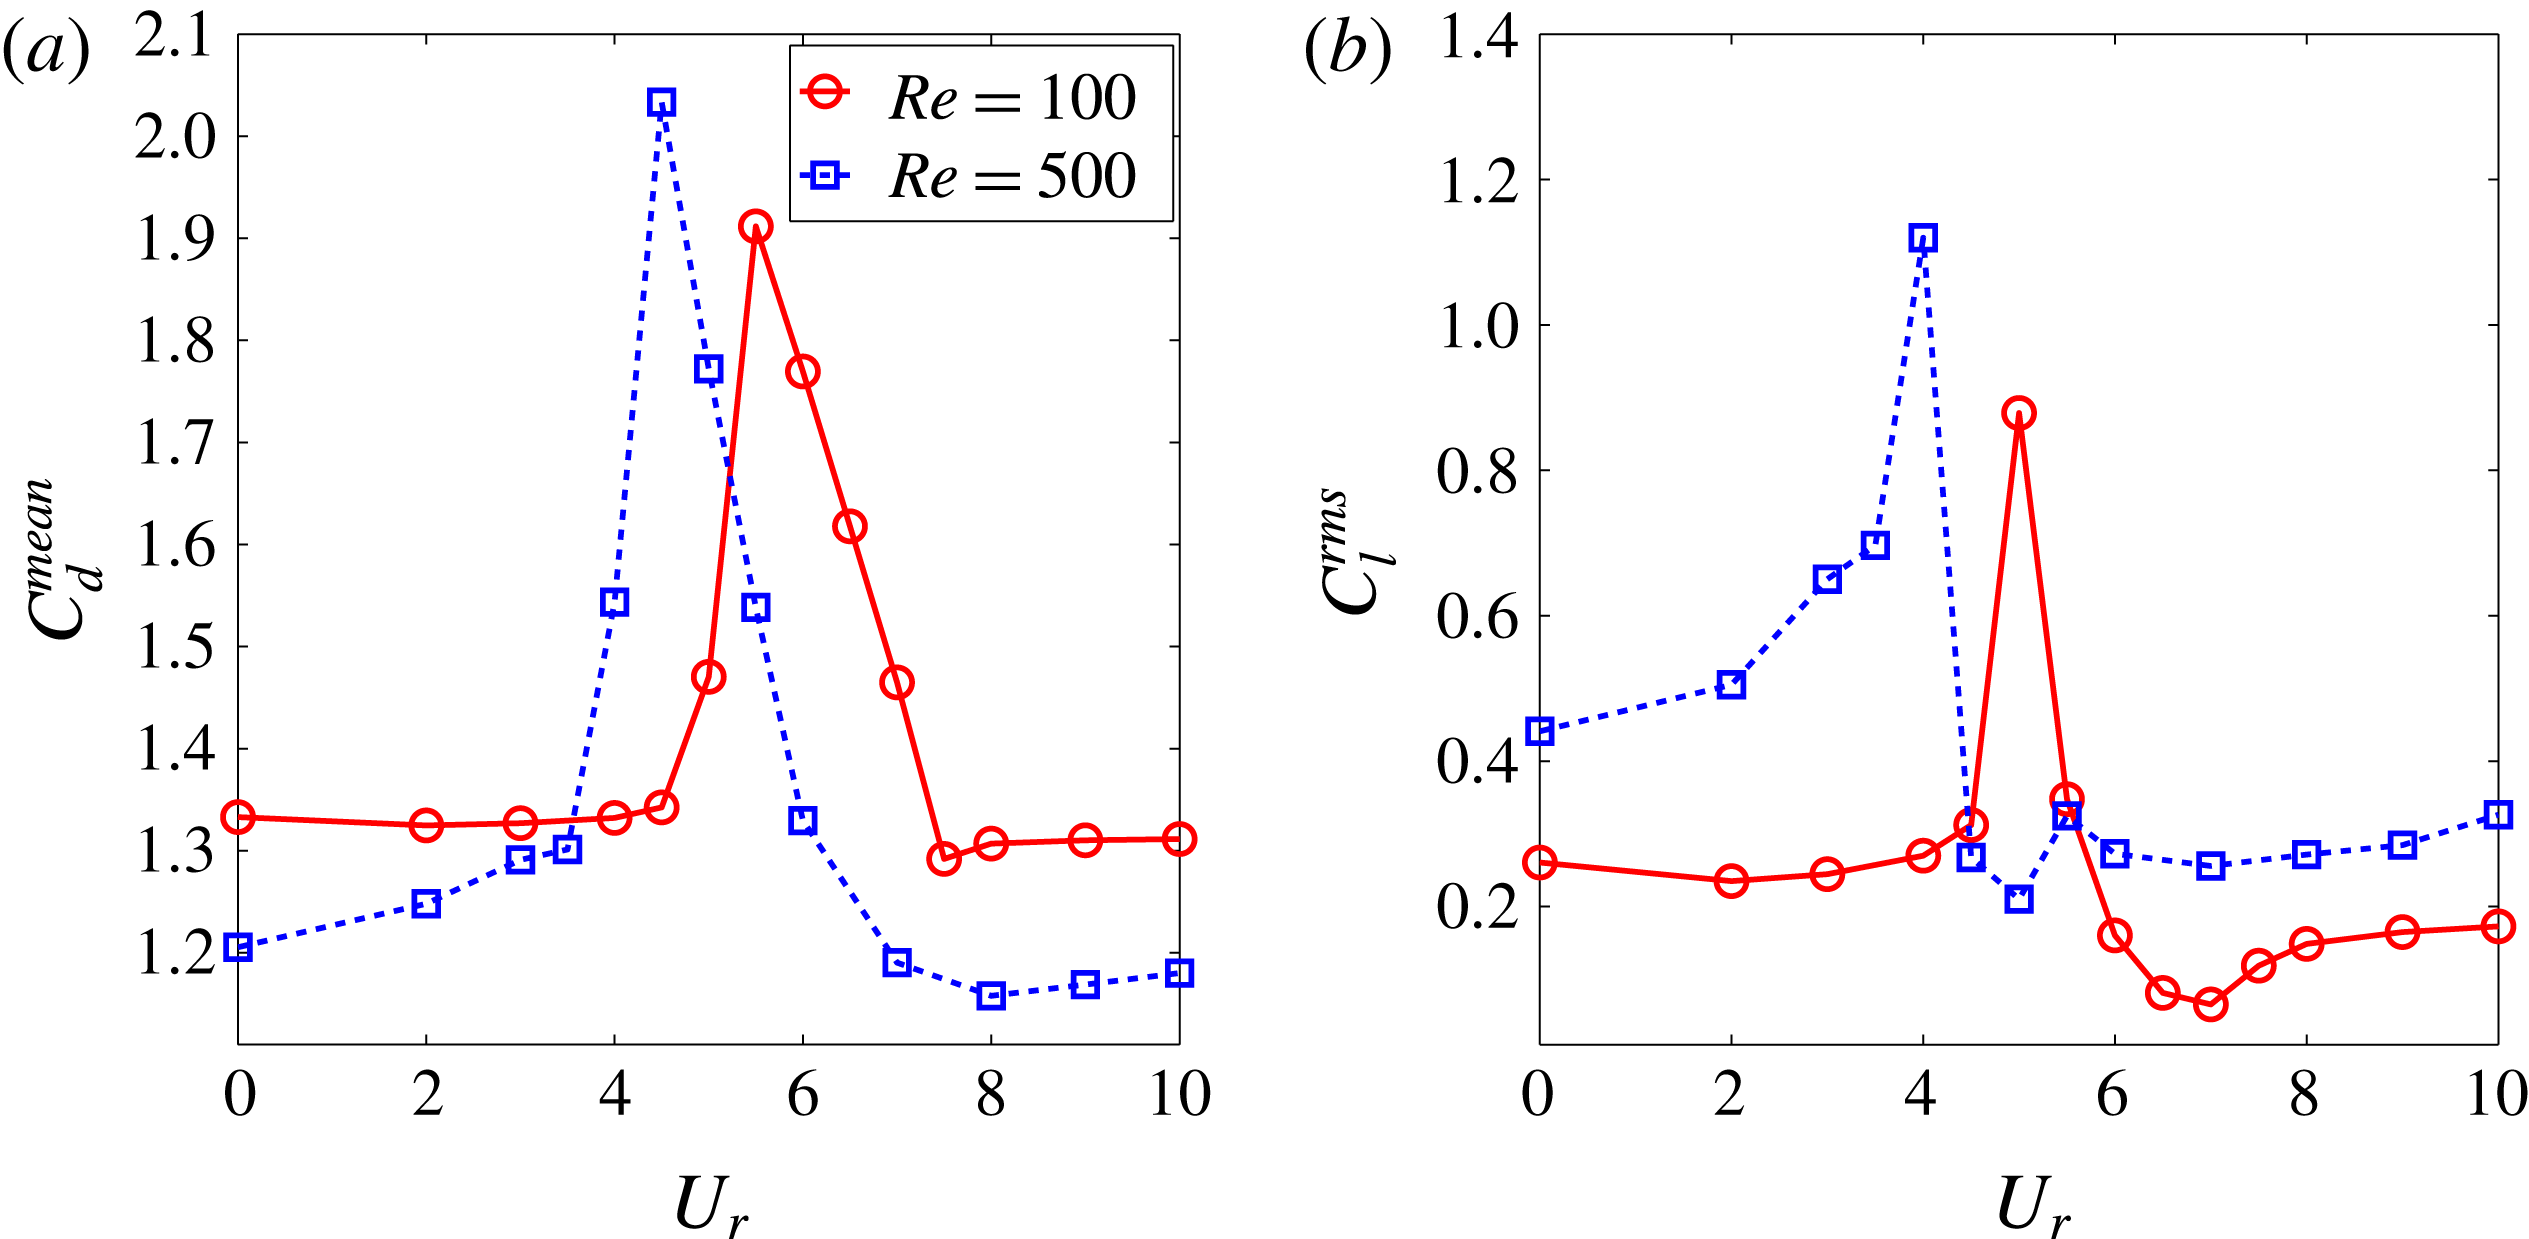
Hydrodynamic forces as a function of the reduced velocity for a transversely vibrating isolated cylinder at
 $m^{\ast }=10$
and
 $\unicode[STIX]{x1D701}=0.01$
: (a) the mean drag coefficient
 $C_{d}^{mean}$
with respect to the reduced velocity
 $U_{r}$
; (b) the root-mean-square (r.m.s.) lift coefficient
 $C_{l}^{rms}$
with respect to the reduced velocity
 $U_{r}$
.
To further assess the aforementioned behaviour, we consider a stationary isolated cylinder at a representative moderate Reynolds number,
 $Re=500$
. Figure 4 shows the
 $(x,y)$
-sectional snapshots at
 $l^{\ast }=5$
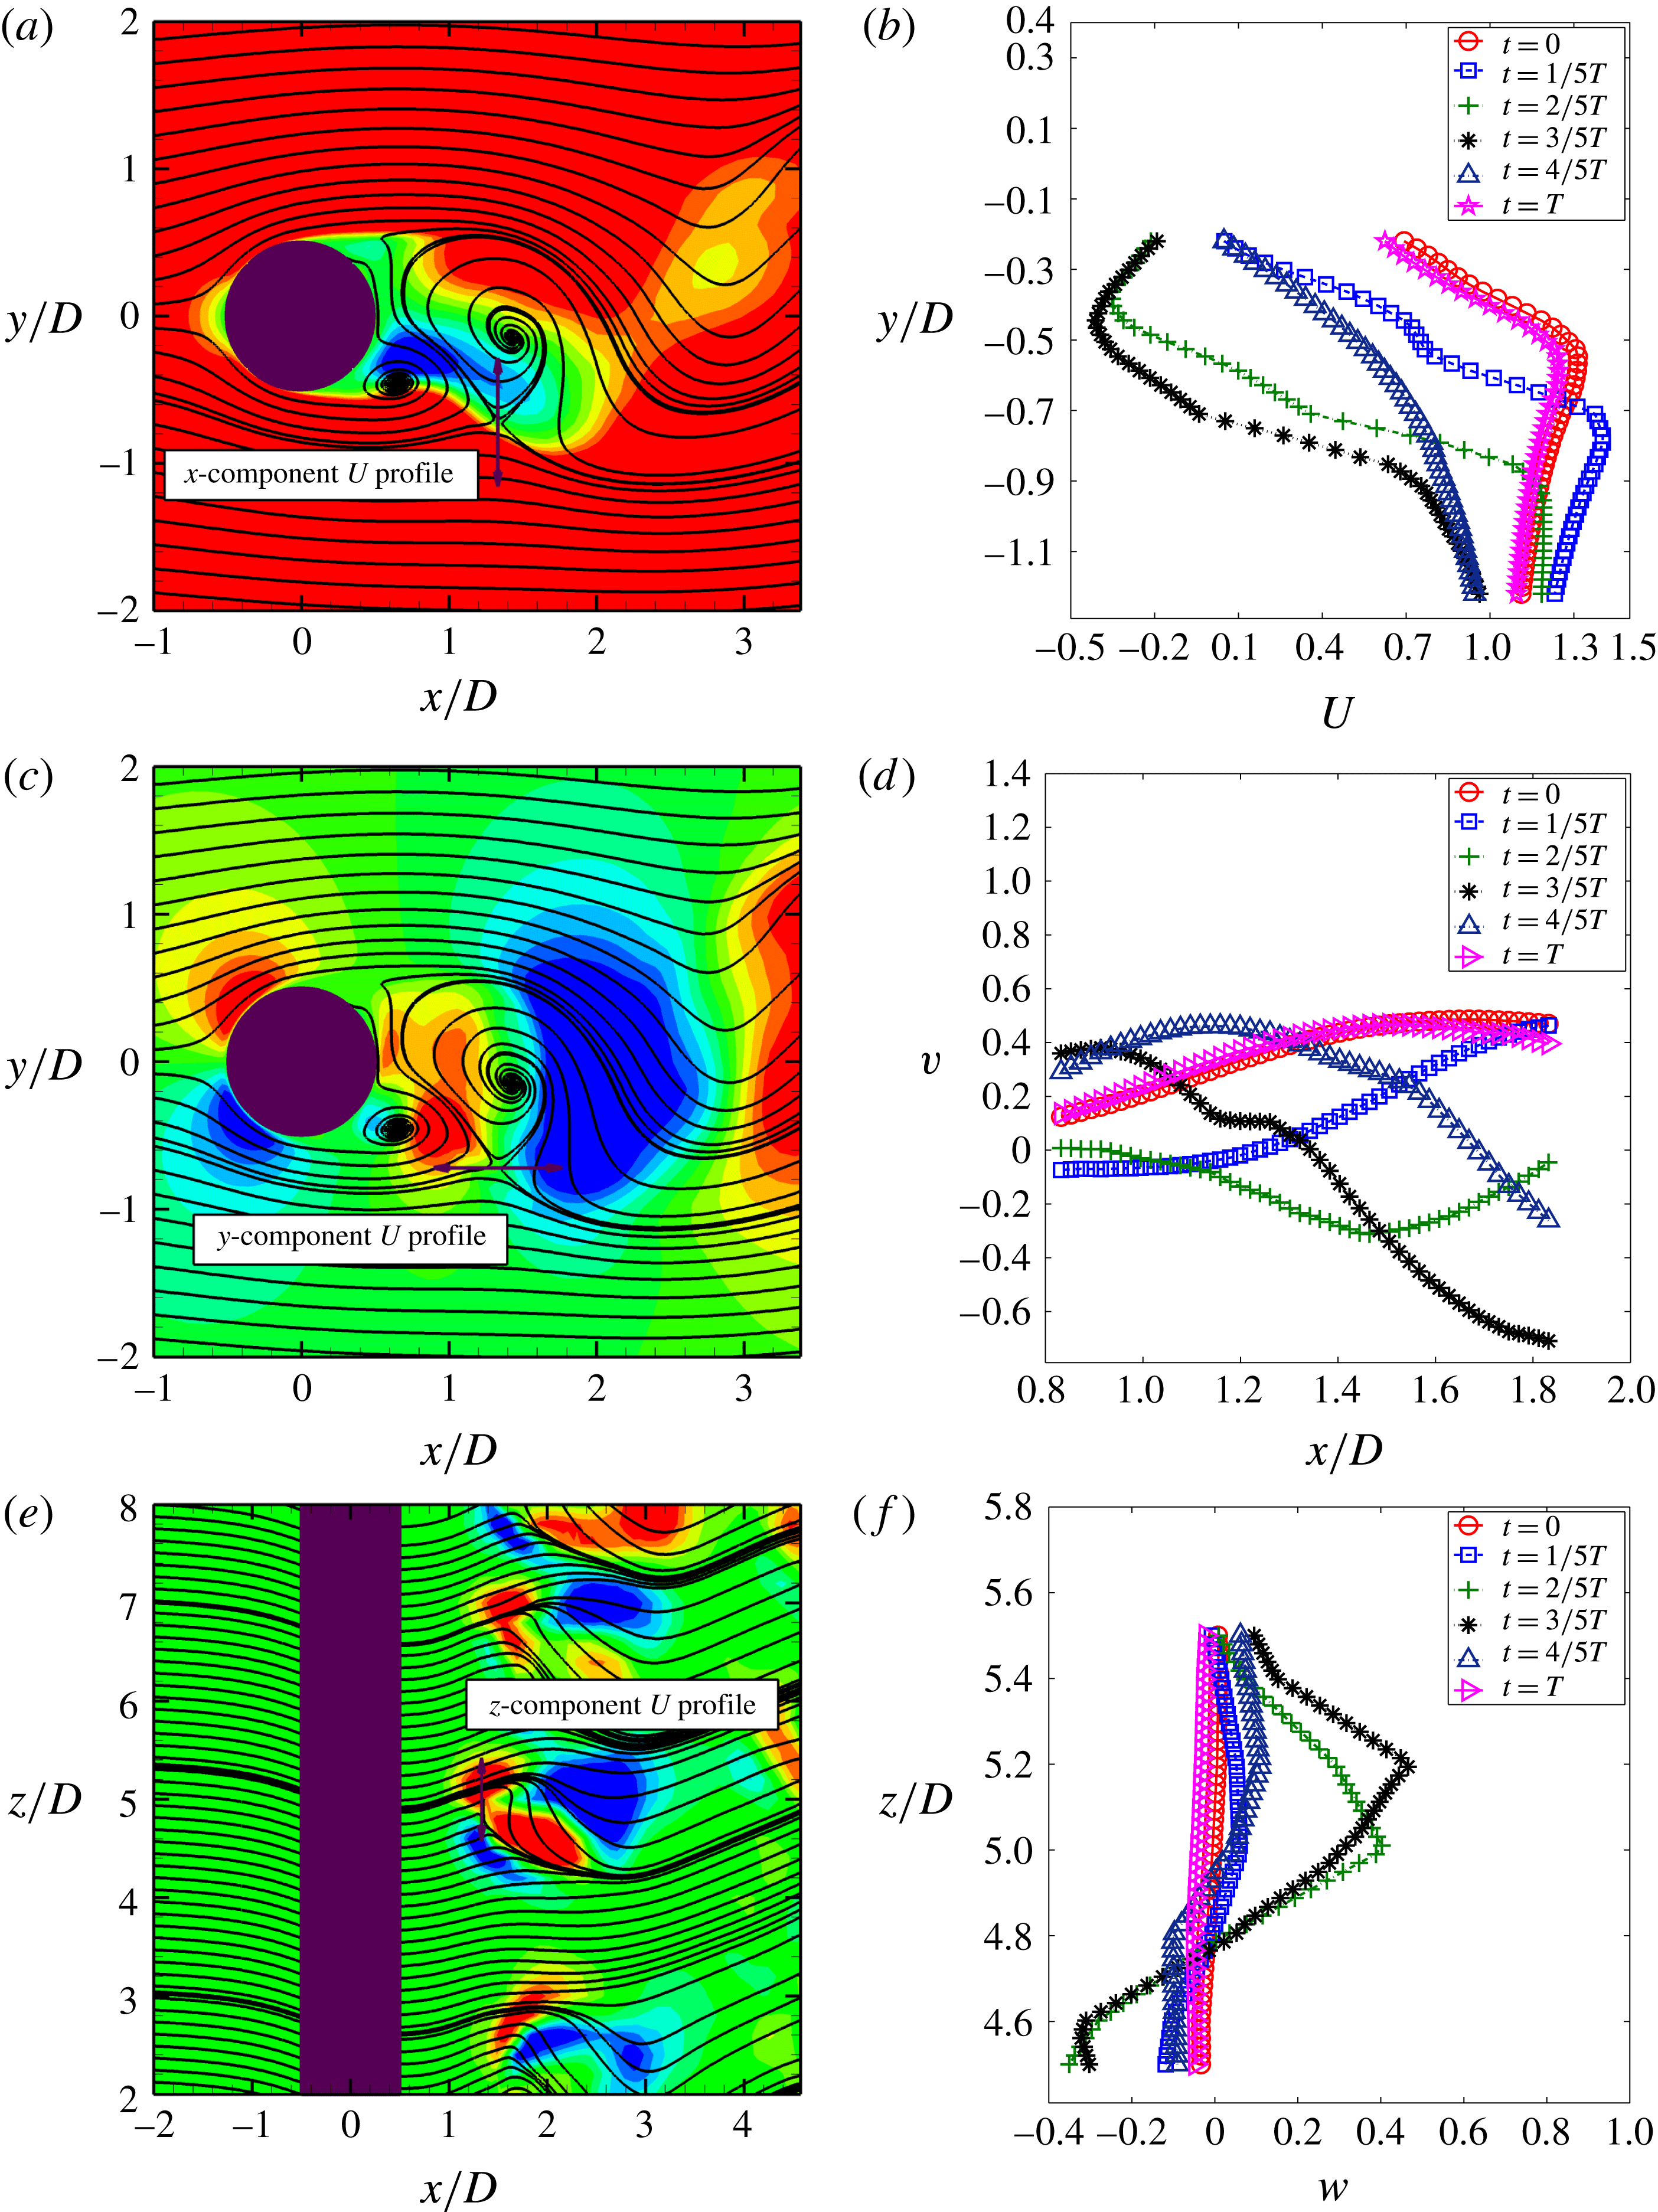
in the near-wake regions. The intense streamwise vortex rollers are formed along the interface of the counter-signed vortex separating layers and across the saddle-point regions. This observation conforms with the topological description of the turbulent flow pattern from Perry & Chong (Reference Perry and Chong1987). Based on the definition of streamline saddle point (SSP), appendix A shows that the inflection points in the velocity profiles are indeed in the saddle-point region. These inflection points are subsequently visualized in figures 5(a,b) and 5(c,d) at
 $t=3/5T$
when the SSP appears at the investigated location, (
 $1.33D$
,
 $-0.72D$
,
 $5D$
). In particular, a high streamwise vorticity concentration of the same sign appears on both sides of the saddle point along the
 $z$
-axis in figure 5(e), which is consistent with the observation of Zhou & Antonia (Reference Zhou and Antonia1994), whereby the streamwise vortical structures are inclined and crossed approximately at the saddle-point region in the
 $(x,y)$
-plane. Hence, the presence of the high-strain rates reflects the significance of the two-dimensional SSP to the three-dimensionality of this flow.
Following that, a stability analysis using the DMD technique is performed in a saddle-point region at low Reynolds number in appendix B. It is found that the near-wake instability around the saddle point is dependent on the intensity of the fluid momentum, Reynolds number effect and the interaction between the imbalanced vorticity clusters. Huang, Narasimhamurthy & Andersson (Reference Huang, Narasimhamurthy and Andersson2010) recently reported that a planar shear flow could enhance the three-dimensionality in the wake behind a circular cylinder. (Here a planar shear flow refers to an inflow with a constant velocity gradient along the
 $y$
-axis.) It supports the discussion about the significance of the interaction between the imbalanced vorticity clusters in appendix B.
In the present investigation, we further analyse the relationship between the near-wake instability and the resultant imbalanced vortex-to-vortex interaction from the planar shear flow. The fluid shearing is known to be critical to the Kelvin–Helmholtz instability. Since significant shear stresses are observed on the interface of the imbalanced counter-signed vorticity clusters, the interaction between different vorticity clusters is believed to be crucial to the near-wake instability. The critical points, e.g. streamline saddle point, can be observed in both 2-D and 3-D flows. To simplify our discussion, the fluid stability around a saddle-point region for the 2-D laminar flow is included as a supportive example. While
 $Re\lesssim 48$
, the symmetric counter-signed circulations are interacting and no instability is observed behind a stationary isolated circular cylinder. It is when the perturbation approaches the brink of a critical value, the perturbation becomes non-negligible and induces the need for the extra dimension to quantify itself e.g. the introduction of a new dimension via a Hopf bifurcation and the flow transition from the laminar flow to the turbulent flow. These two factors associated with the near-wake instability facilitate the understanding of the proximity interference induced from the gap-flow behaviour in a three-dimensional flow in § 4.
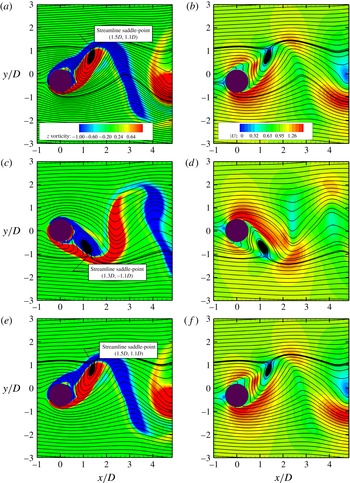
To link the observations on the saddle-point regions to the recovery of two-dimensional hydrodynamic responses, a series of streamline-contour plots of the locked-in cylinder are investigated for a single primary vortex-shedding cycle in figure 6. Based on the discussion on the streamline saddle point in appendix A, the saddle point generates a local stagnant region which inhibits the transfer of kinetic energy from the mean flow. The saddle point moves with the kinematics of the separating shear layer along the interface and represents a communication barrier. As the vortex wake reaches its maximum growth, it eventually breaks up and sheds downstream. A strict periodic motion at the peak lock-in generates well-segregated vortex wakes downstream which have relatively benign interactions from the vortex wakes. (The focus is to investigate the influence of a saddle-point region on the vortex-shedding process. Hence the vortex shedding modes are not discussed here.) This vortex-shedding mode inhibits the formation of the fluid shearing along the interface of the vortex wakes. A direct consequence is the recovery of the 2-D hydrodynamic response along the cylinder.
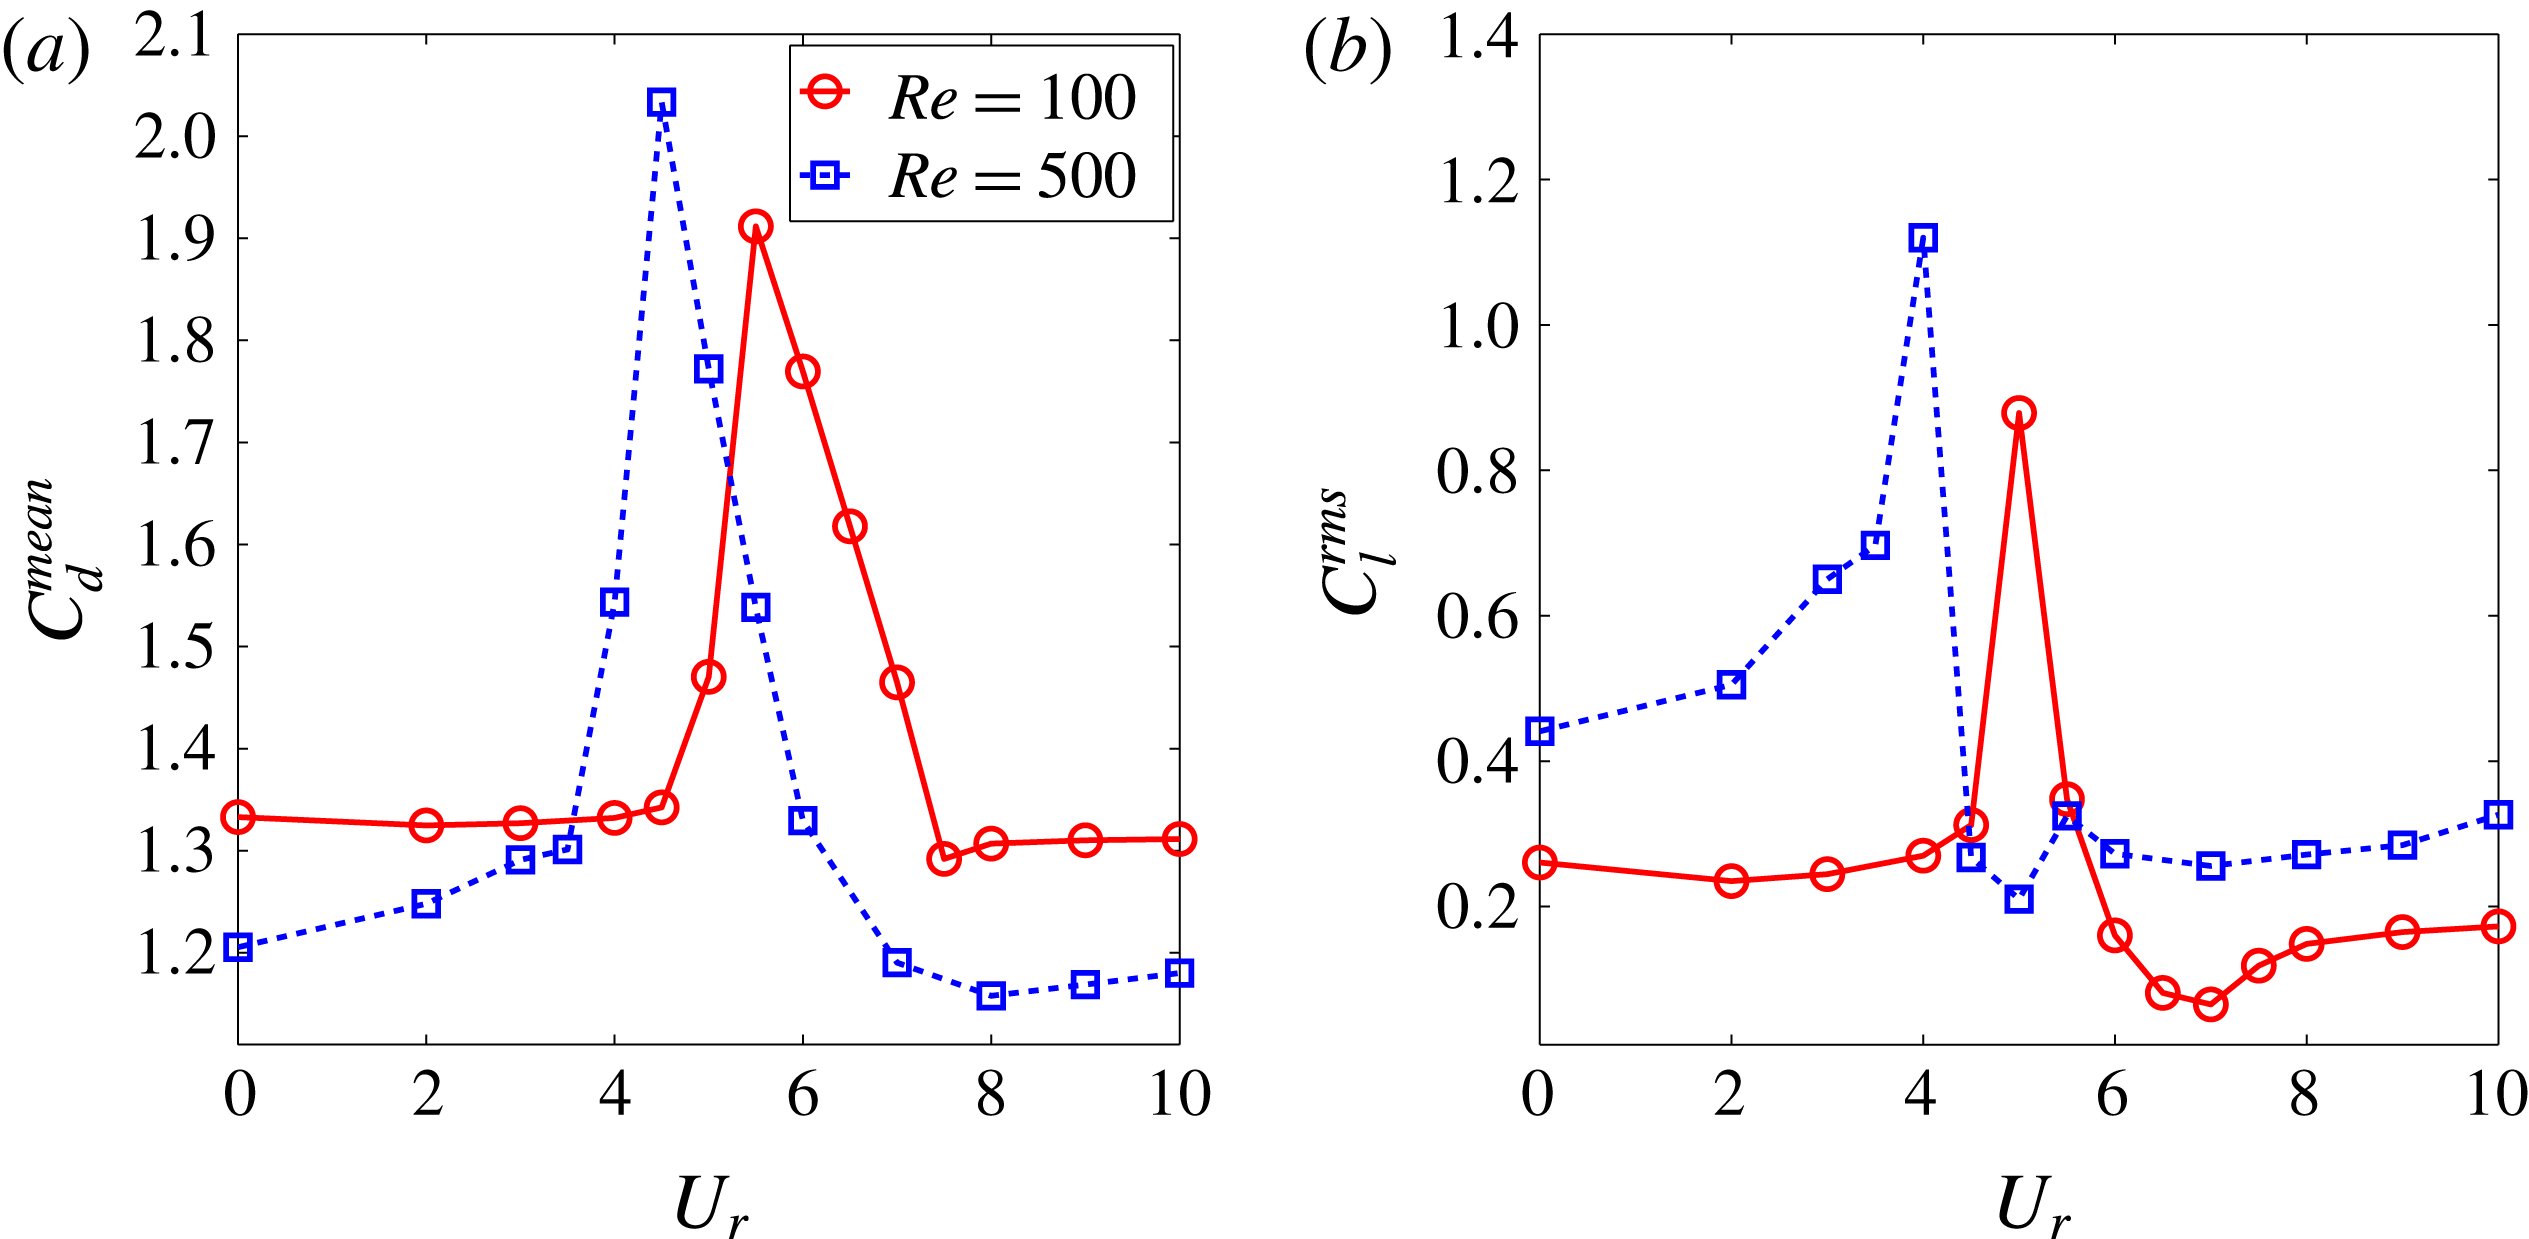
A turbulent wake flow at the off lock-in results in a smaller
 $C_{d}^{mean}$
value than its laminar flow counterpart in figure 7, where
 $C_{d}^{mean}$
is over-predicted by relatively large two-dimensional vortex wakes at the lock-in. Overall, the response of
 $C_{l}$
shows an increment in the transverse fluctuating lift force and an earlier onset of the VIV lock-in. As reported by Liu & Jaiman (Reference Liu and Jaiman2016) for similar problem set-ups with two-dimensional laminar flow, the earlier onset of VIV than its corresponding case without proximity interference is attributed to the enhanced vortex interaction which leads to a higher vortex shedding frequency. At the peak lock-in, both
 $C_{d}$
and
 $C_{l}$
at
 $Re=500$
show respectively an approximately 6 % and 22 % amplification compared to their laminar counterparts from Liu & Jaiman (Reference Liu and Jaiman2016). In contrast to the streamwise effect, these results indicate that the VIV regulation effect has a profound influence on the transverse response. A similar phenomenon was observed by Zhao et al. (Reference Zhao, Cheng, An and Lu2014), in which the spanwise correlations were discussed at the VIV lock-in and uniformity of
 $C_{l}$
was observed along the span of a vibrating cylinder. Here, the primary focus is to understand the complex near-wake flow physics in the SBS arrangements.
4 Three-dimensional gap-flow interference
In this section, the relationship between the gap-flow-induced proximity interference and the near-wake instability is discussed for the cylinders with SBS arrangements. An incorporation of the interference from the VIV kinematics is important to analyse practical applications and operations in side-by-side systems. So far the three-dimensional numerical investigation of the gap flow instability in the SBS arrangements has rarely been documented. Hence, the present investigation on the VSBS arrangements in a 3-D flow is deemed as another step further to understanding the gap flow and the VIV kinematics. From a systematic analysis viewpoint, it is desirable to first focus merely on the interaction between the gap-flow kinematics and the 3-D flow by eliminating the motion of the structure.
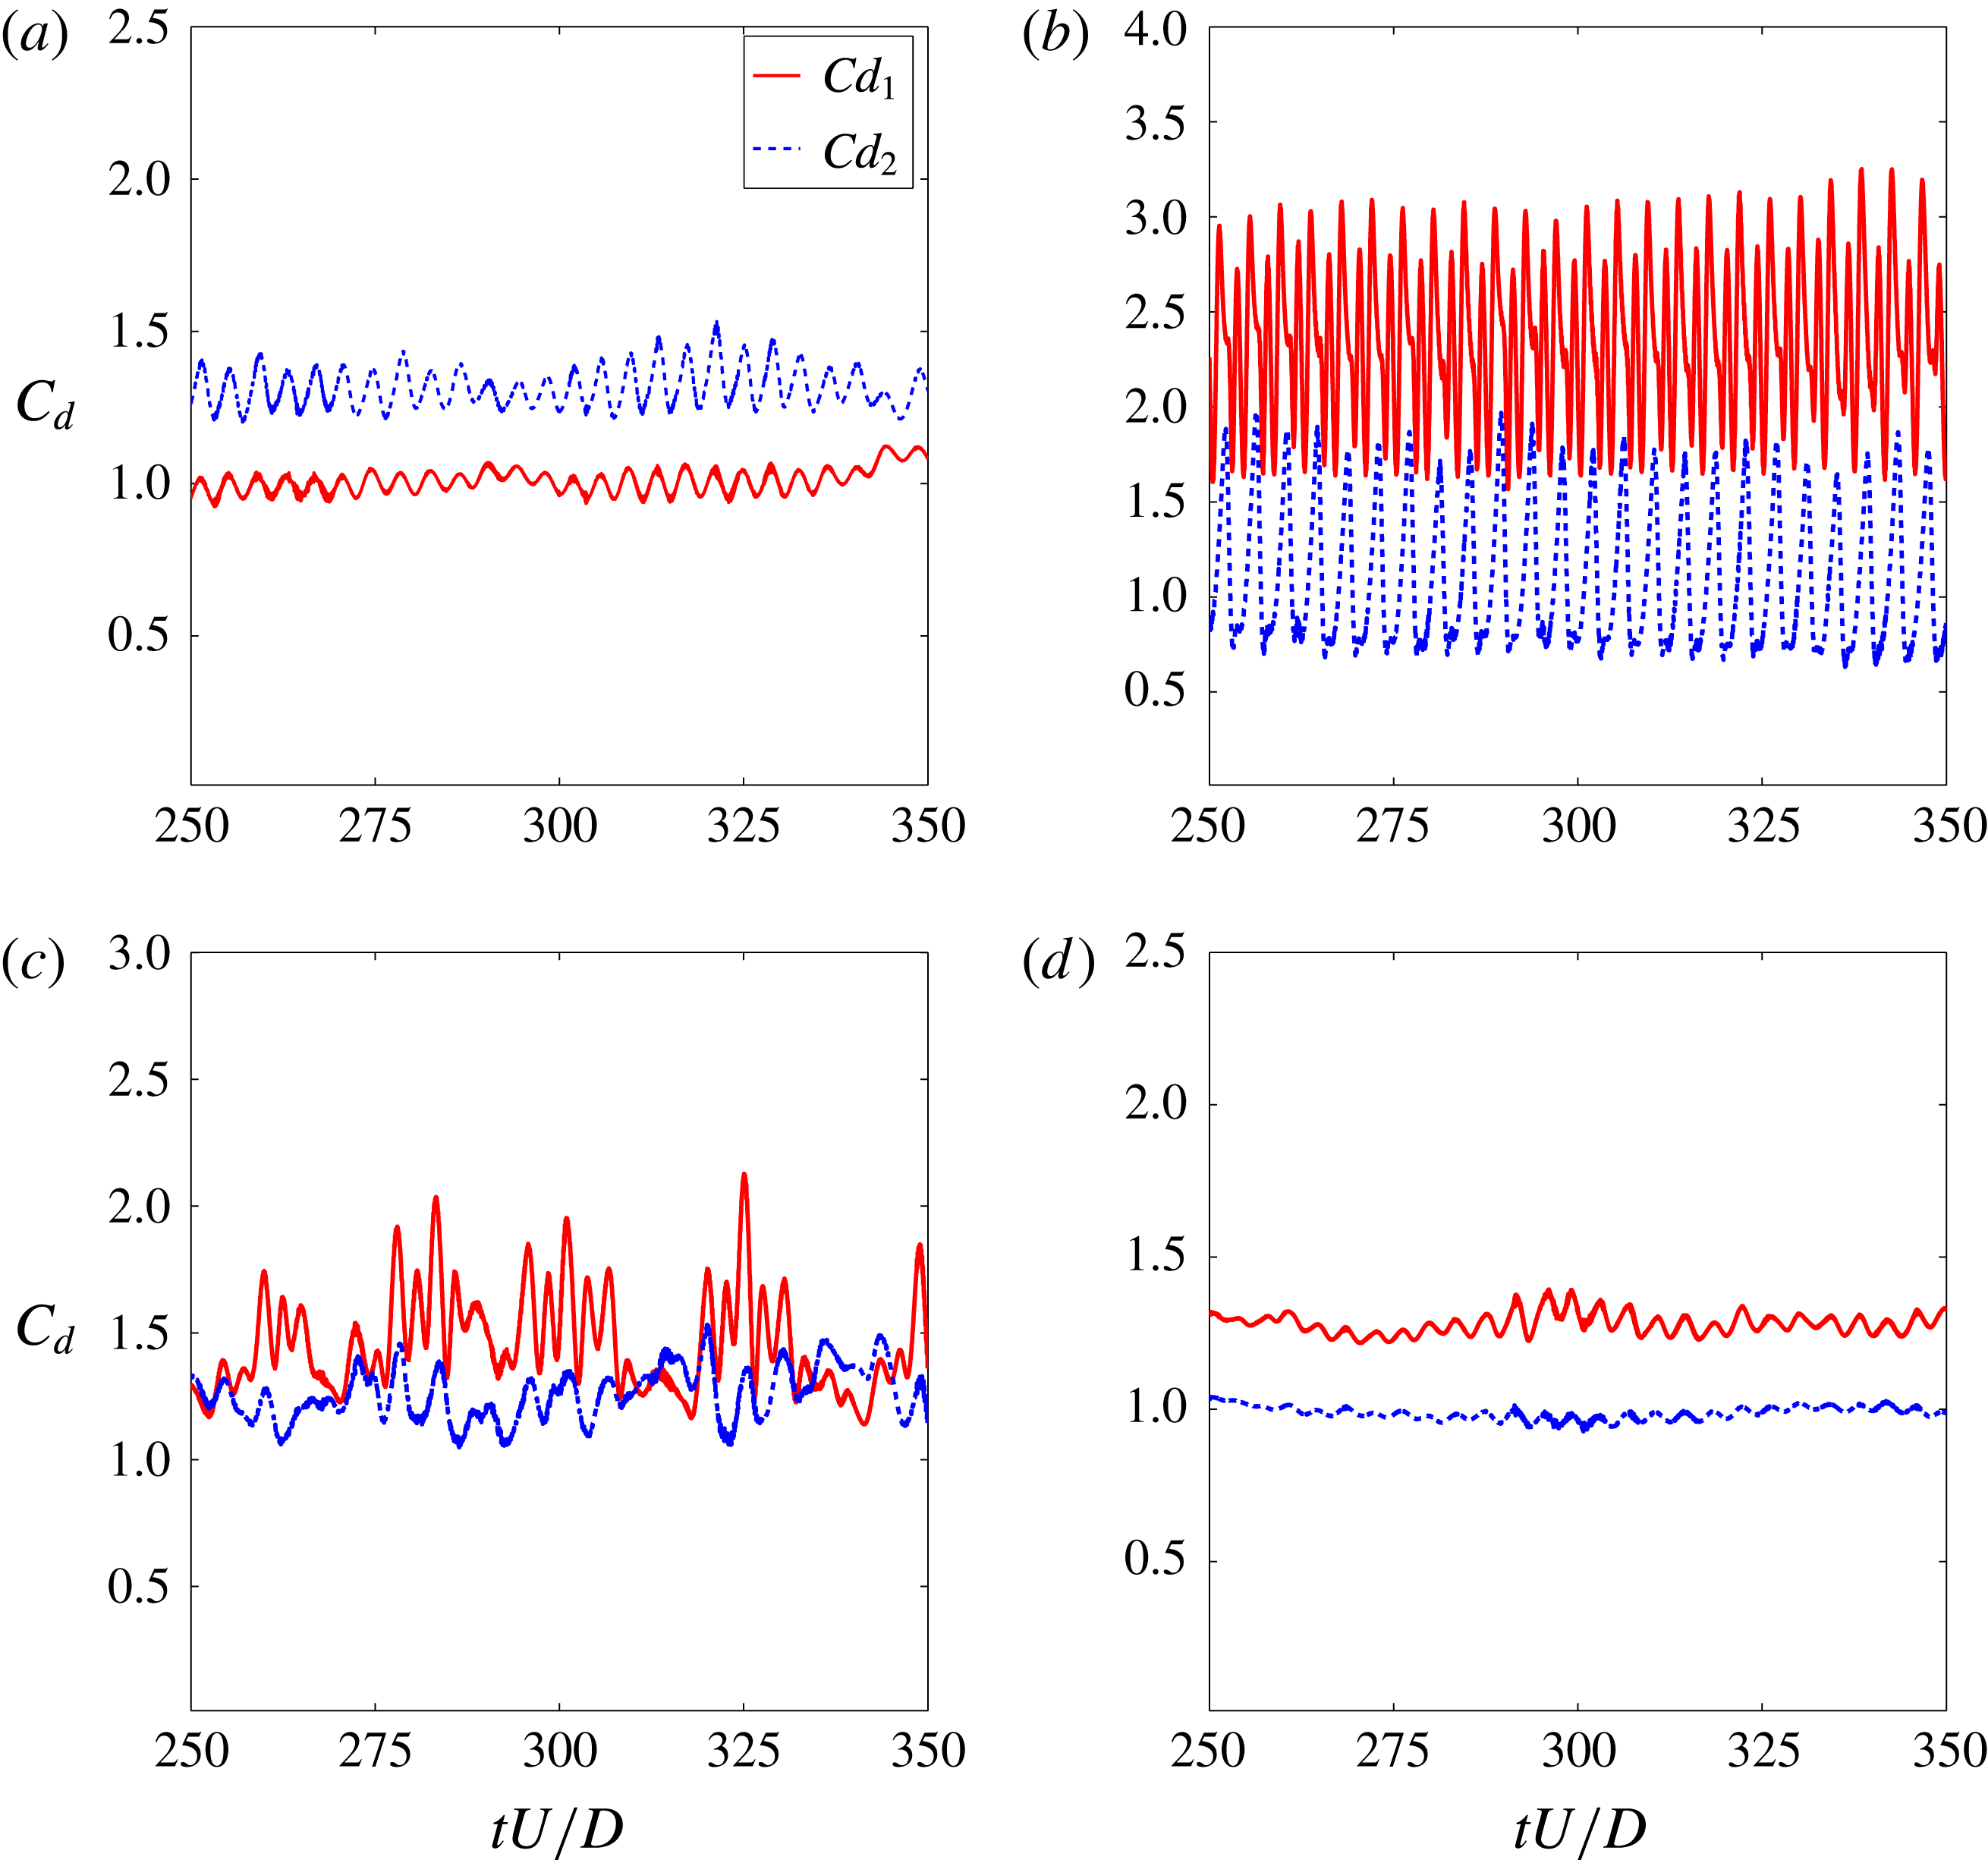
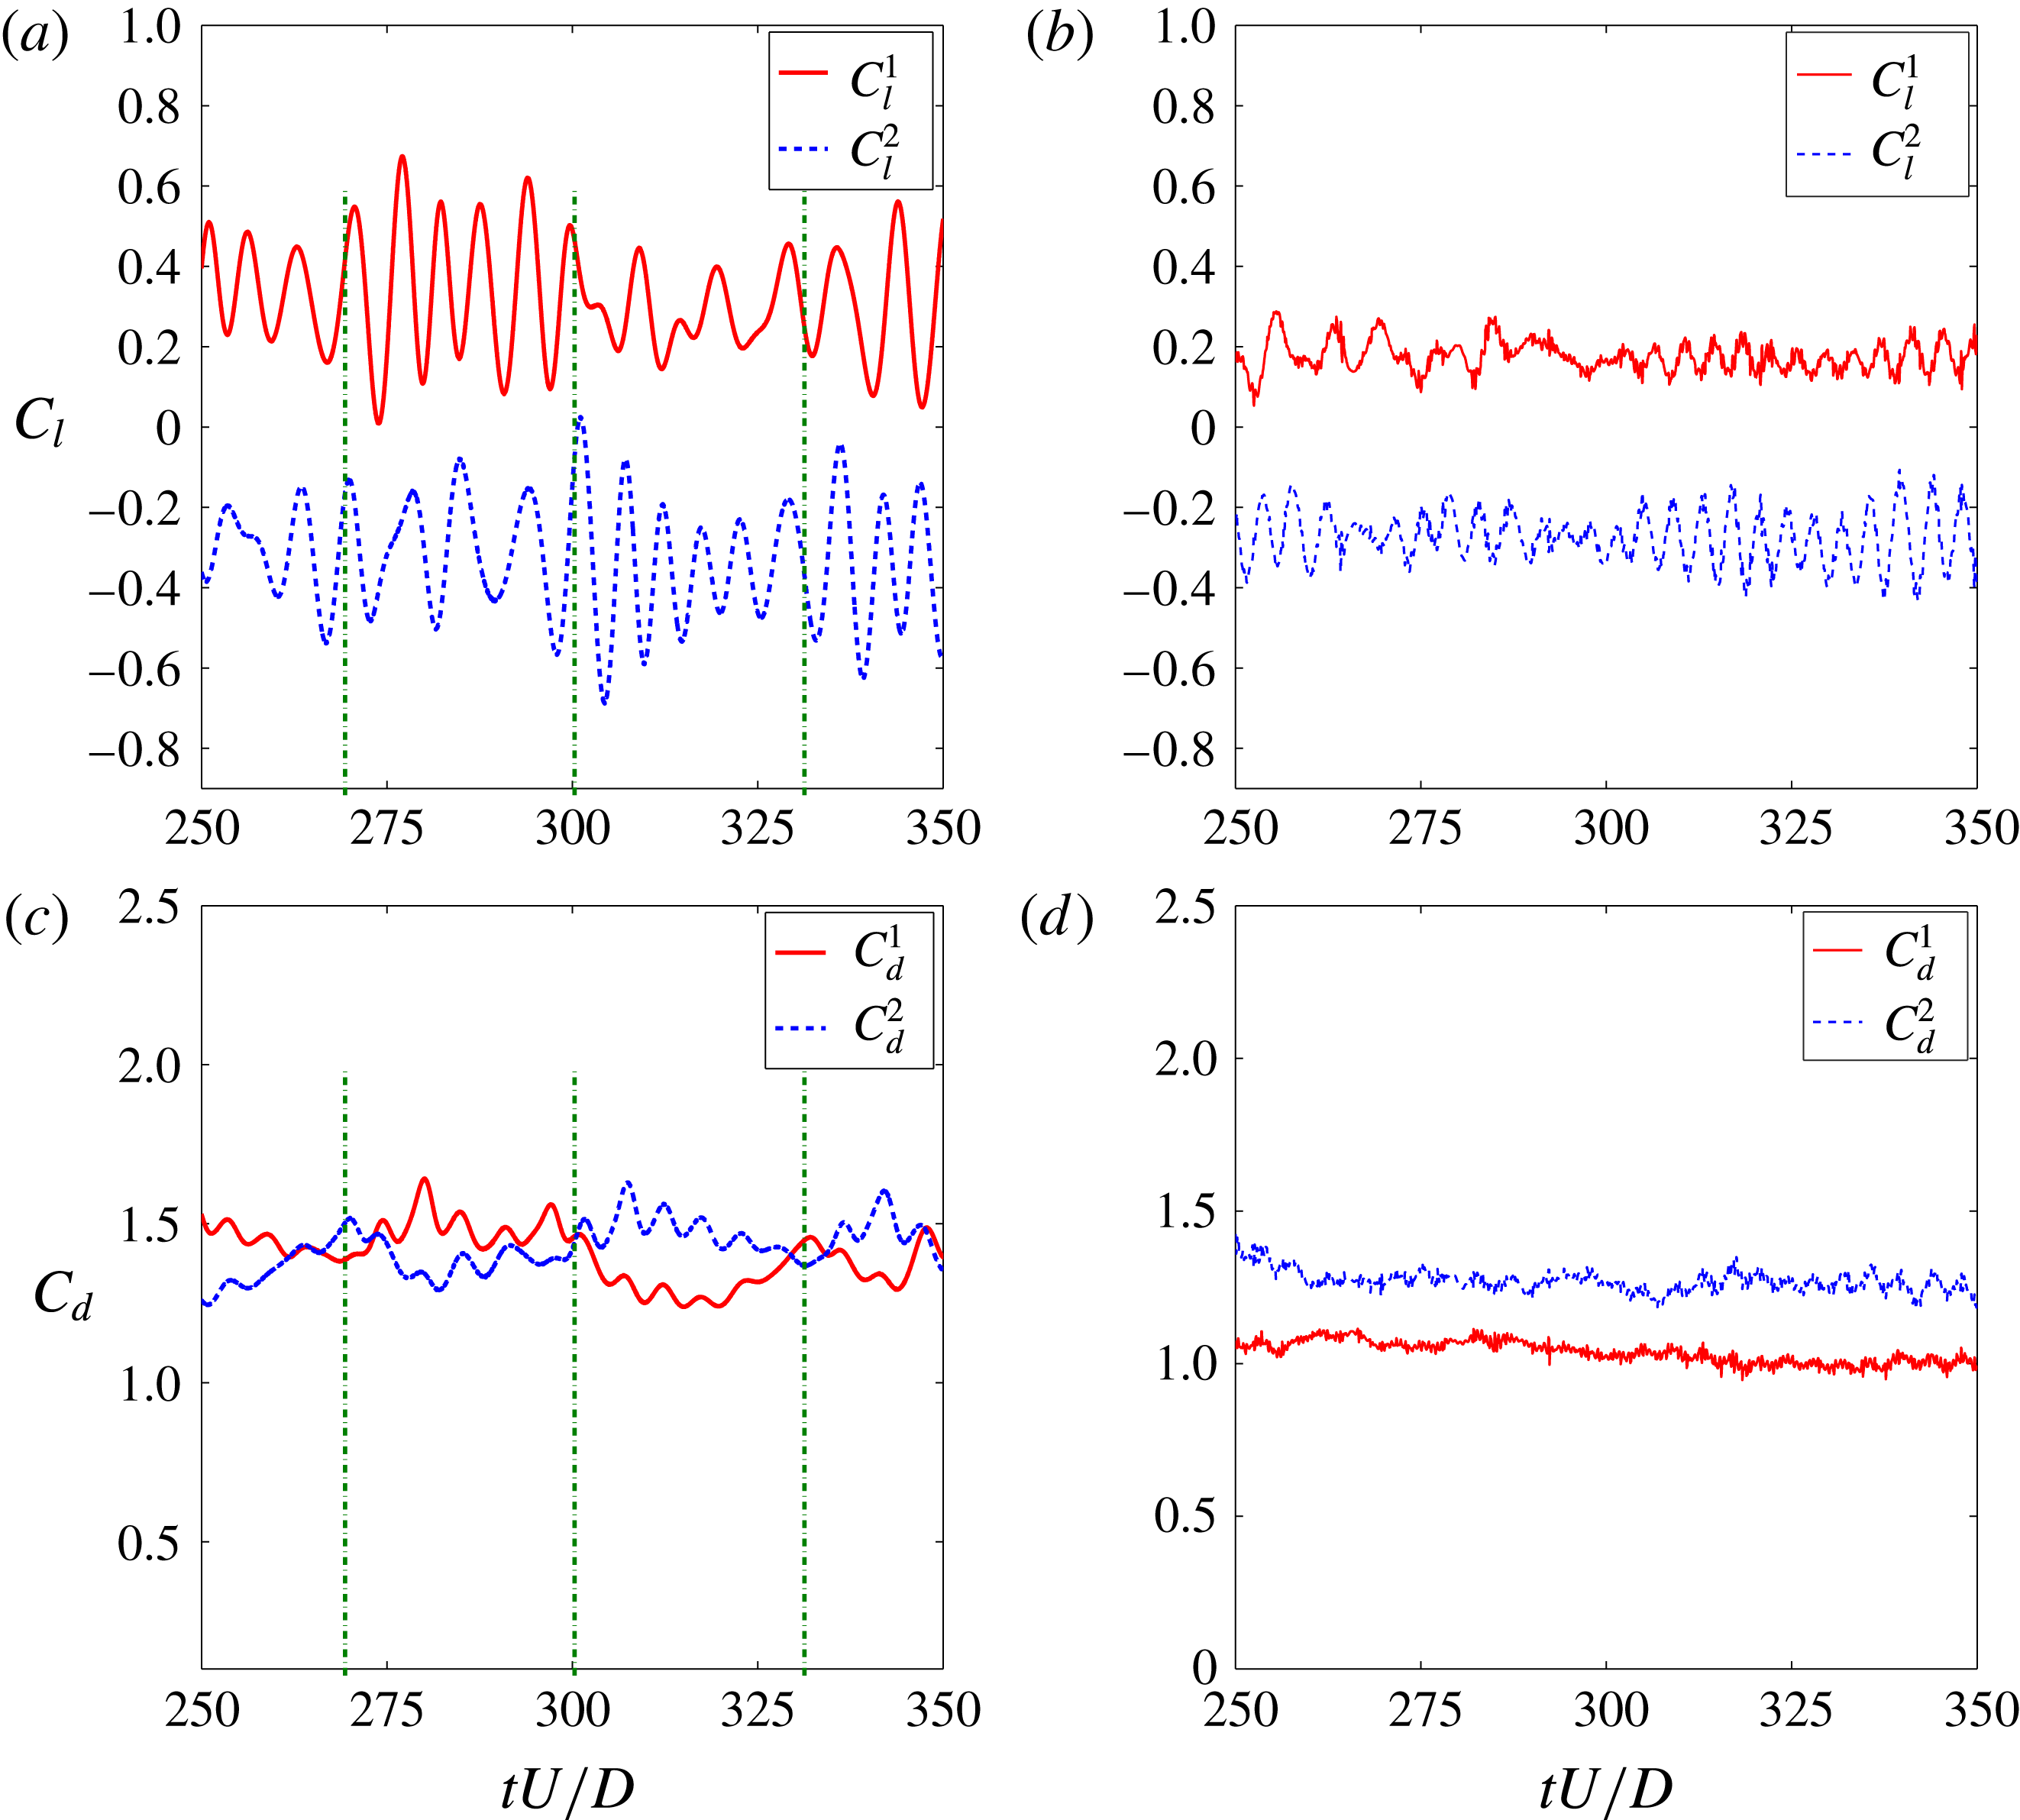
Time traces of hydrodynamic forces for SSBS arrangement at
 $g^{\ast }=0.8$
: (a,c)
 $Re=100$
, the flip-flopping is marked at
 $tU/D=270$
, 300 and 330; (b,d)
 $Re=500$
.
The flip-flopping pattern is frequently described as an intermittent deflection of the gap flow. As reported by Liu & Jaiman (Reference Liu and Jaiman2016), the switchover of
 $C_{d}^{mean}$
from each cylinder in the SSBS arrangement could indicate the direction of gap-flow deflection. Since the vortex-to-vortex interaction is enhanced in the narrow near-wake region, the corresponding frequency
 $f_{vs}$
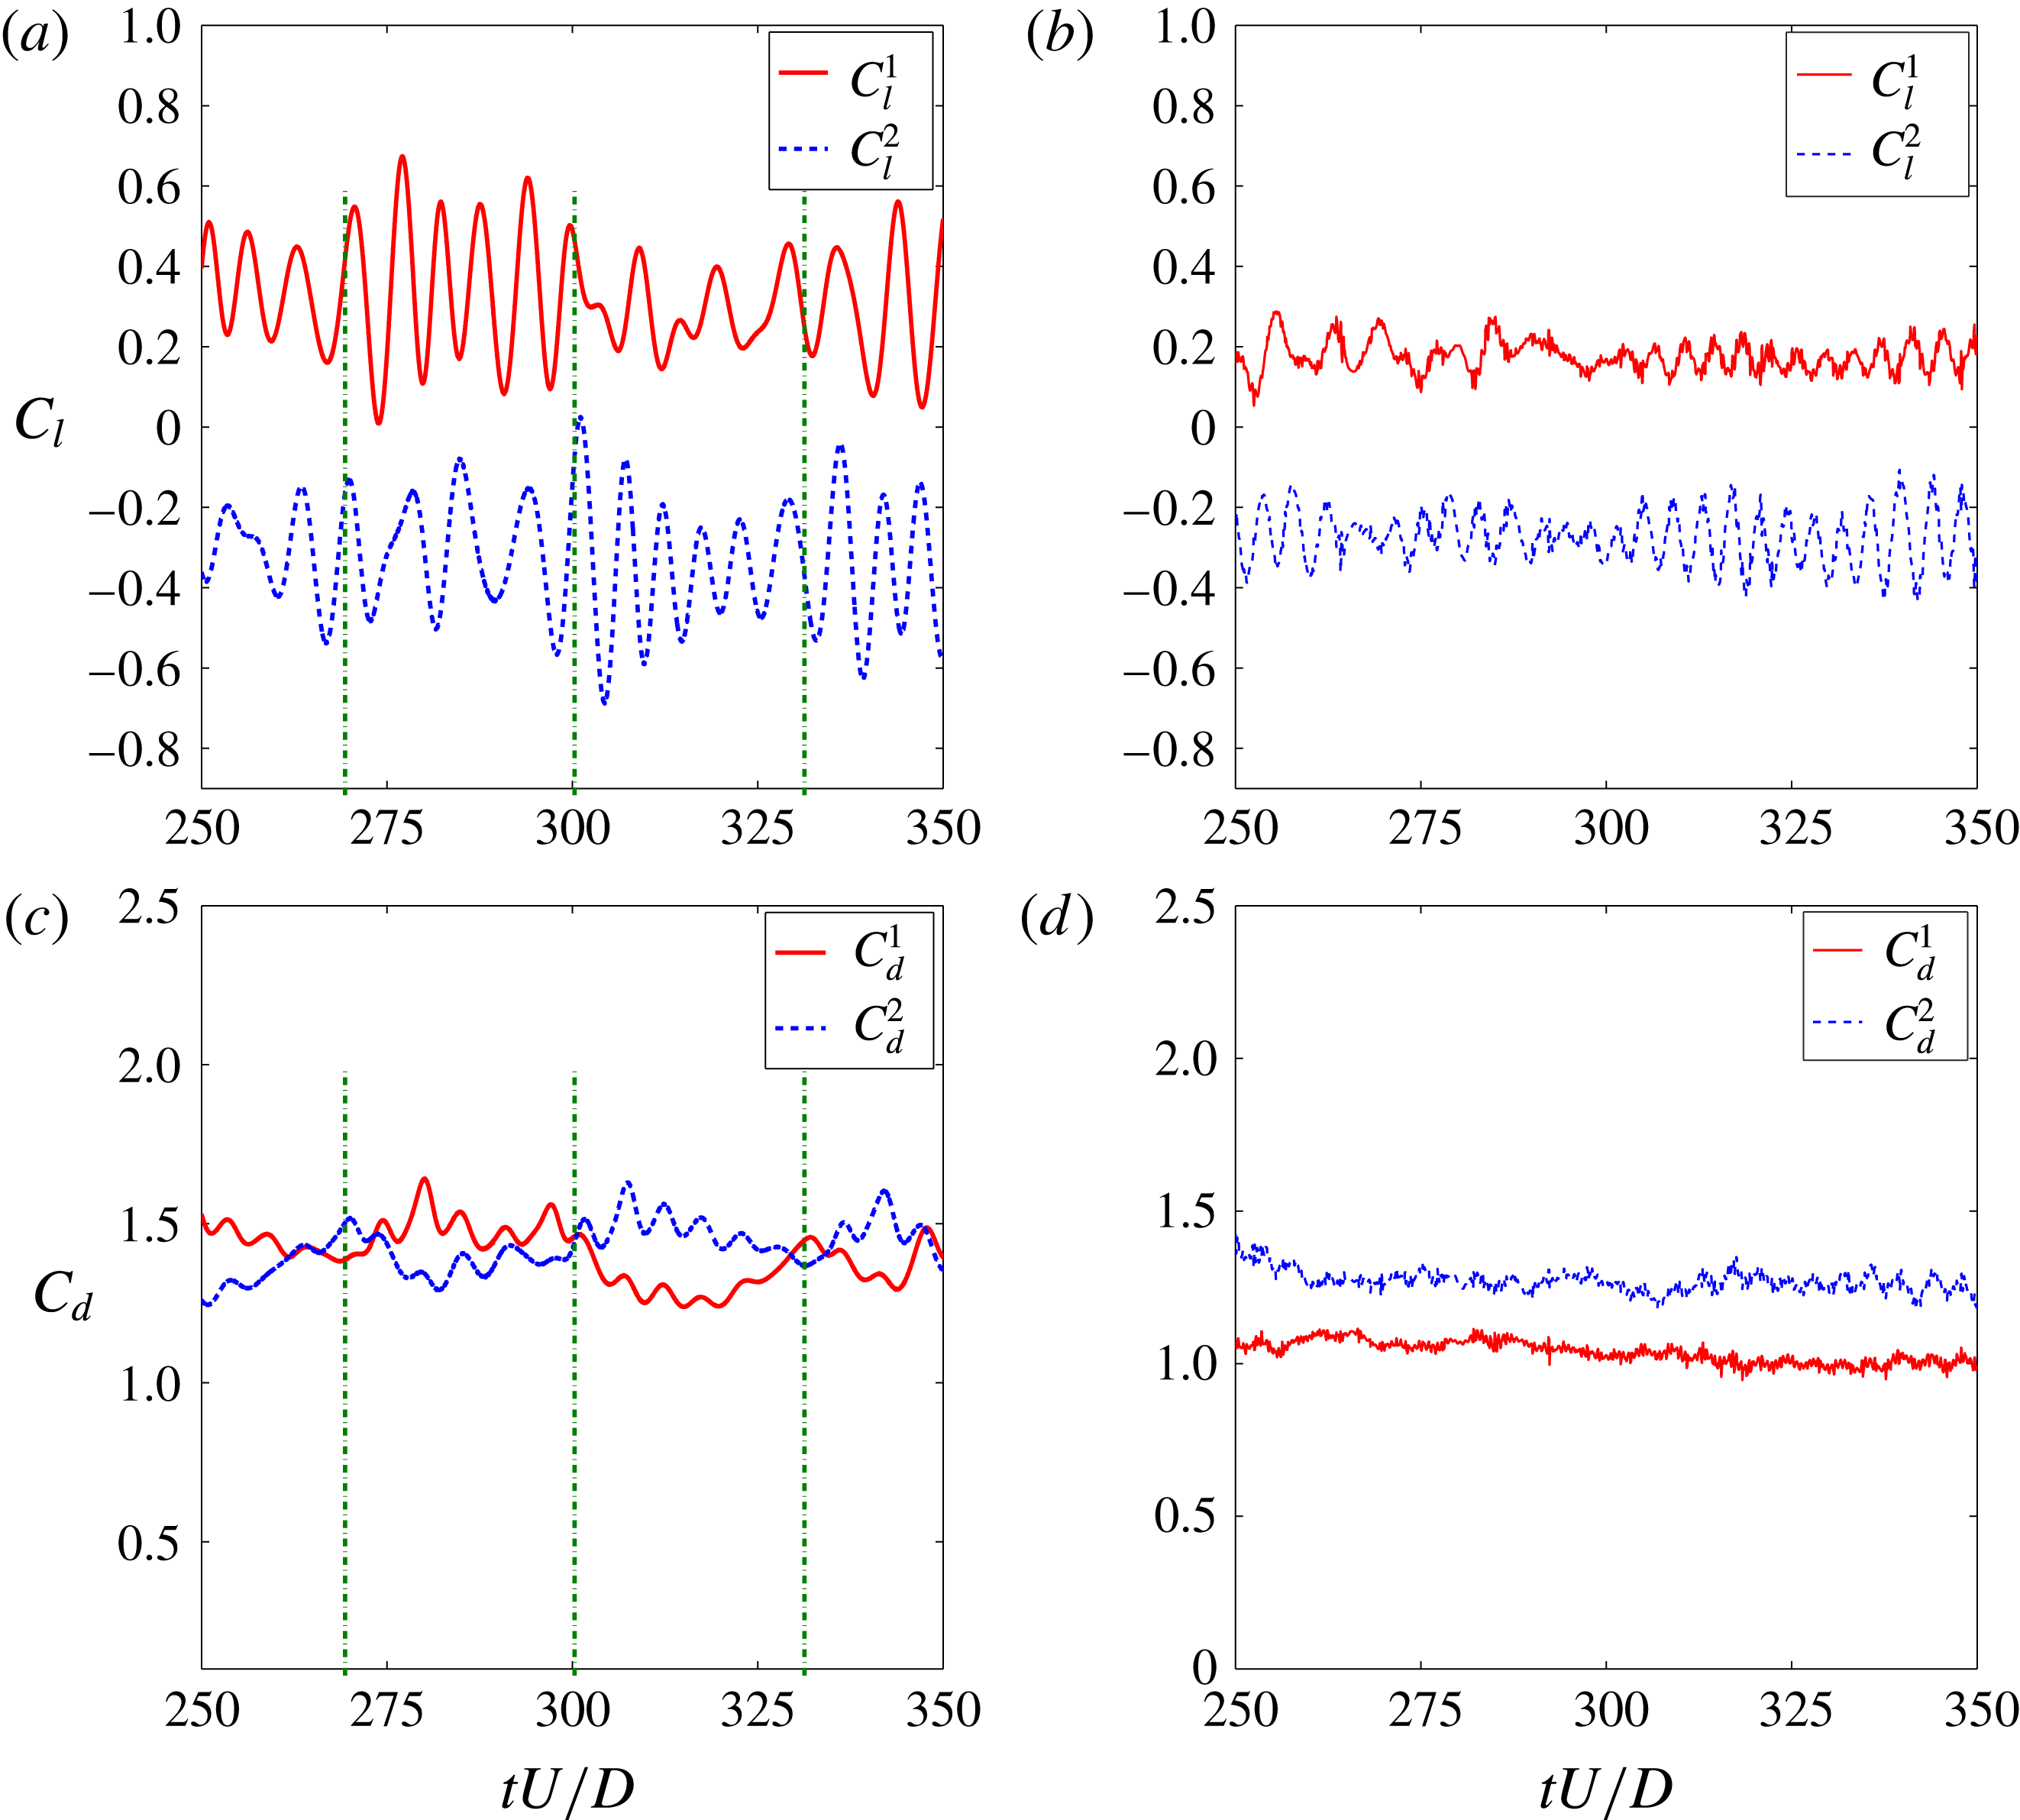
value is higher than its wide near-wake region counterpart. To investigate the characteristics related to the gap-flow features without and with the presence of 3-D effects, figure 8 is plotted. In the two-dimensional laminar flow, figure 8(a,c),
 $f_{vs}$
of the cylinder with the narrow near-wake region is observed to possess a larger value. However, this tendency is not confirmed in its three-dimensional counterpart, as shown in figure 8(b,d). The figures show that there is no significant difference among the mean vortex-shedding frequencies of the two cylinders for the 3-D flow, although the gap flow deflects. In addition, the flip-flop is not observed in the selected time window
 $tU/D\in [250,350]$
in figure 8(d), since
 $f_{flip}$
is remarkably low for the 3-D flow.
Instantaneous vortical structures using the
 $Q$
-criterion at
 $Re=500$
,
 $tU/D=300$
,
 $Q=0.2$
and
 $\unicode[STIX]{x1D714}_{y}=\pm 1$
(contours): (a) stationary cylinder; (b) SSBS arrangement at
 $g^{\ast }=0.8$
. The streamwise vorticity concentration is higher in the narrow near-wake region.

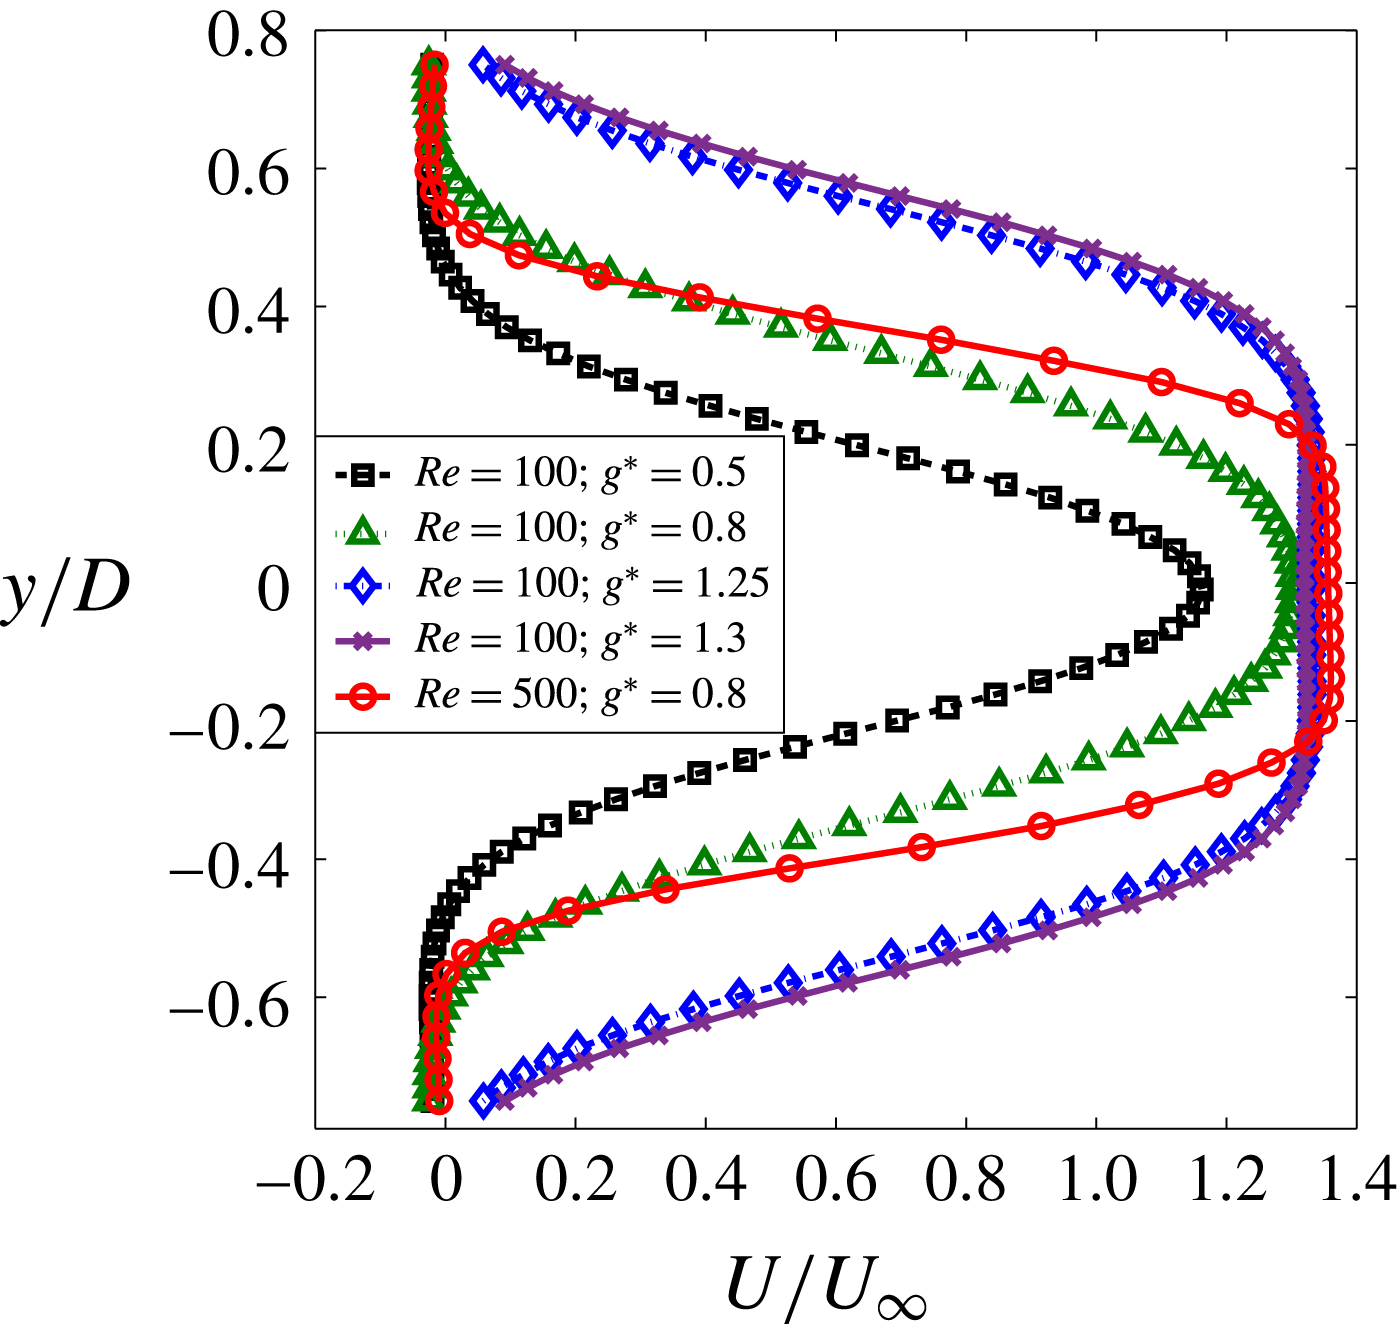
Horizontal velocity profiles of gap flow for SSBS arrangements at
 $Re=100$
and
 $Re=500$
. Velocity profiles are extracted at the gap-flow location (
 $0.6D$
,
 $0.7D$
to
 $-0.7D$
) where (
 $0D$
,
 $0D$
) is the centre between the cylinders. The time averaging is performed from
 $tU/D\in [250,350]$
.

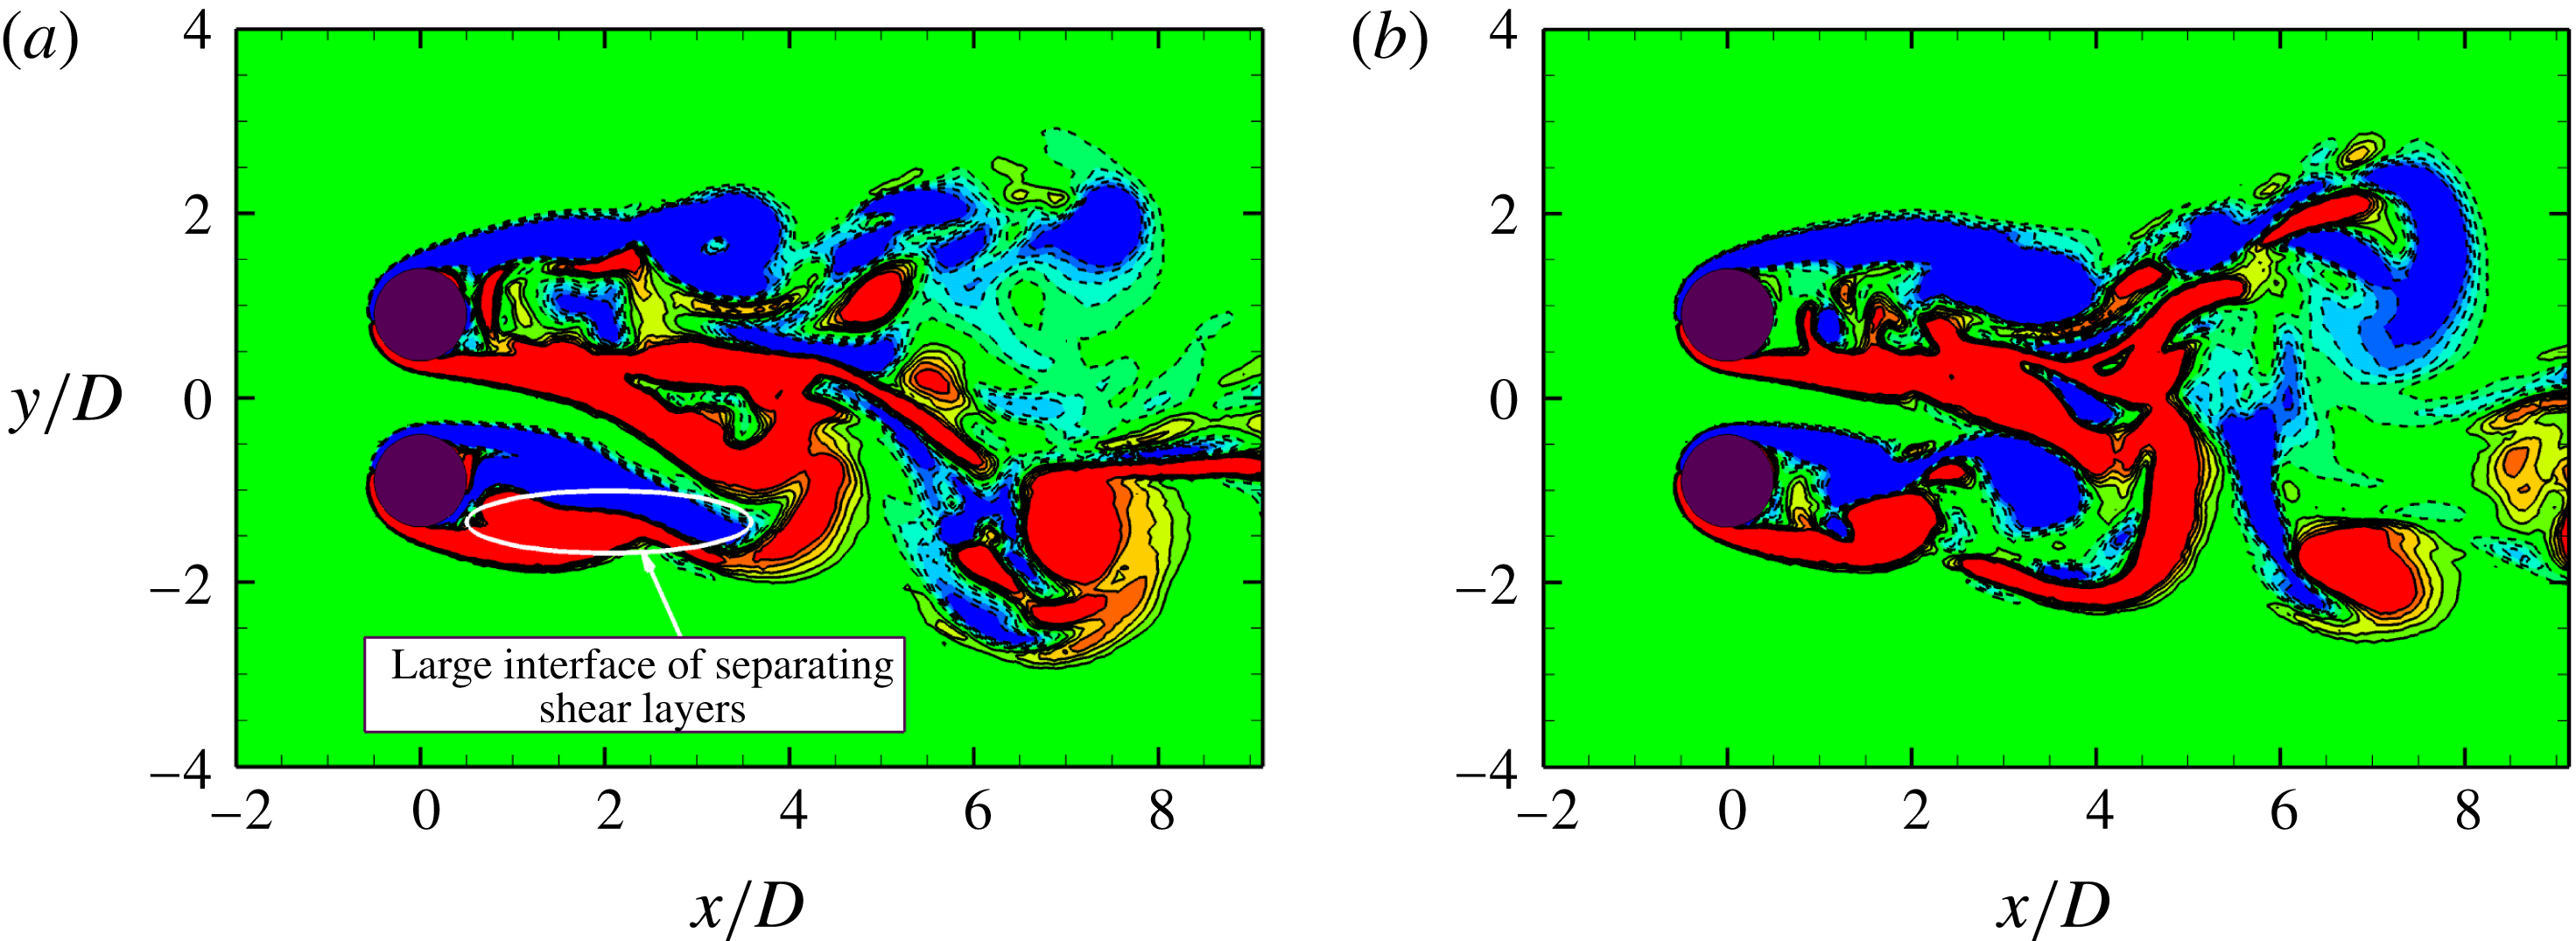
Spanwise vorticity
 $\unicode[STIX]{x1D714}_{z}$
contours in SSBS arrangement at
 $Re=500$
,
 $g^{\ast }=0.8$
,
 $l^{\ast }=5$
and
 $\unicode[STIX]{x1D714}_{z}=\pm 1.0$
(contours): (a)
 $tU/D=303$
; (b)
 $tU/D=313$
. Large interfaces of different vorticity concentrations are observed in the narrow near-wake regions.

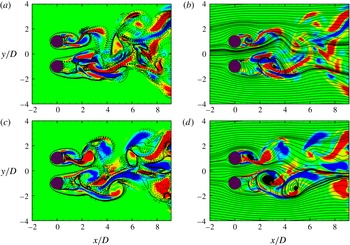
Streamline and instantaneous contours of streamwise vorticity
 $\unicode[STIX]{x1D714}_{x}$
and spanwise vorticity
 $\unicode[STIX]{x1D714}_{z}$
of cylinders in SSBS arrangement in the
 $(x,y)$
-plane at
 $Re=500$
,
 $g^{\ast }=1.0$
,
 $tU/D=300$
,
 $\unicode[STIX]{x1D714}_{x}=\pm 1.0$
(contours),
 $\unicode[STIX]{x1D714}_{z}=\pm 1.0$
(solid-dashed lines) in (a,c) and sectional streamlines in (b,d): (a,b)
 $l^{\ast }=4$
; (c,d)
 $l^{\ast }=8$
.

Instantaneous contours of
 $\unicode[STIX]{x1D714}_{x}$
in the
 $(y,z)$
-plane in SSBS arrangement at
 $Re=500$
,
 $g^{\ast }=0.8$
,
 $\unicode[STIX]{x1D714}_{x}=\pm 1.0$
and
 $x/D=1$
: (a)
 $tU/D=175$
, the gap flow momentarily deflects to Cylinder 1 (top section); (b)
 $tU/D=350$
the gap flow momentarily deflects to Cylinder 2 (bottom section).

Comparison of
 $\unicode[STIX]{x1D709}_{xy}/\unicode[STIX]{x1D709}_{t}$
between isolated and side-by-side arrangement at
 $Re=500$
,
 $g^{\ast }=0.8$
and
 $tU/D\in [300,350]$
.
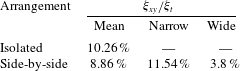
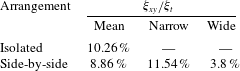
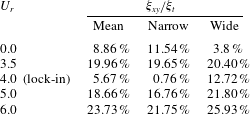
In table 8, a comparison of secondary enstrophy is shown between a representative SSBS arrangement in the deflected gap-flow regime and a stationary isolated cylinder. Overall, the mean concentration of secondary enstrophy
 $\unicode[STIX]{x1D709}_{xy}/\unicode[STIX]{x1D709}_{t}$
in the near-wake region for the side-by-side arrangement is smaller than the isolated counterpart. While
 $\unicode[STIX]{x1D709}_{xy}/\unicode[STIX]{x1D709}_{t}$
is distinctively small in the wide near-wake region,
 $\unicode[STIX]{x1D709}_{xy}/\unicode[STIX]{x1D709}_{t}$
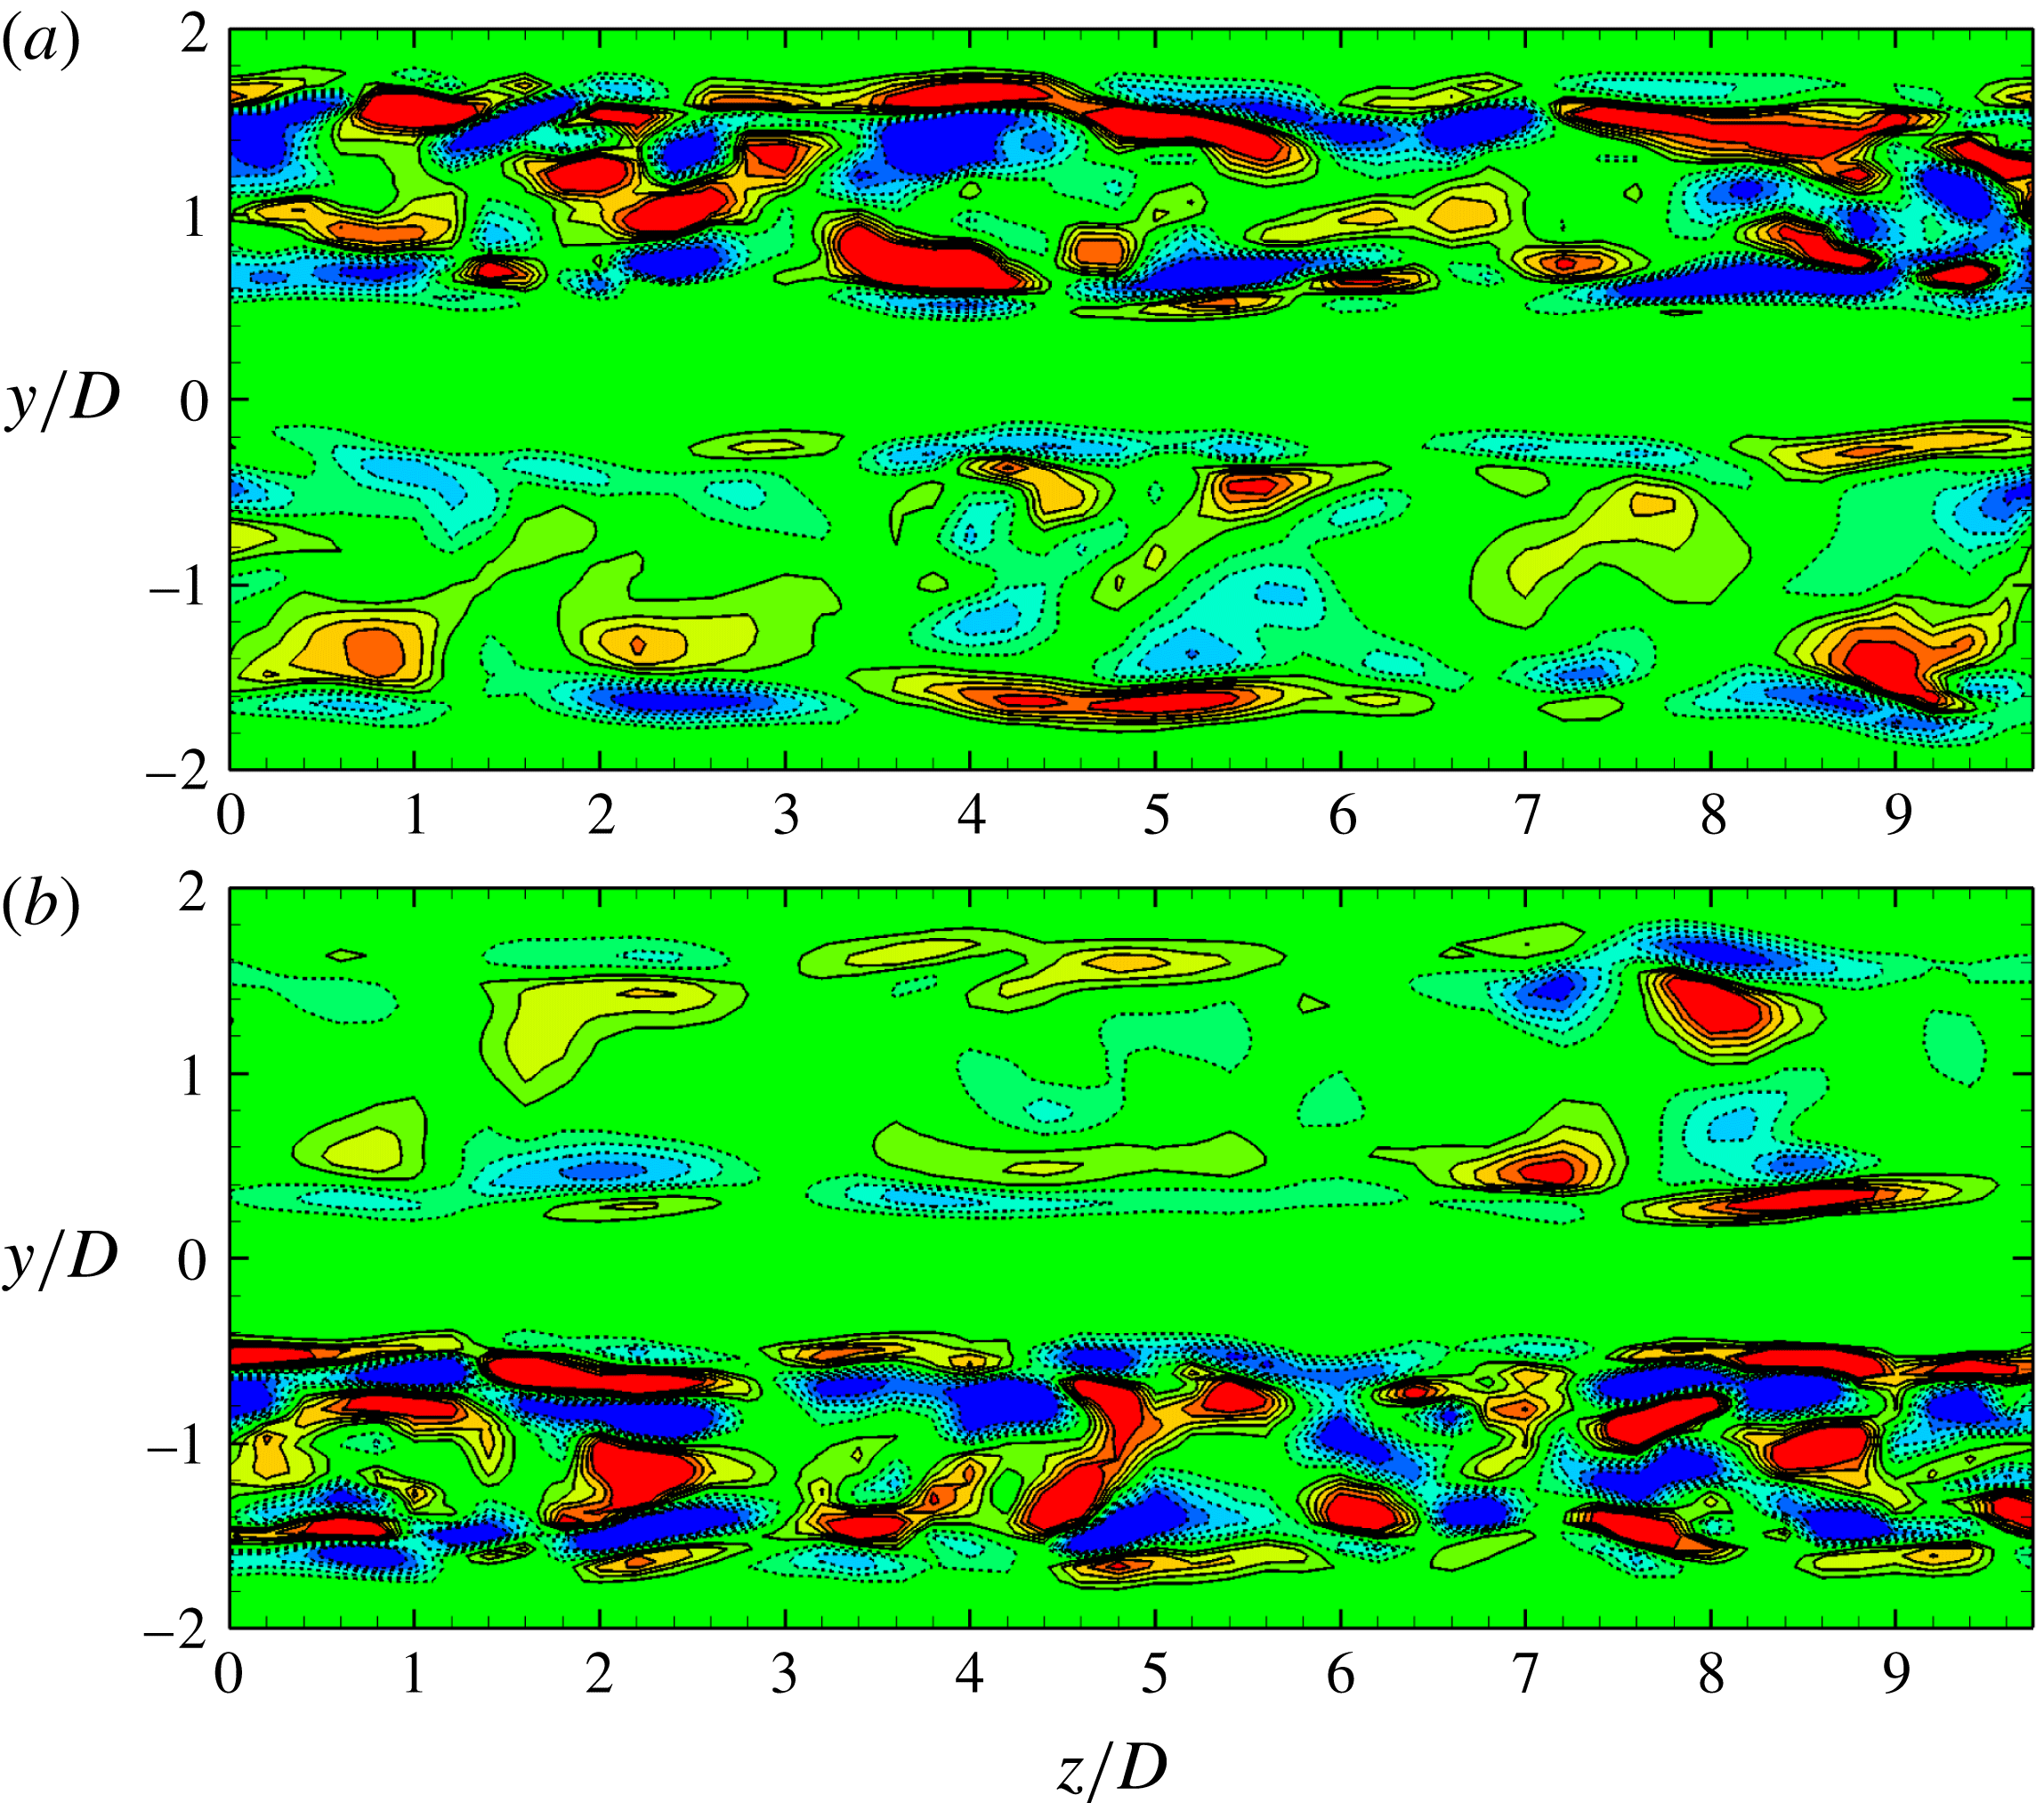
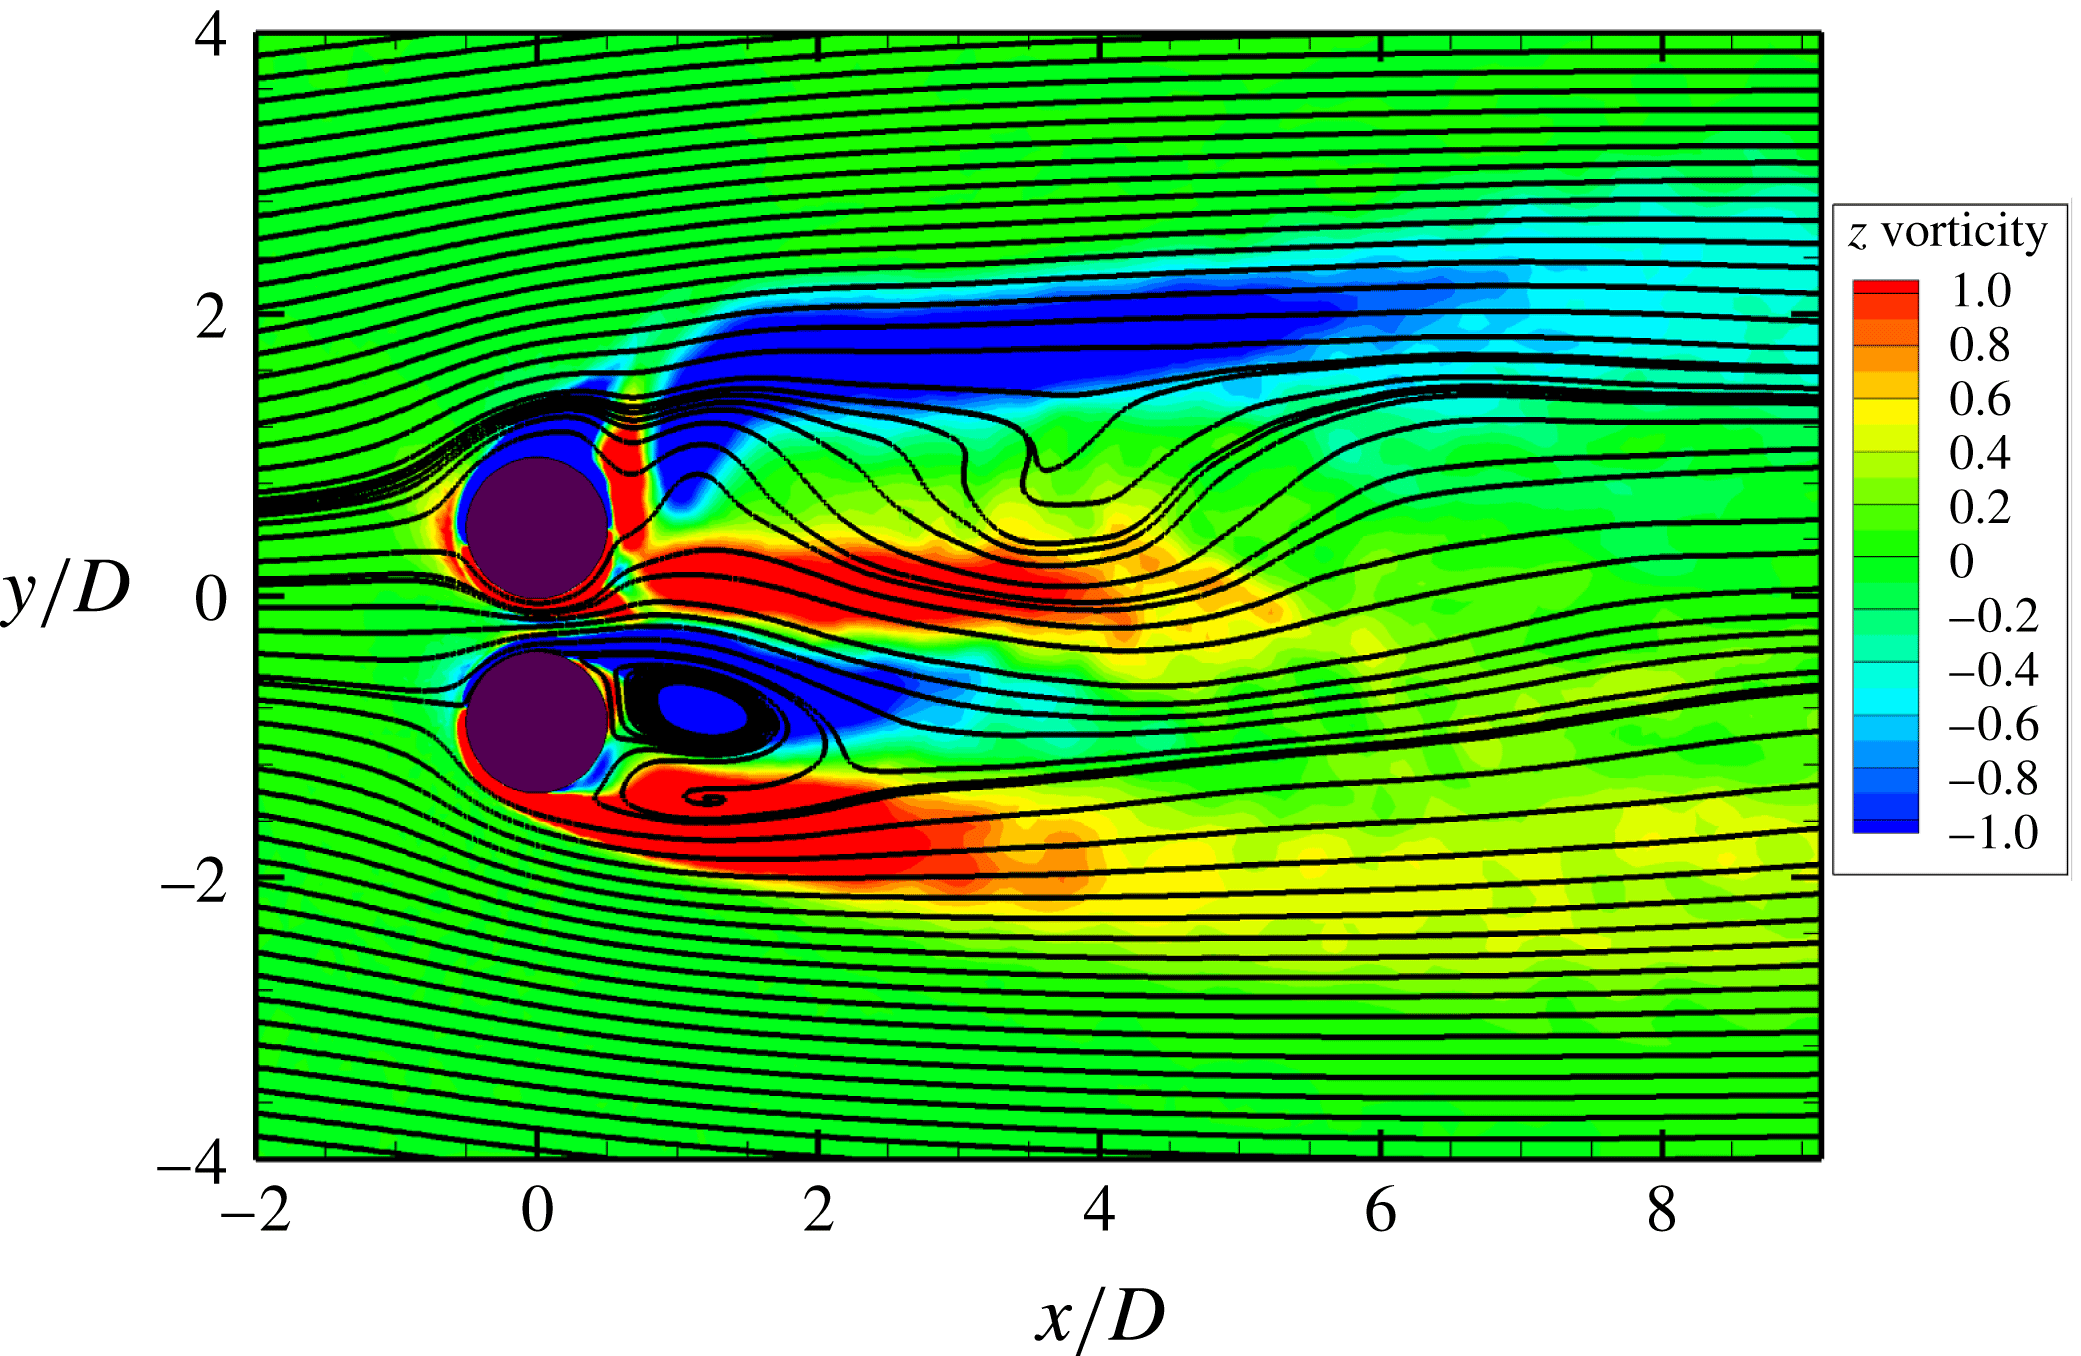
in the narrow near-wake region is higher than the secondary enstrophy concentration for the isolated cylinder. This observation is consistent with the discussion in appendix B, where the near-wake instability is shown to be dependent on the gap-flow proximity interference. Consequently, the three-dimensional structure prevails in the narrow near-wake region where the gap-flow proximity interference is significant, as visualized in figure 9.
A further investigation on the velocity profile in figure 10 shows that the three-dimensional gap flow at higher Reynolds number possesses a much larger fluid shear rate than its two-dimensional counterparts. Therefore, the fluid in the narrow near wake is more prone to being unstable, because of the high velocity gradients associated with the gap flow. Apart from the critical factors identified in § 3, we also notice another unstable factor in the narrow near-wake region, large adjoining interfaces of
 $\unicode[STIX]{x1D714}_{z}$
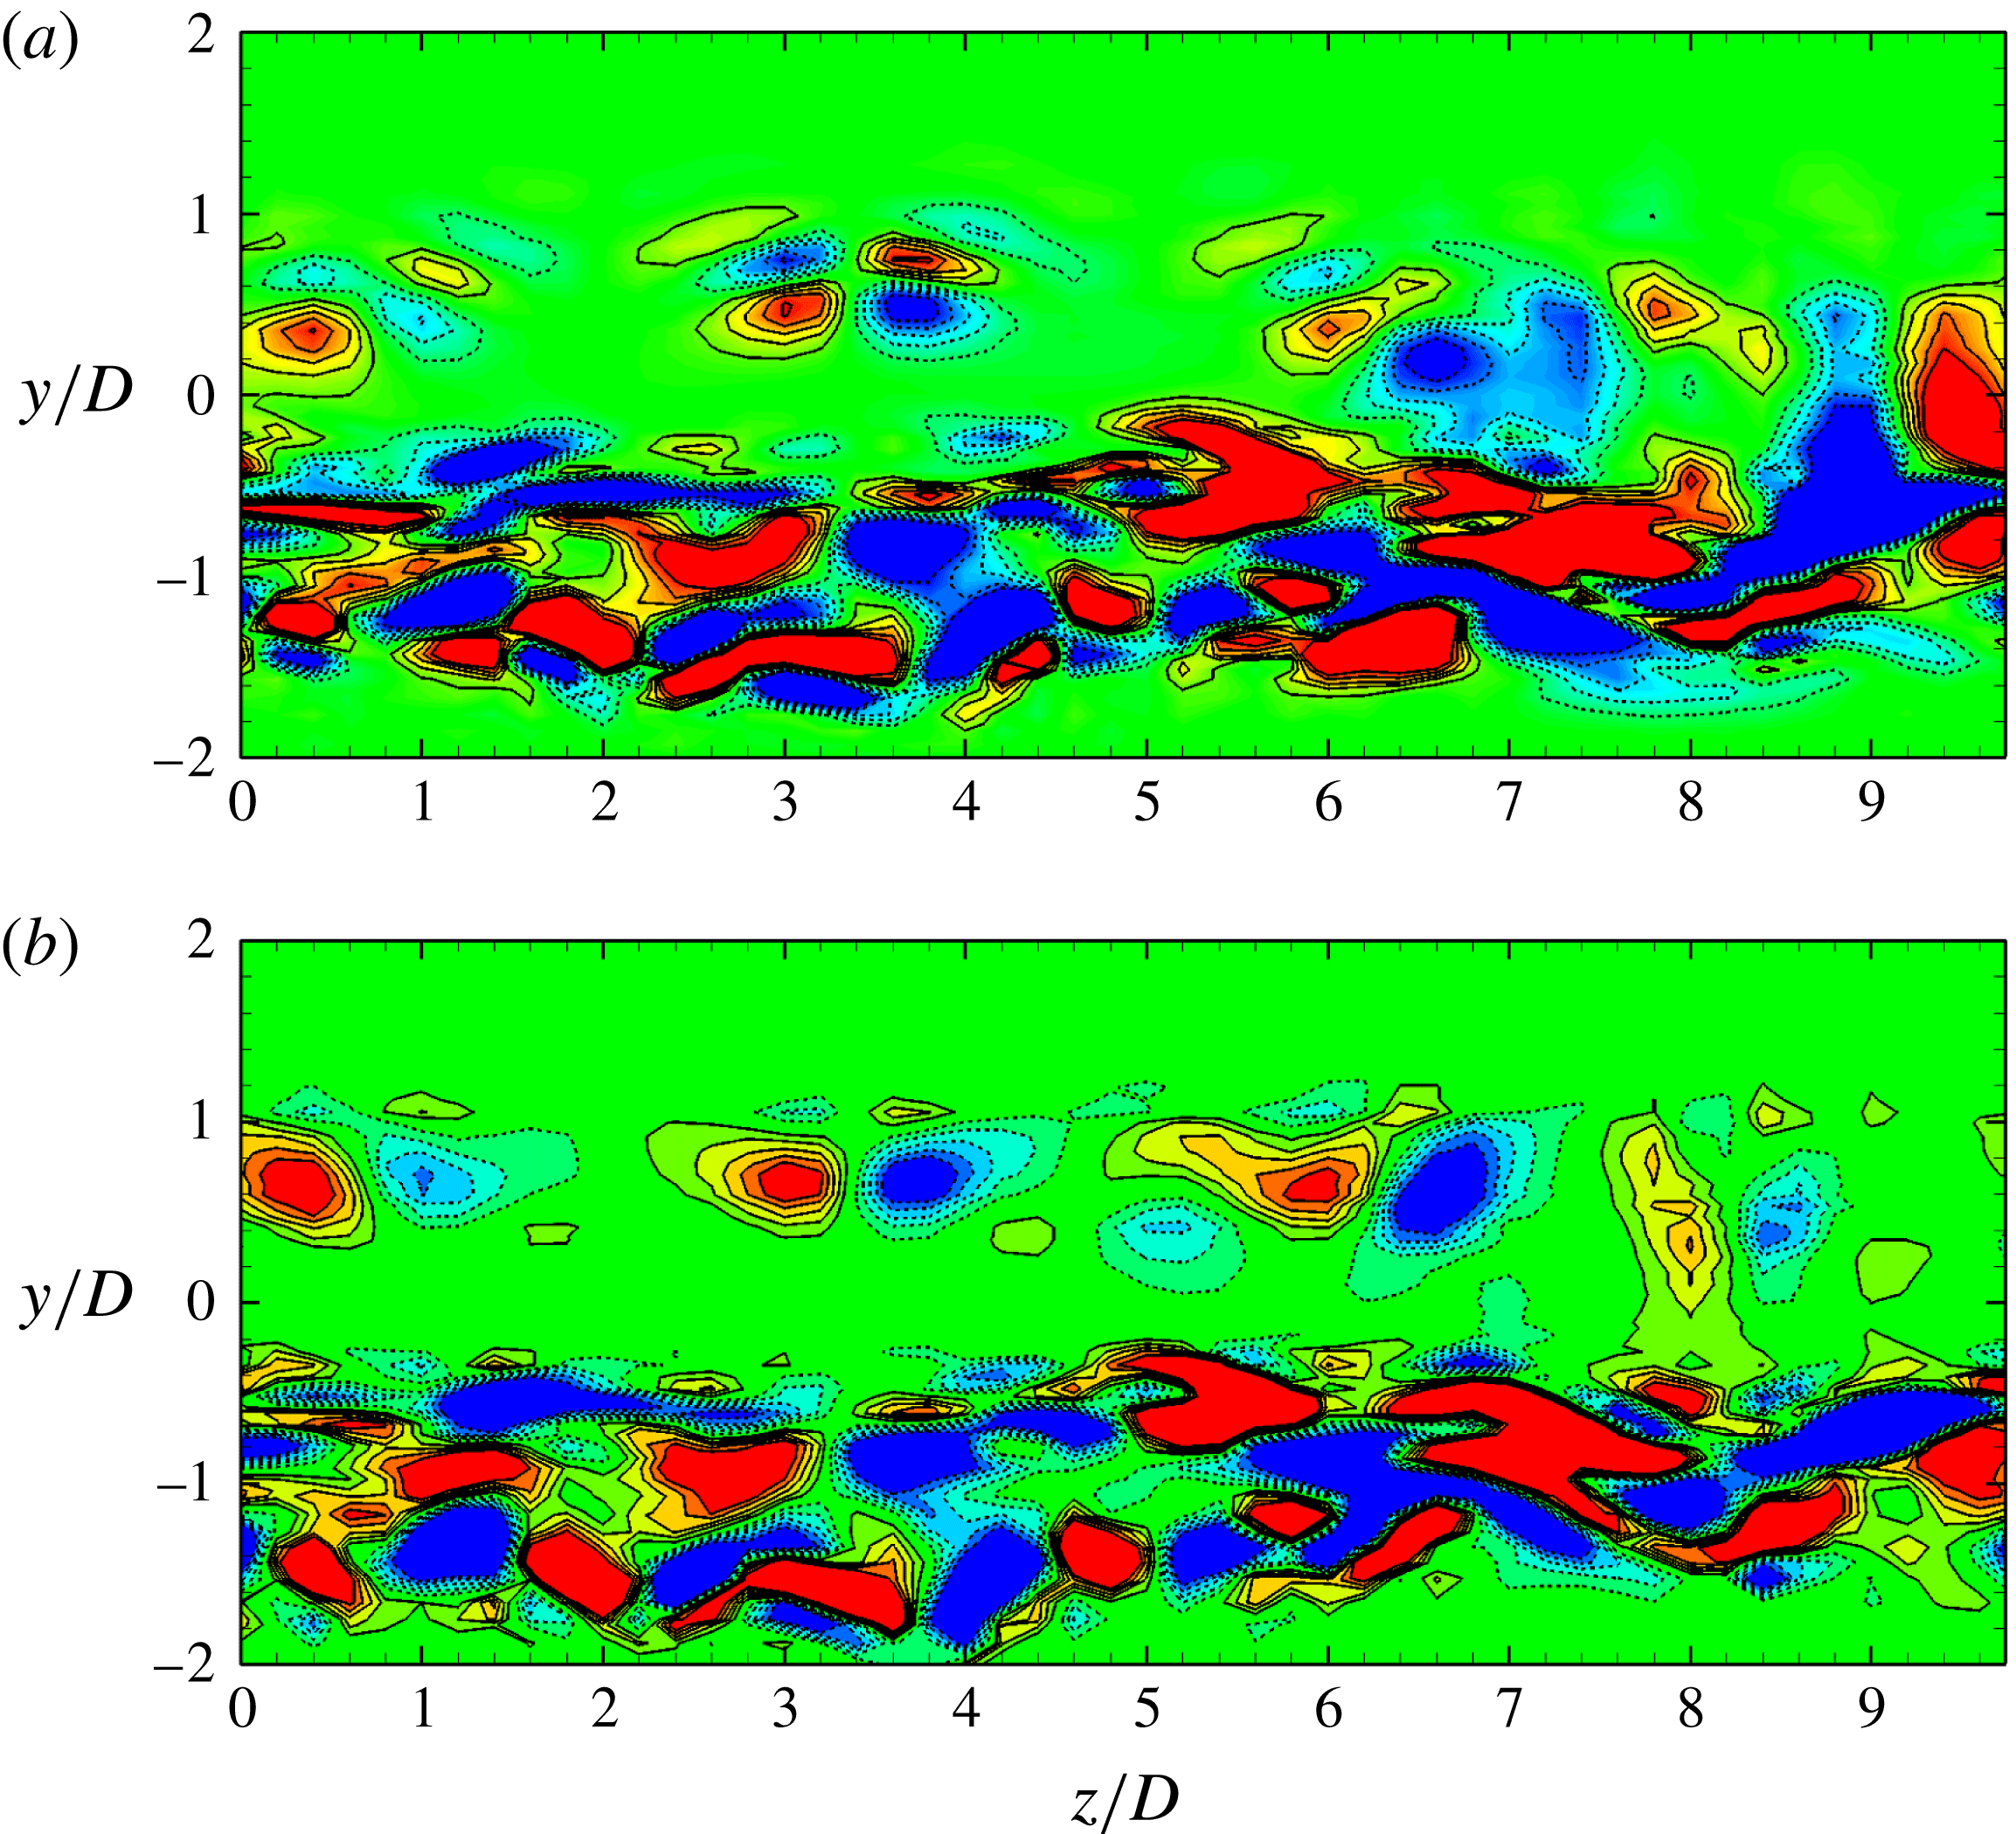
clusters, as shown in figure 11. Shear stresses with a remarkable strength are present along these adjoining interfaces, which may result in a significant streamwise vorticity concentration formed in the narrow near-wake region, as shown in figure 12. In the near-wake region, the locations with intensified streamwise vorticity clusters follow these interfaces closely, which further confirms the observation about the SSP in § 3. The SSP lies right at the point with significant streamwise vorticity concentration along the interface of
 $\unicode[STIX]{x1D714}_{z}$
clusters. A more straightforward visualization is exhibited by the
 $(y,z)$
-sectional contour plots of
 $\unicode[STIX]{x1D714}_{x}$
in figure 13. Figure 13(a,b) refers to the contour plots of
 $\unicode[STIX]{x1D714}_{x}$
for the SSBS arrangement, where the gap flow deflects to Cylinder 1 and Cylinder 2 at
 $tU/D=175$
and
 $tU/D=350$
, respectively. Two distinct streamwise vorticity distributions are clearly shown in the narrow and wide near-wake regions. This asymmetric distribution of streamwise vorticity has a profound influence on the dynamical response.
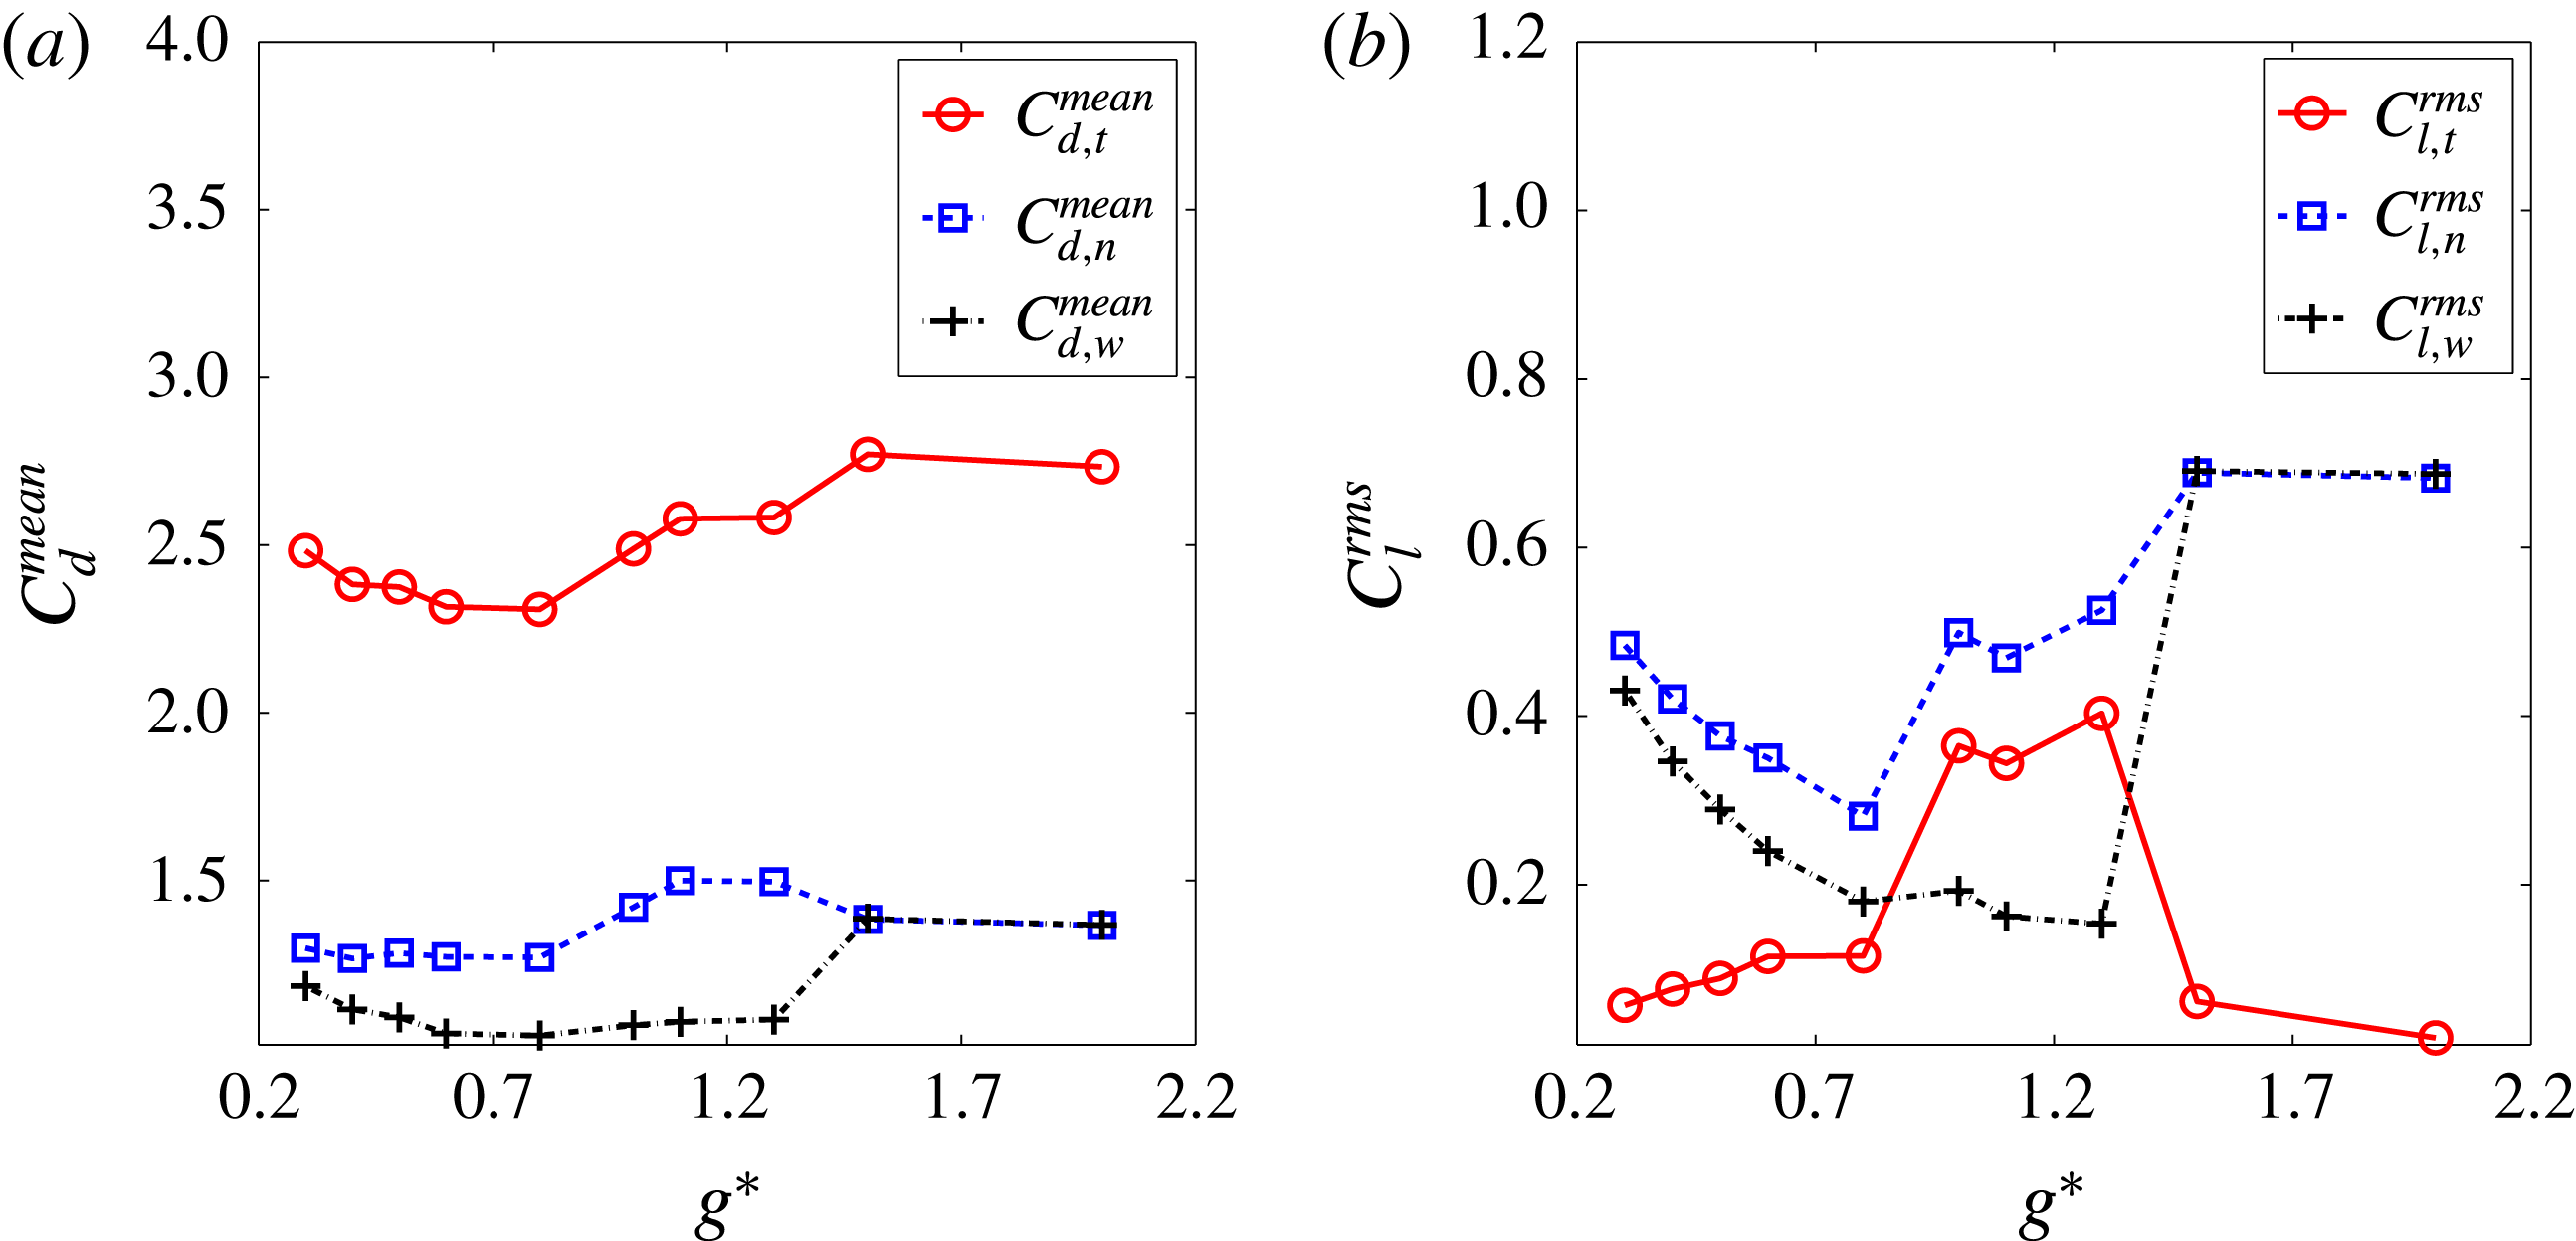
Fluid forces as a function of gap ratio for stationary side-by-side arrangement: (a) mean drag coefficient, (b) r.m.s. lift coefficient. Here the subscripts
 $t$
,
 $n$
and
 $w$
denote respectively the total, the narrow and the wide near-wake regions.

Figure 14(a) shows distinctively higher and lower
 $C_{d}^{mean}$
values for the cylinders with the narrow and wide near-wake regions, respectively. Furthermore, the algebraic sum of
 $C_{d}^{mean}$
shows a base-bleeding type effect, as reported for the SSBS arrangements in Bearman & Wadcock (Reference Bearman and Wadcock1973). Hence the overall response of
 $C_{d}$
is diminished. However, this base-bleeding effect is weakened as the value of
 $g^{\ast }$
increases beyond the deflected gap-flow regime. To analyse the transverse response,
 $C_{l}^{rms}$
is adopted to characterize the fluctuating extent of
 $C_{l}$
as a function of the gap ratio
 $g^{\ast }$
in figure 14(b). The quantity
 $C_{l}^{rms}$
represents the fluctuation intensity (absolute value) of the transverse force and is measured from the
 $C_{l}^{mean}$
value between a time interval when the gap flow stably deflects to one particular side of the SSBS arrangements. It should be noted that the in-phase and out-of-phase of
 $C_{l}$
from both cylinders have to be taken into account when computing the resultant transverse force fluctuation for the SBS arrangements. Similar to figure 14(a), a drastic transverse fluctuation of the lift appears along the cylinder with the narrow near-wake region. The overall transverse fluctuation of
 $C_{l}$
is calculated as a sum of
 $C_{l}$
from each cylinder, as shown in figure 14(b). A force modulation is clearly shown for the deflected gap-flow regime
 $g^{\ast }\in [0.8,1.5]$
, where the overall transverse fluctuation of
 $C_{l}$
is excited by a factor of
 $2.4$
. Since the gap flow is significantly suppressed at
 $g^{\ast }\lesssim 0.5$
, the overall fluctuation of
 $C_{l}$
is benign. While
 $C_{l}^{rms}$
along an individual cylinder is drastically amplified beyond
 $g^{\ast }\gtrsim 1.5$
, the overall value of the entire structure system is diminished and cancelled out, due to the dominant out-of-phase vortex-shedding regime at these gap ratios. The above observations show that the gap-flow instability is critical to the global stability of the SBS systems in engineering operations with a relatively small gap ratio, where stronger force modulation is observed.
It is observed that the 3-D flow not only modulates the hydrodynamic forces, but also the flip-flop frequency
 $f_{flip}$
. Generally,
 $f_{flip}$
appears to be lower in 3-D higher
 $Re$
flow, as compared to its 2-D laminar flow counterpart. Liu & Jaiman (Reference Liu and Jaiman2016) visualized the flip-flopping instant as a zero phase angle difference between
 $C_{l}$
in the SSBS arrangements. Different from a two-dimensional laminar flow, the existence of the streamwise vorticity clusters in the formation region varies
 $f_{vs}$
values along the cylinder span and results in a repetitive temporal modulation of
 $f_{vs}$
. To completely flip over the gap-flow direction, at least a few cycles of in-phase vortex shedding are required. Due to the interference from the gap flow, the modulation of
 $f_{vs}$
on each cylinder is chaotic and intermittent and
 $f_{flip}$
is significantly influenced by the three-dimensionality.
5 Coupling of VIV and 3-D gap-flow kinematics
In this section, the VIV kinematics and the gap-flow instability are coupled in the VSBS arrangements, where Cylinder 1 is elastically mounted in the transverse direction. To begin, the flip-flopping frequency
 $f_{flip}$
is analysed for the VSBS arrangements. In figure 15,
 $f_{flip}$
is not observed at the off-lock-in conditions for the selected time window, which is similar to the SSBS arrangement. However,
 $f_{flip}$
in the VSBS arrangements is remarkably increased during the onset and the end of VIV lock-in. In the present 3-D work,
 $f_{flip}$
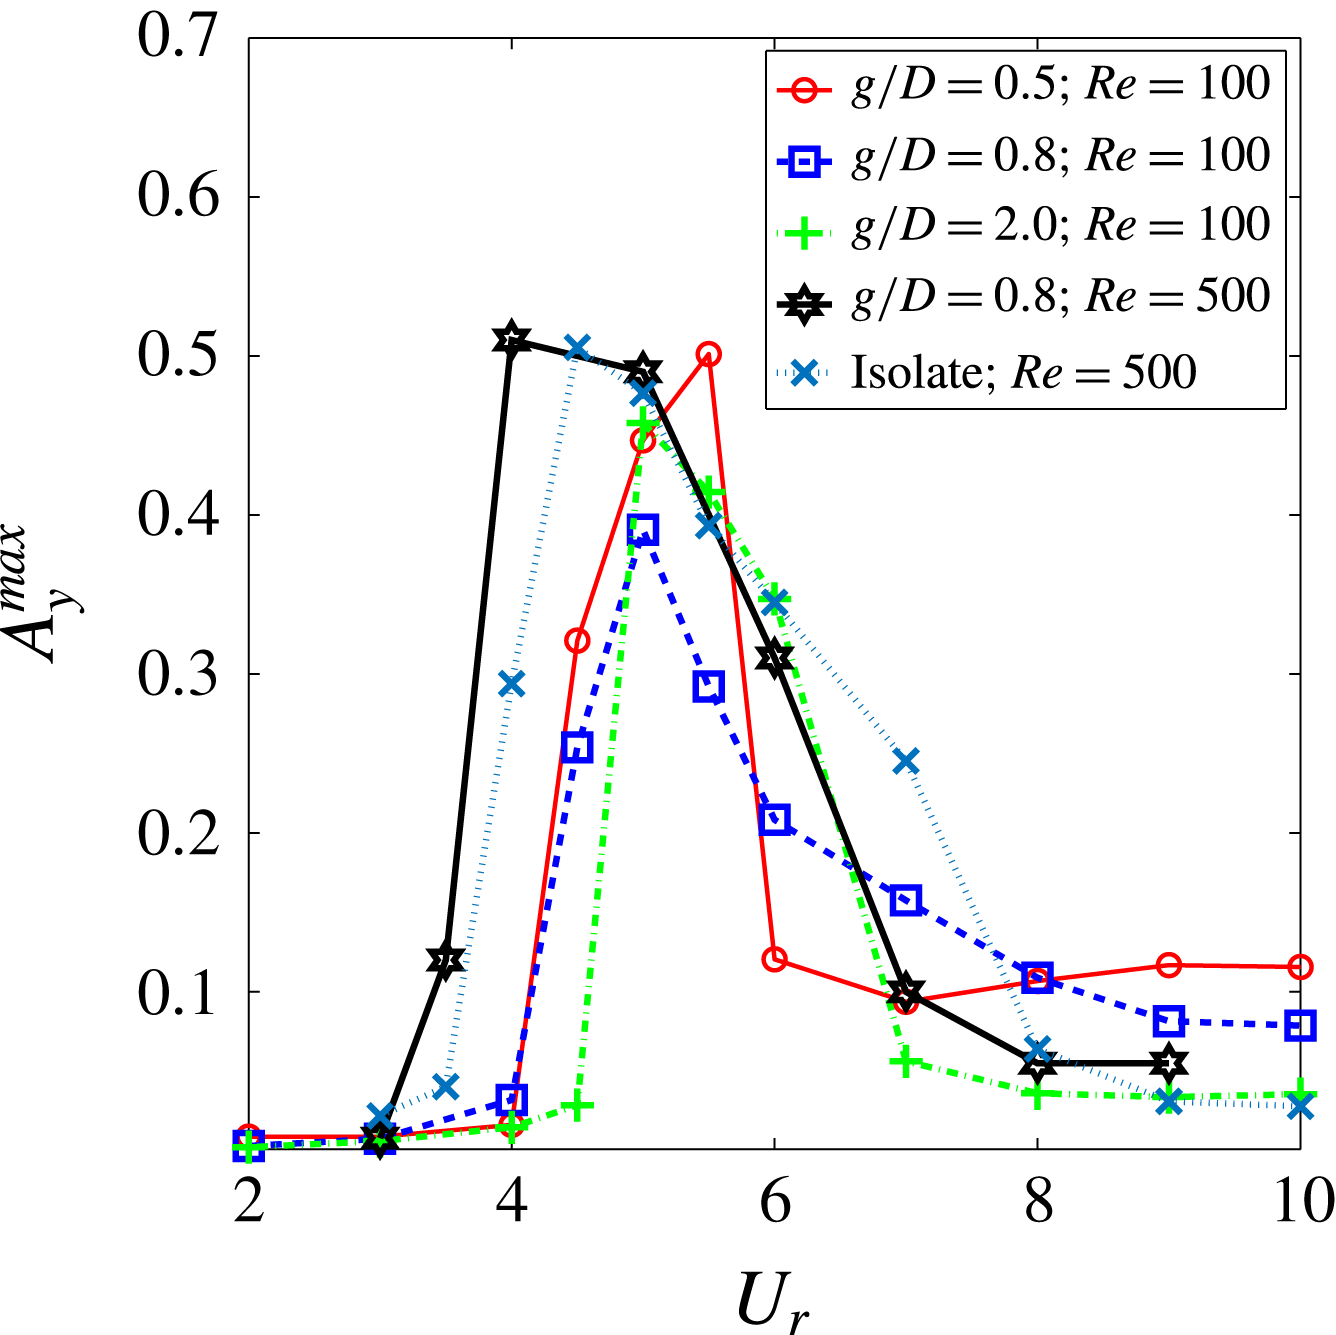
is found to be VIV dependent. Some of the phenomena reported by Liu & Jaiman (Reference Liu and Jaiman2016) for the VSBS arrangements are also observed for the 3-D configurations. For instance, a quasi-stable deflected gap-flow regime occurs at the peak lock-in, where the gap flow permanently deflects toward the locked-in vibrating cylinder. This is further evident by the time-averaged spanwise vorticity contours in figure 16. Liu & Jaiman (Reference Liu and Jaiman2016) observed an early onset of VIV in the side-by-side arrangements for 2-D laminar flow. The enhanced vortex interaction results in a higher frequency of primary vortex shedding and an early match with the natural frequency
 $f_{n}$
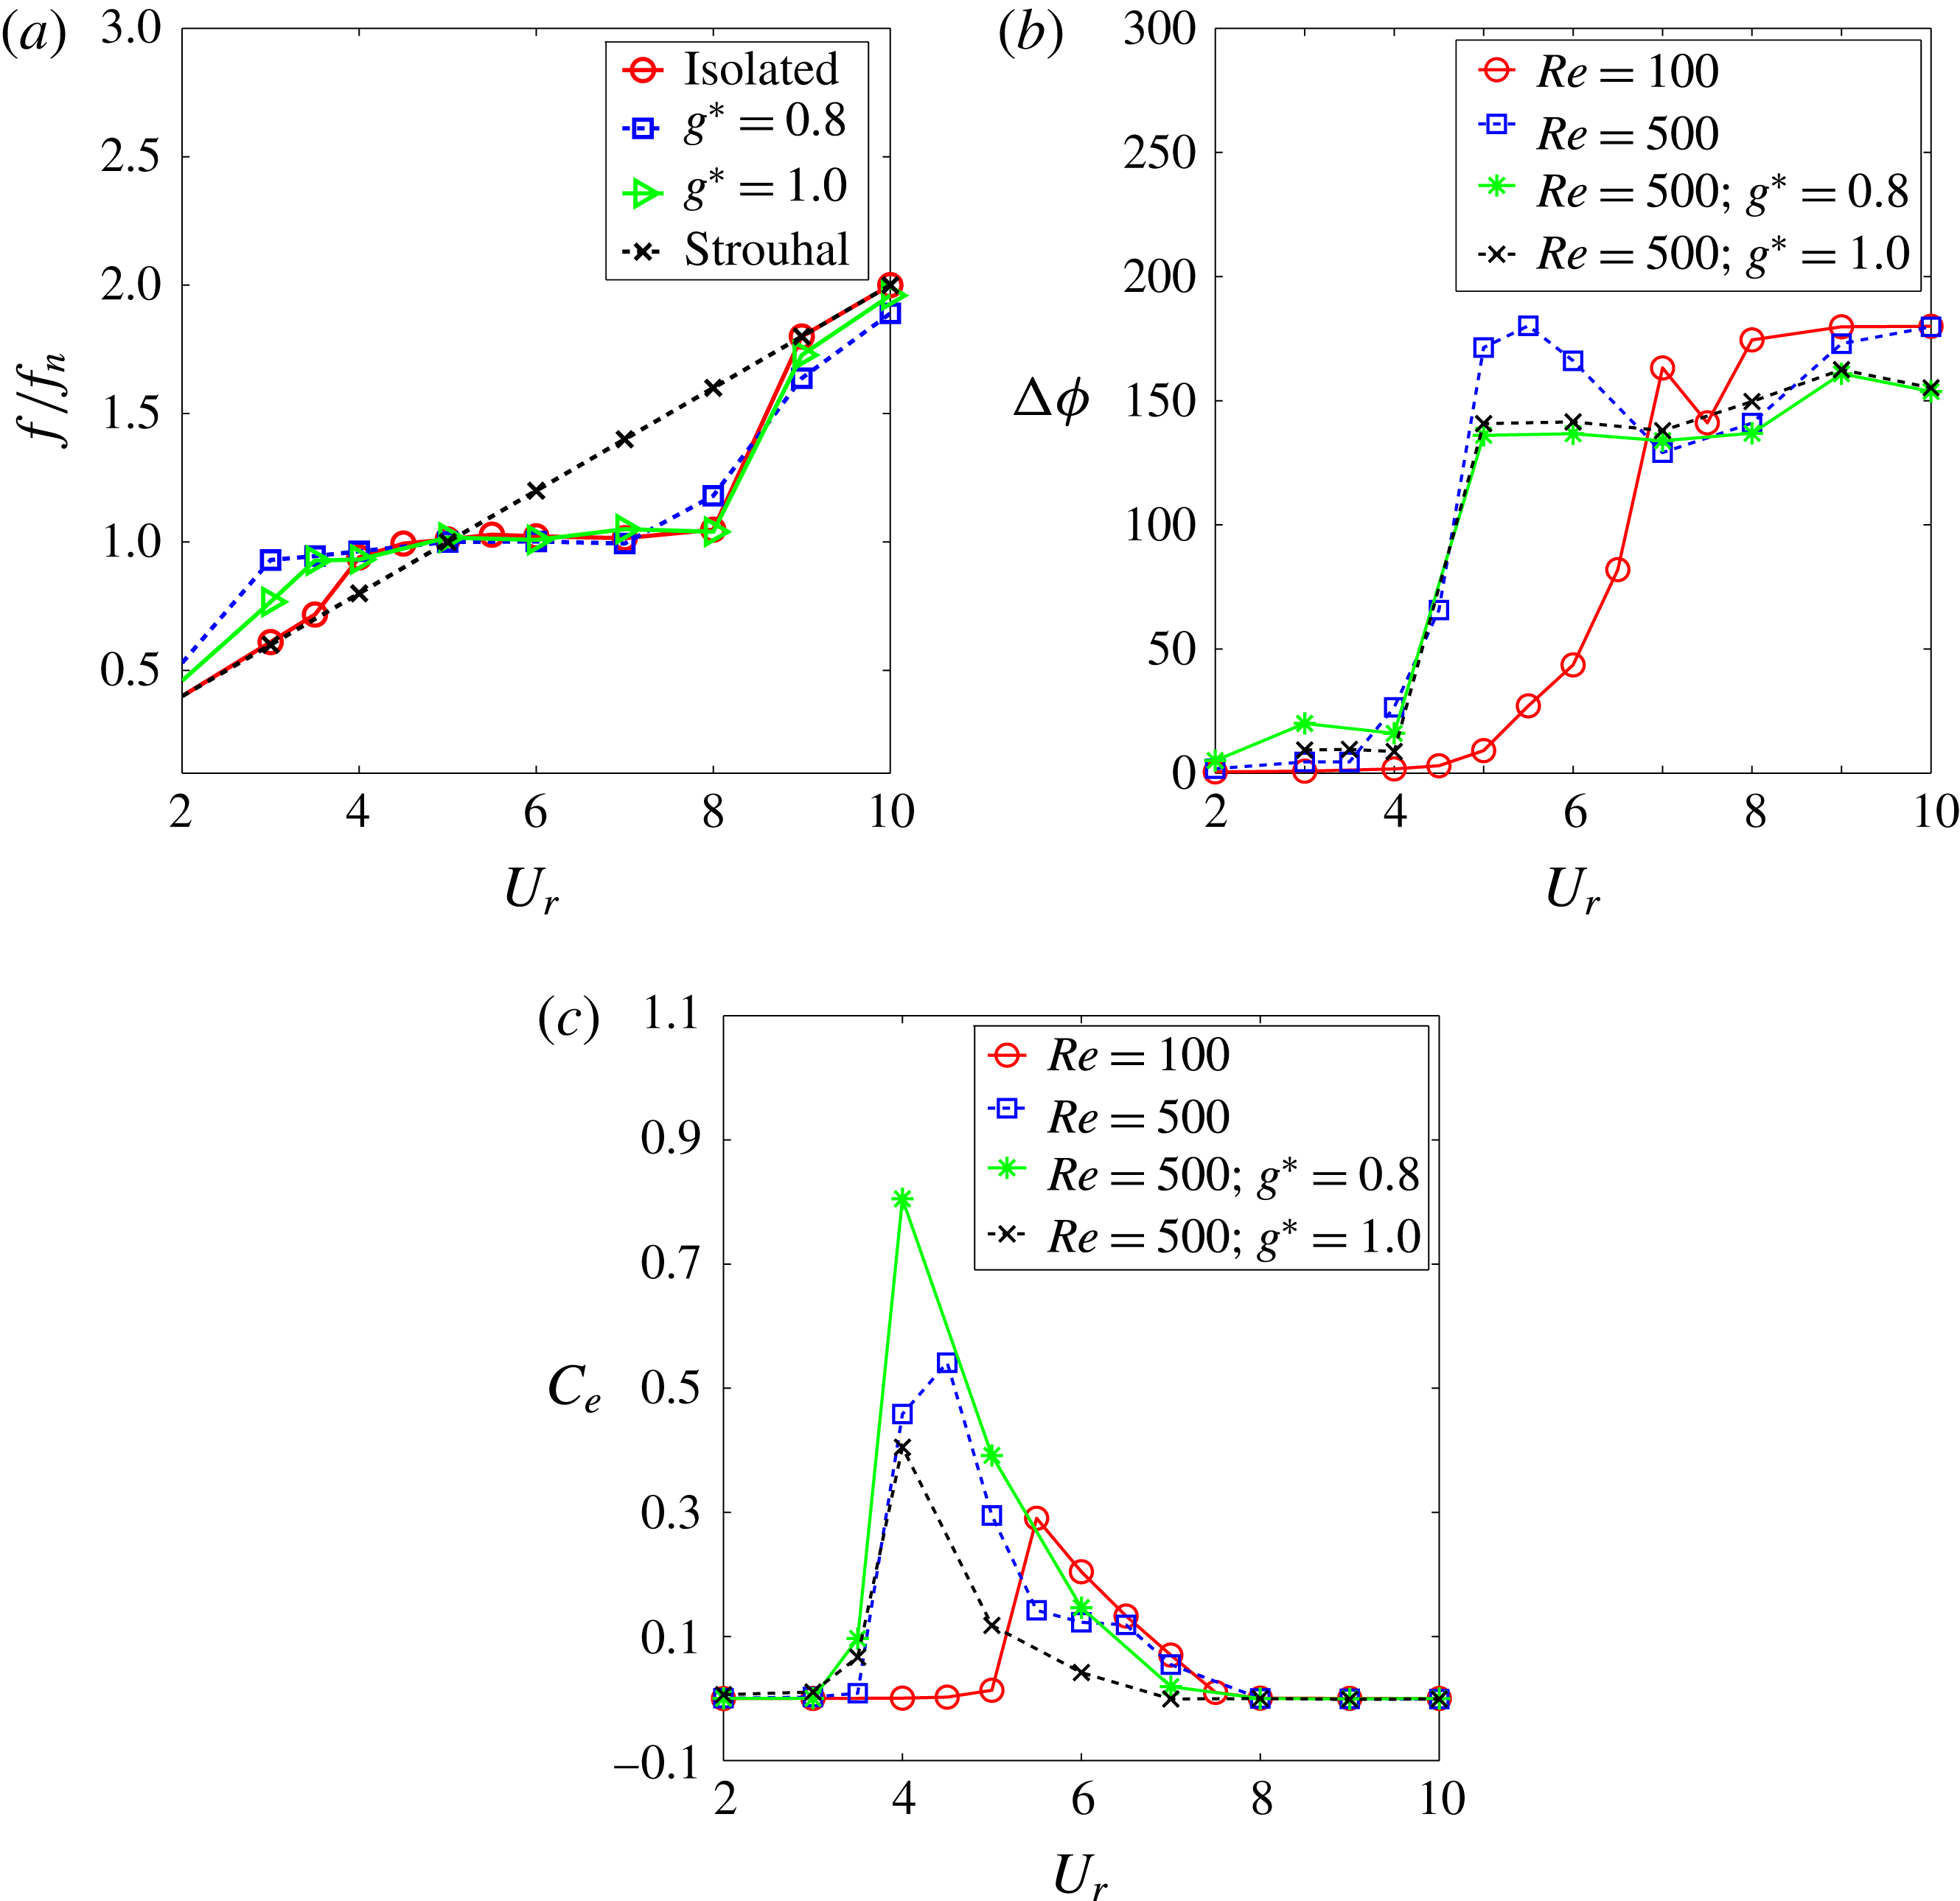
. In the present investigation, an early onset of VIV is also observed in figure 17 for the 3-D side-by-side arrangement. This observation is further supported by the analysis of the vortex-shedding frequency, the phase angle and energy transfer in figure 20, which are discussed in the subsequent paragraphs.
Time traces of drag force in the VSBS arrangements where Cylinder 1 vibrates in the cross-flow direction at
 $Re=500$
,
 $g^{\ast }=0.8$
,
 $m^{\ast }=10$
and
 $\unicode[STIX]{x1D701}=0.01$
:
 $U_{r}=$
(a)
 $3$
; (b)
 $4$
; (c)
 $6$
and (d)
 $8$
.

Streamline and time-averaged spanwise vorticity
 $\unicode[STIX]{x1D714}_{z}$
for the VSBS arrangement at
 $Re=500$
,
 $g^{\ast }=0.8$
,
 $m^{\ast }=10$
,
 $\unicode[STIX]{x1D701}=0.01$
,
 $U_{r}=4.0$
and
 $\unicode[STIX]{x1D714}_{z}=\pm 1.0$
. Time averaging is performed over 60 vortex-shedding cycles.

Time-averaged maximum transverse vibration amplitude as a function of reduced velocity for the VSBS arrangements at
 $Re=100$
and
 $500$
,
 $m^{\ast }=10$
and
 $\unicode[STIX]{x1D701}=0.01$
.

Streamline and instantaneous contours of streamwise vorticity
 $\unicode[STIX]{x1D714}_{x}$
and spanwise vorticity
 $\unicode[STIX]{x1D714}_{z}$
in the
 $(x,y)$
-plane for
 $U_{r}=4.0$
(peak lock-in) at
 $(Re,g^{\ast },m^{\ast },\unicode[STIX]{x1D701})=(500,0.8,10,0.01)$
: (a,b)
 $l^{\ast }=4$
; (c,d)
 $l^{\ast }=8$
. In (a,c)
 $\unicode[STIX]{x1D714}_{x}=\pm 1.0$
and
 $\unicode[STIX]{x1D714}_{z}=\pm 1.0$
are shown by colour contours and solid-dashed lines, respectively.

Instantaneous contours of
 $\unicode[STIX]{x1D714}_{x}$
in the
 $(y,z)$
-plane for the cylinders in the VSBS arrangement at
 $Re=500$
,
 $g^{\ast }=0.8$
,
 $m^{\ast }=10.0$
,
 $\unicode[STIX]{x1D701}=0.01$
,
 $U_{r}=4$
(the peak lock-in stage),
 $\unicode[STIX]{x1D714}_{x}=\pm 1.0$
(contours) and
 $tU/D=350$
: (a)
 $x^{\ast }=1.25$
; (b)
 $x^{\ast }=1.5$
.

Comparison of
 $\unicode[STIX]{x1D709}_{xy}/\unicode[STIX]{x1D709}_{t}$
for the VSBS arrangement at
 $Re=500$
,
 $g^{\ast }=0.8$
,
 $U_{r}\in [0.0,6.0]$
and
 $tU/D\in [300,350]$
.
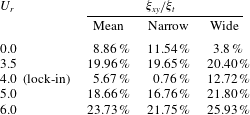
As discussed in the previous sections, the near-wake instability is subject to influences from the VIV kinematics and the gap-flow-induced proximity interference. When both VIV and proximity interference are present in a three-dimensional flow, the analysis of three-dimensionality become subtle and multifaceted. To quantify the three-dimensional effect, the concentration of
 $\unicode[STIX]{x1D709}_{xy}$
is summarized in table 9 for a representative VSBS arrangement at different reduced velocity values. It can be seen that the recovery of two-dimensional response is still observable at the peak lock-in. A distinct difference of
 $\unicode[STIX]{x1D709}_{xy}$
concentration in the narrow and wide near-wake regions is found at the stationary and peak lock-in. The concentration of
 $\unicode[STIX]{x1D709}_{xy}$
is further visualized by the sectional contour plots in figure 18 in the
 $(x,y)$
-plane and figure 19 in the
 $(y,z)$
-plane. The concentration of
 $\unicode[STIX]{x1D709}_{xy}$
in the near wake behind the locked-in cylinder is much higher than its isolated counterpart at the same
 $U_{r}$
value, owing to the gap-flow proximity interference. Different from the SSBS arrangements, the
 $\unicode[STIX]{x1D709}_{xy}$
concentration in the narrow near-wake region behind a vibrating cylinder is relatively smaller than the wide one behind the stationary cylinder. This phenomenon is attributed to the regulation effect of VIV kinematics. The above observation implies both VIV and gap-flow proximity interference influence the near-wake instability in the VSBS arrangements. The VIV regulation effect is generally dominant at the peak lock-in.
Variations of frequency, phase relation and energy transfer as a function of reduced velocity at
 $Re\in [100,500]$
,
 $m^{\ast }=10$
and
 $\unicode[STIX]{x1D701}=0.01$
: (a) frequency ratio
 $f/f_{n}$
, (b) phase angle
 $\unicode[STIX]{x0394}\unicode[STIX]{x1D719}$
between
 $A_{y}$
and
 $C_{l}$
and (c) averaged energy transfer for one primary vortex-shedding cycle.

To further investigate the characteristics of the VIV lock-in and the gap-flow proximity interference, the VSBS arrangements at two typical gap ratios,
 $g^{\ast }=0.8$
and
 $1.0$
, in the deflected gap-flow regime are considered. Consistent with figure 17, the frequency ratio plot in figure 20(a) confirms the early onset of the VIV lock-in. While the onsets of the VIV lock-in at various
 $g^{\ast }$
values are different, the ends of VIV lock-in approximately occur at an identical
 $U_{r}$
value for the VSBS arrangements. The phase angle difference
 $\unicode[STIX]{x0394}\unicode[STIX]{x1D719}$
is plotted in figure 20(b), whereas
 $\unicode[STIX]{x0394}\unicode[STIX]{x1D719}$
is computed as
 $\unicode[STIX]{x0394}\unicode[STIX]{x1D719}=\unicode[STIX]{x1D719}_{A_{y}}-\unicode[STIX]{x1D719}_{C_{l}}$
using the HHT technique to study the energy transfer between the fluid flow and the vibrating cylinder;
 $\unicode[STIX]{x0394}\unicode[STIX]{x1D719}$
is a time-averaged value. For the VSBS configuration, the phase difference is computed within a time interval when the gap-flow stably deflects toward the vibrating cylinder. For an isolated vibrating cylinder in 2-D flow,
 $\unicode[STIX]{x0394}\unicode[STIX]{x1D719}$
continues to increase as the reduced velocity increases. In addition, a sharp jump is observed for the isolated vibrating cylinder at approximately
 $U_{r}\approx [7,8]$
. A similar discontinuity of the phase angle difference was also reported by Leontini et al. (Reference Leontini, Stewart, Thompson and Hourigan2006) at the peak lock-in, which is correlated to the VIV kinematics and the vortex wakes. When
 $U_{r}$
exceeds
 $8.0$
,
 $\unicode[STIX]{x0394}\unicode[STIX]{x1D719}$
becomes completely out-of-phase. A similar profile of
 $\unicode[STIX]{x0394}\unicode[STIX]{x1D719}$
is observed for the isolated vibrating cylinder with 3-D flow, as depicted by the blue curve in figure 20(b). The difference is the onset of VIV lock-in, which occurs at a relatively smaller
 $U_{r}$
value. For the VSBS arrangements, when the gap ratio is reduced, the proximity interference becomes greater. As a consequence, the values of
 $\unicode[STIX]{x0394}\unicode[STIX]{x1D719}$
are stabilized at approximately
 $140^{\circ }$
for the vibrating cylinder in the VSBS arrangement at the lock-in
 $U_{r}\in [5,8]$
, as shown in figure 20(b).
In addition to the phase difference
 $\unicode[STIX]{x0394}\unicode[STIX]{x1D719}$
, the energy transfer coefficient
 $C_{e}$
is also a useful quantity. It indicates the instantaneous energy transfer between the fluid flow and the vibrating structure. As defined in table 5, the energy transfer coefficient
 $C_{e}$
is expressed by the transverse velocity
 $v$
for the dimensionless time scale
 $\unicode[STIX]{x1D70F}=tU/D$
in the primary vortex-shedding cycle
 $T$
. While the magnitude of
 $C_{e}$
quantifies the work done by the fluid forces, its sign indicates the direction of energy transfer. The trend of
 $C_{e}$
computed within one cycle of the primary vortex shedding is shown in figure 20(c). While the value of
 $C_{e}$
reaches a maximum at the peak lock-in for all cases, it attains its maximum at smaller
 $U_{r}$
for the higher Reynolds number. Specifically, the peak value of
 $C_{e}$
becomes greater, as the gap ratio decreases in the VSBS arrangements, e.g. the blue curve at
 $U_{r}=4.0$
in figure 20(c). In contrast, the curve of
 $C_{e}$
becomes closer to the isolated vibrating cylinder as the gap ratio increases. The amount of energy transferred over the off-lock-in
 $U_{r}$
range is trivial compared to the lock-in counterparts. These trends of
 $C_{e}$
imply that the amount of energy transferred is much larger for the configurations of higher Reynolds number and small gap ratio. In the next section, modal analysis is performed to investigate the near-wake instability in space and time.
6 Three-dimensional modal analysis
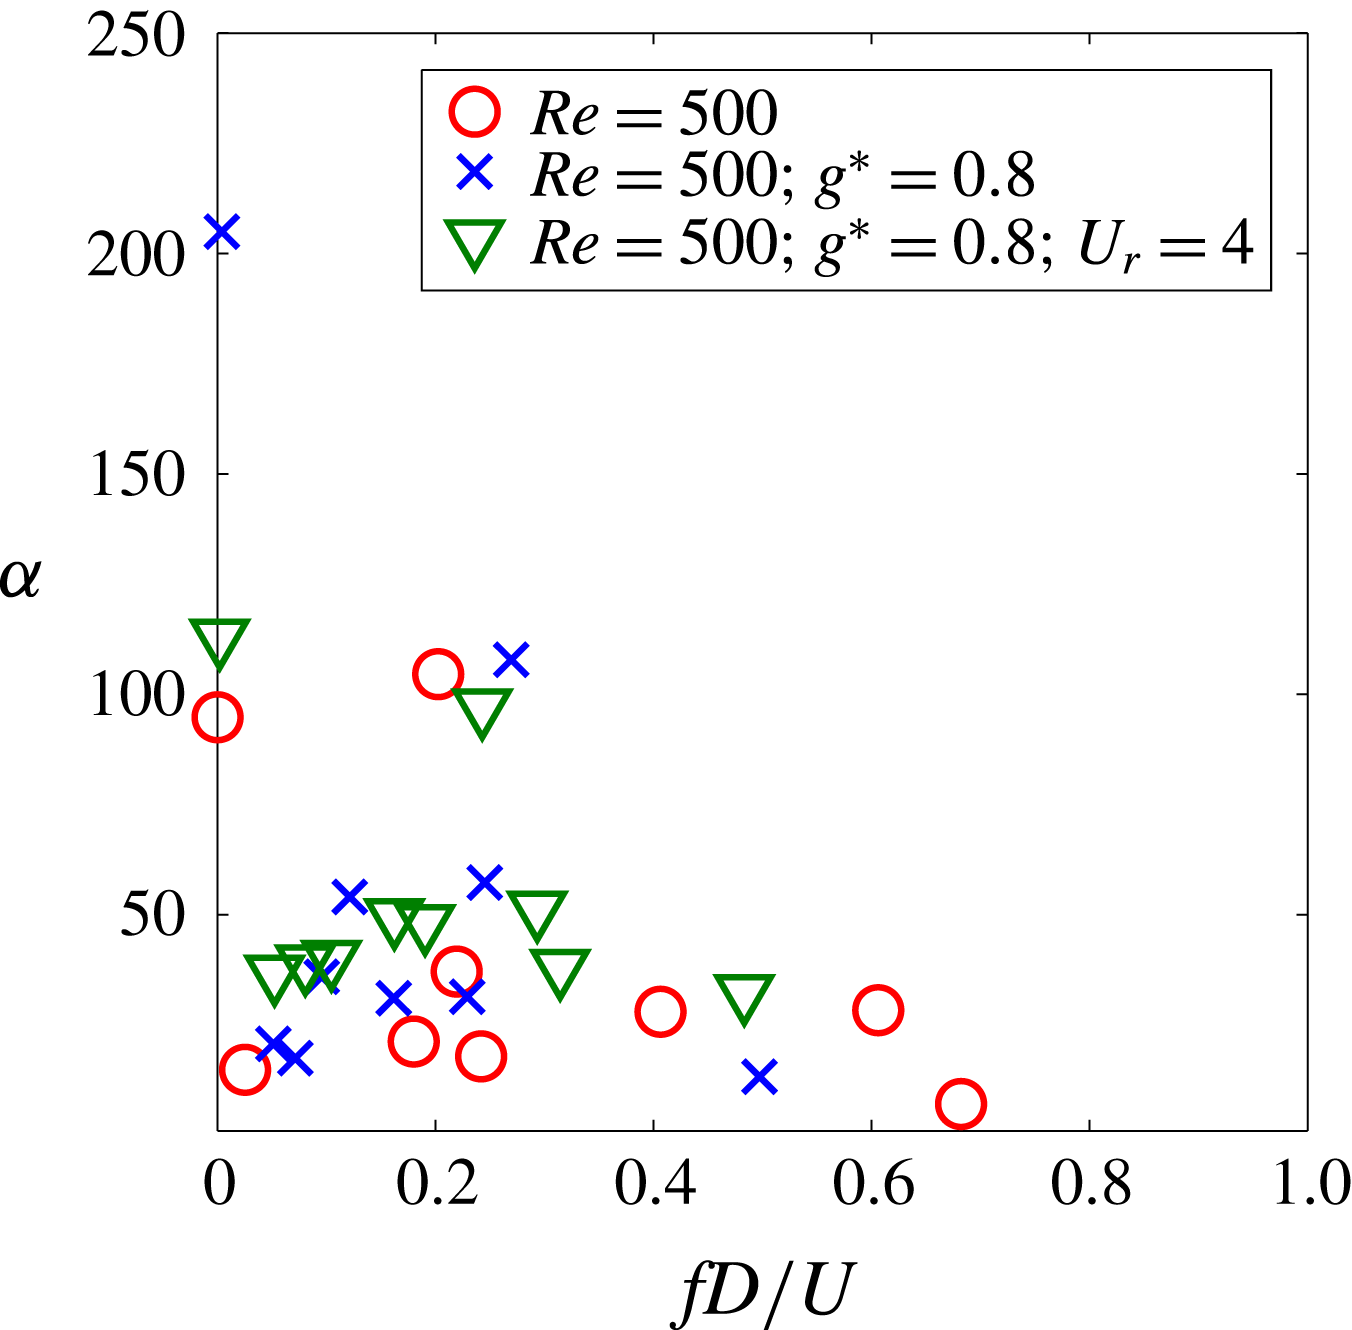
Dependence of DMD amplitude
 $\unicode[STIX]{x1D6FC}$
on frequency at
 $Re=500$
for stationary cylinder, SSBS arrangement at
 $g^{\ast }=0.8$
and VSBS arrangement at
 $g^{\ast }=0.8$
,
 $m^{\ast }=10$
,
 $\unicode[STIX]{x1D701}=0.01$
and
 $U_{r}=4$
. Here
 $\unicode[STIX]{x1D6FC}$
value is the optimal amplitude of each DMD mode obtained from an optimization process in the sparsity-promoting DMD analysis.

Three-dimensional wakes behind the multi-body systems at even a moderate Reynolds number can exhibit complex temporal and spatial flow features. To extract relevant dynamical information, a modal analysis has become a common practice to decompose the flow field into the important features with organized large-scale motions. Similar to the modal analysis in Liu & Jaiman (Reference Liu and Jaiman2016), SP-DMD is employed to investigate the spanwise vortical regions in the near wake of the SBS arrangements. The primary focus is to explore the complex dynamics of the three-dimensional wakes in the space and the frequency domains. From the computational efficiency viewpoint, the
 $l^{\ast }$
value is reduced to five diameters. To supplement the discussion in § 2.3, the adopted
 $l^{\ast }$
value should be sufficient to extract the important dynamical characteristics. A summary of the DMD amplitude as a function of frequency for the representative cases is shown in figure 21.
The decomposed DMD modes are selected via the sparsity-promoting process in the DMD technique (Jovanovic et al.
Reference Jovanovic, Schmid and Nichols2014). Here all selected cases show a strong mean flow vortex mode at
 $fD/U\approx 0$
. In particular, a stationary isolated circular cylinder shows three clusters of modal frequencies at approximately
 $0.2$
,
 $0.4$
and
 $0.6$
. Based on the discussion in Liu & Jaiman (Reference Liu and Jaiman2016) and comparison with other spectral analyses in the literature, the DMD modes at the modal frequencies
 $0.0$
,
 $0.2$
and
 $0.4$
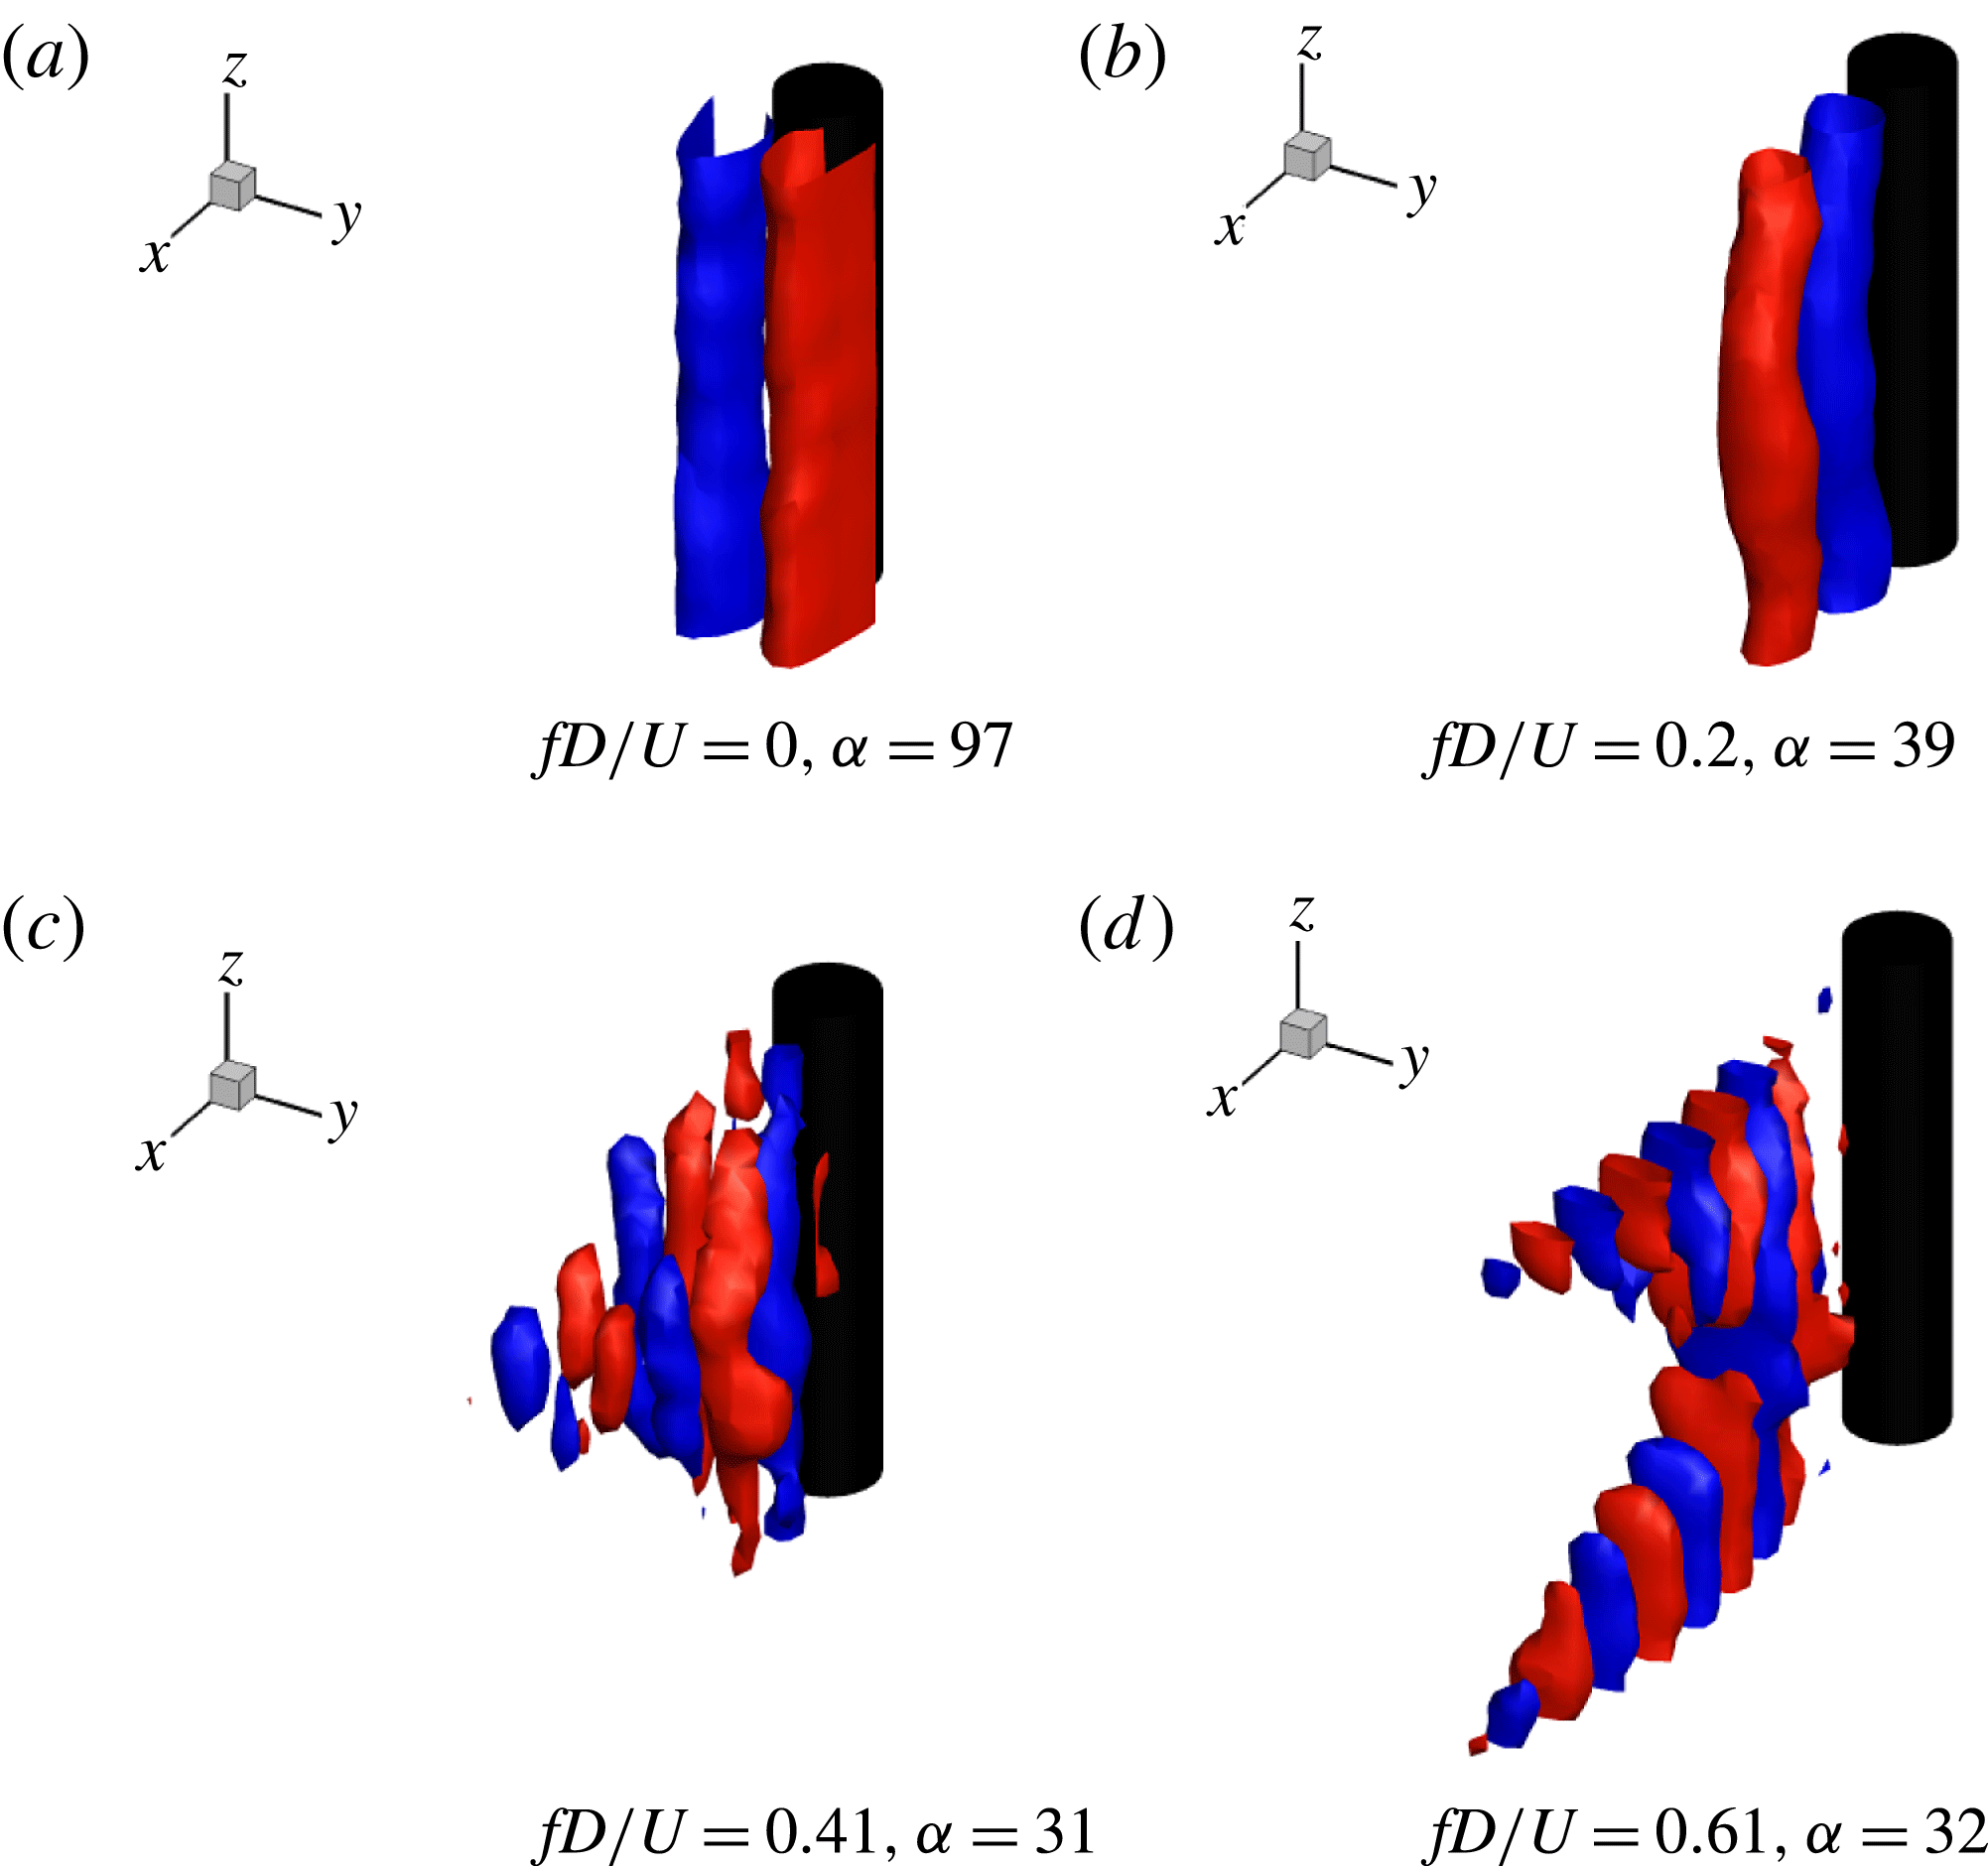
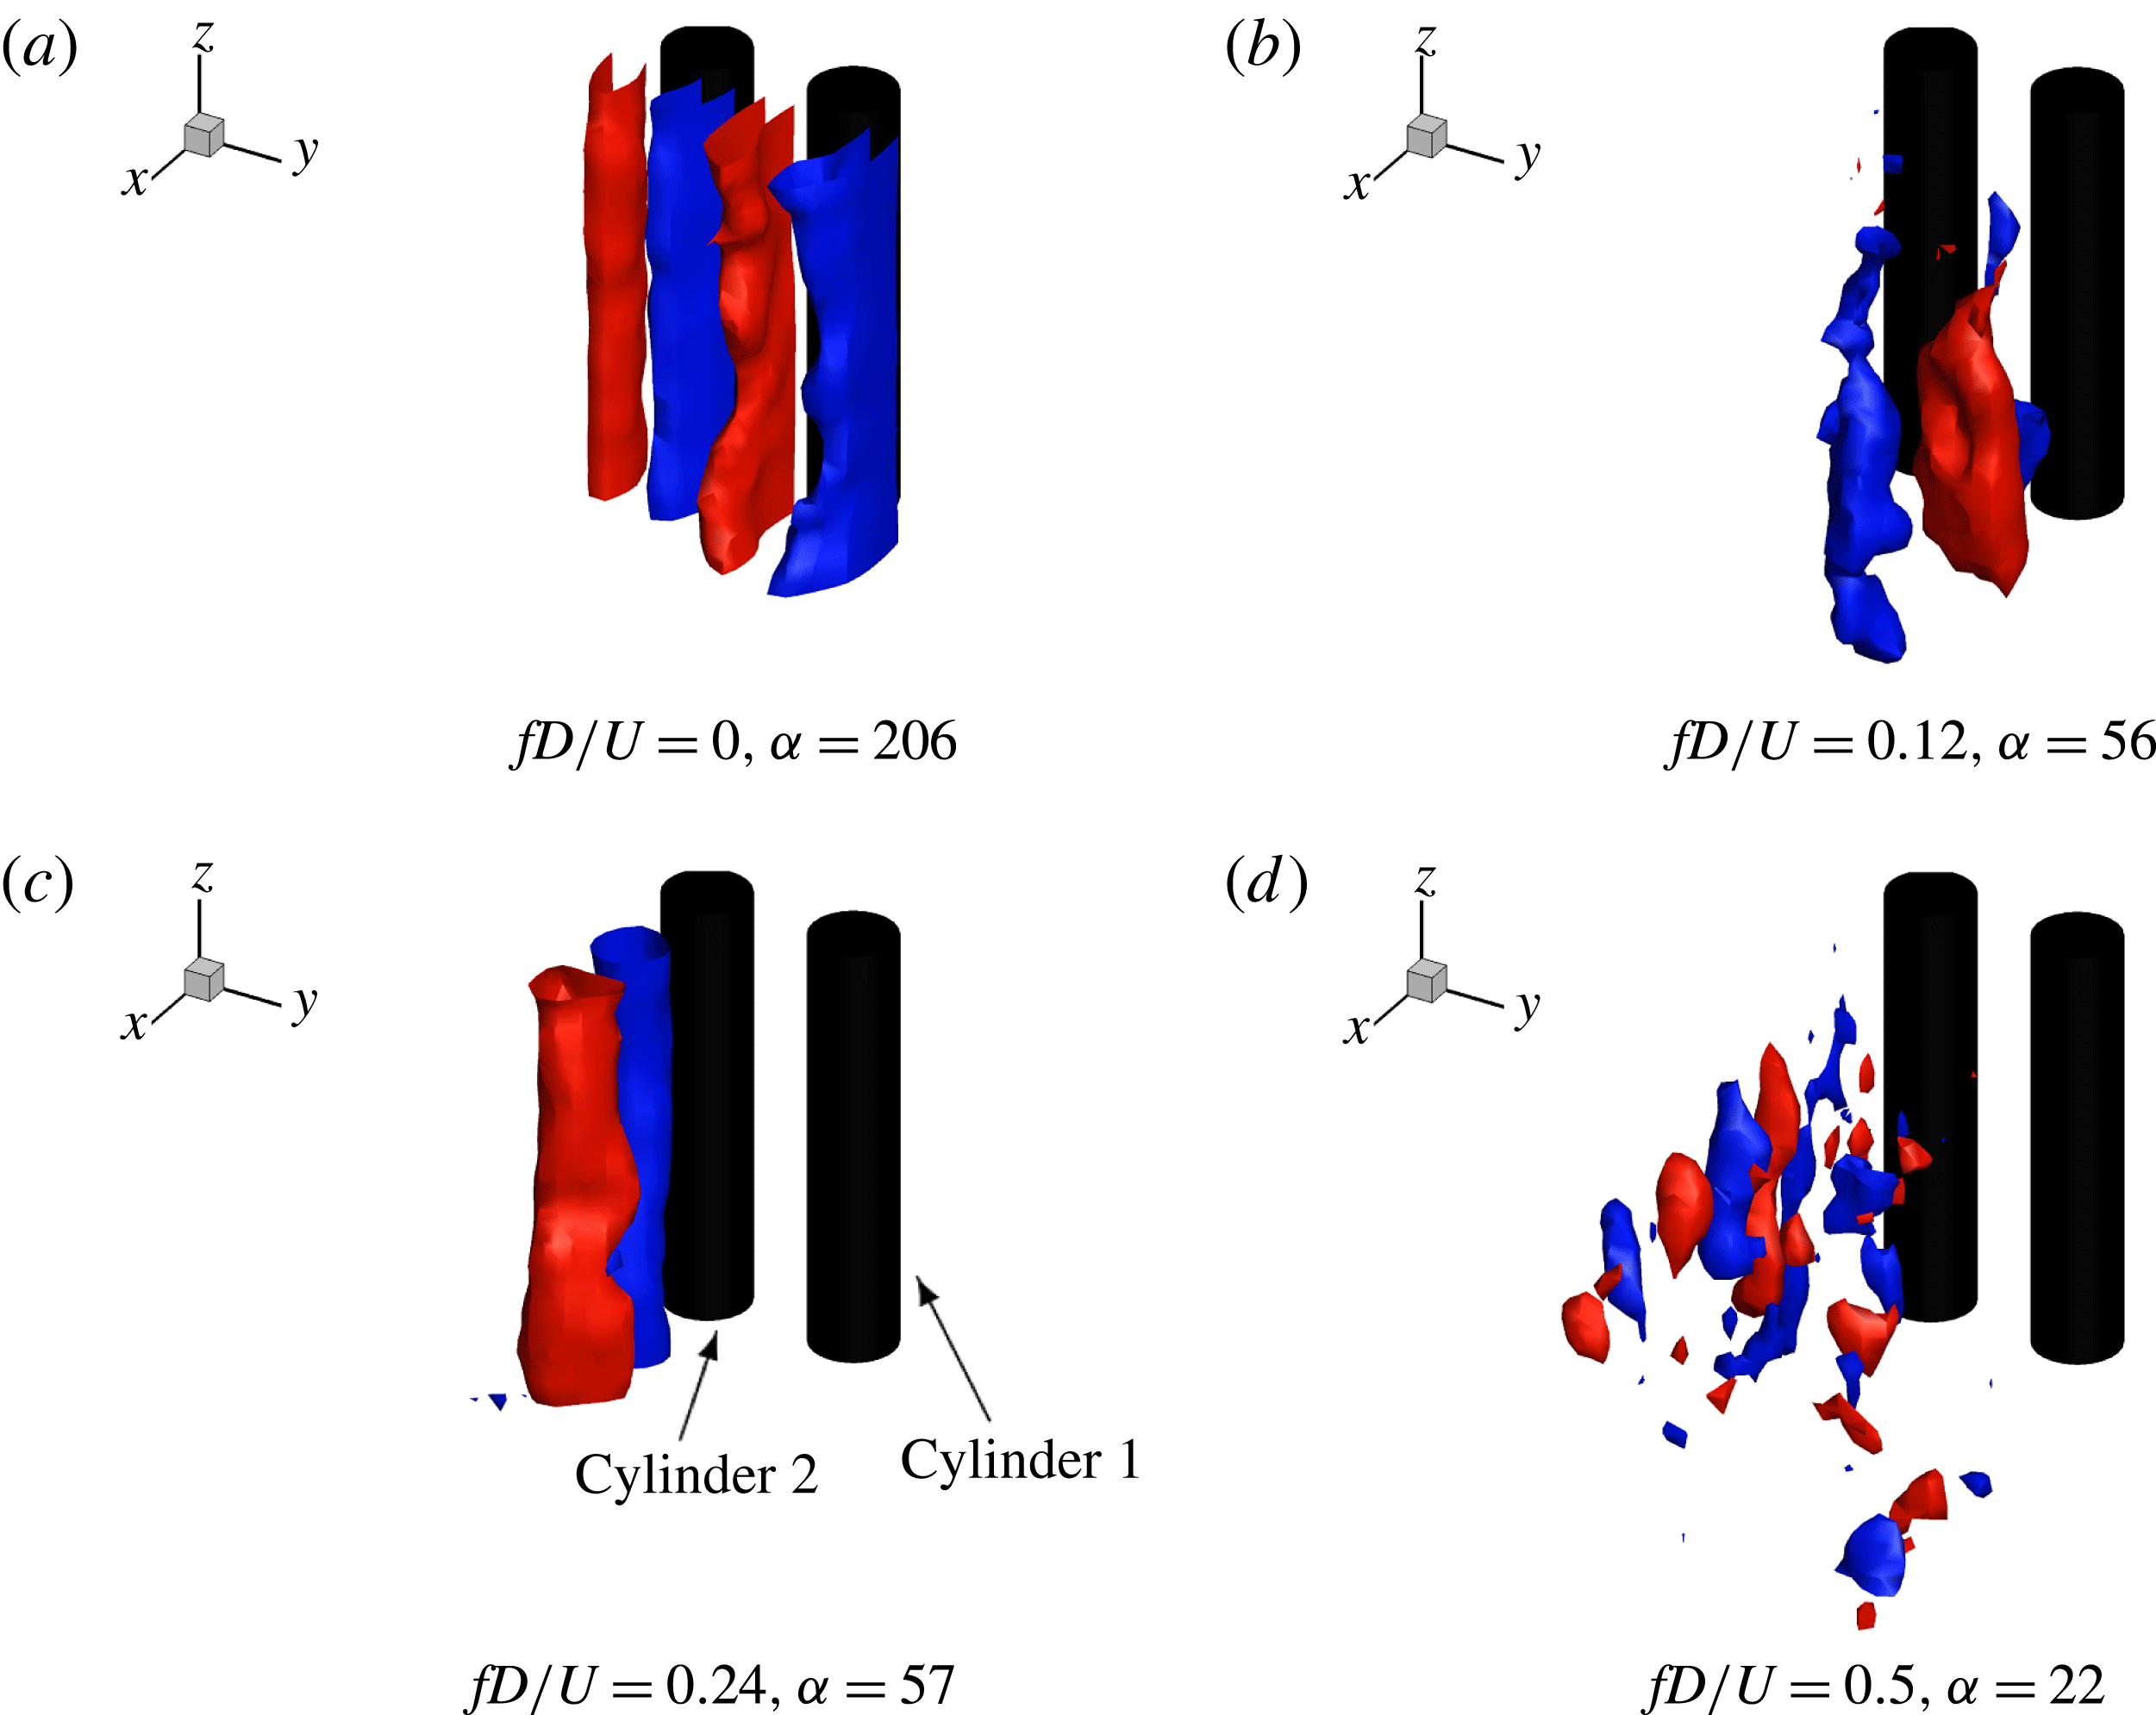
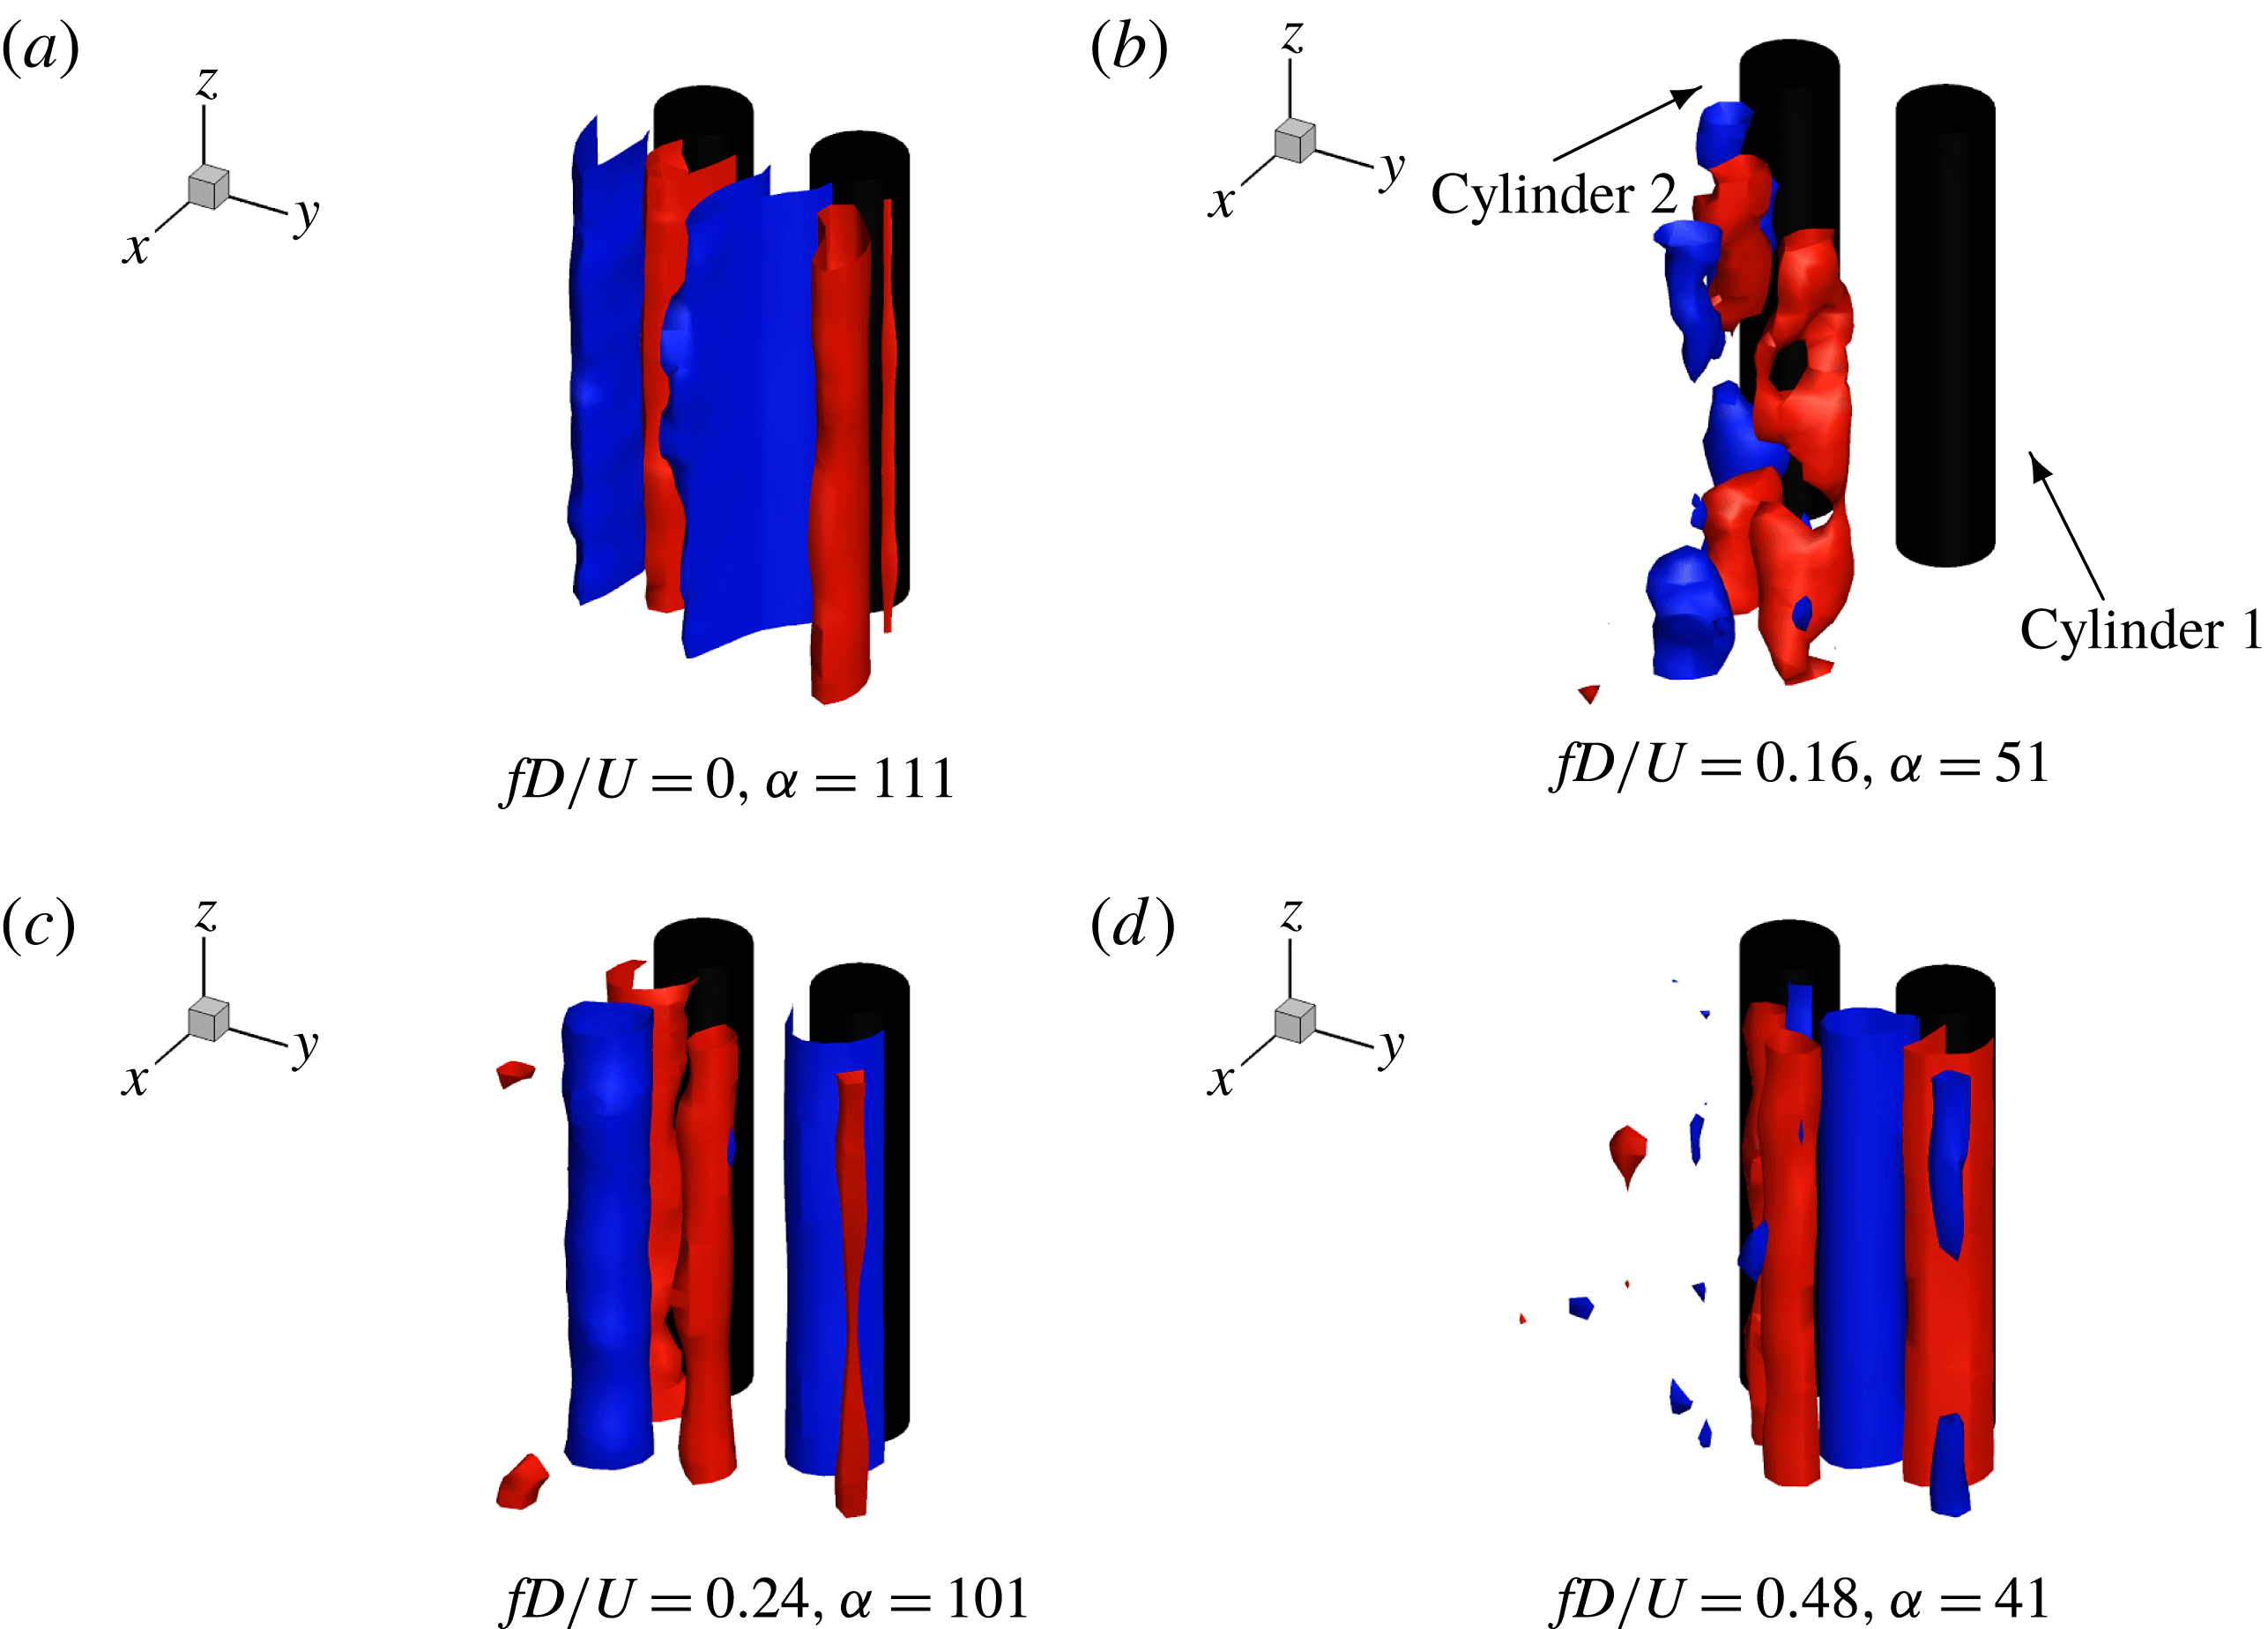
in figure 21 account for the mean flow, the lift and the drag characteristics, respectively. The corresponding DMD modes are visualized in figure 22(a–c), where
 $fD/U$
denotes the dimensionless frequency for a particular DMD mode and
 $f$
represents the vortex–wake frequency in each DMD mode in Hz. The observed DMD mode with
 $fD/U=0$
manifests the mean flow across the cylinder. Furthermore, the DMD mode at
 $fD/U=0.61$
was not observed by Liu & Jaiman (Reference Liu and Jaiman2016) for the 2-D laminar flow condition. By considering the mode in figure 22(b) as a fundamental mode, the mode at
 $fD/U=0.61$
can be treated as a third harmonic mode for the SSBS arrangement, while figure 21 shows relatively concentrated vortex modes at low frequency
 $fD/U\in (0.05,0.2)$
due to the gap-flow proximity interference. Corresponding to different modal frequencies of the lift forces on each cylinder (see figure 23), we extract two vortex modes, at
 $fD/U\approx 0.12$
behind Cylinder 1 and at
 $fD/U\approx 0.24$
for Cylinder 2 within the narrow near-wake region. (The gap flow deflects to Cylinder 2 at
 $tU/D\in (250,350)$
and induces a narrow near-wake region.) The increase in
 $f_{vs}$
is induced by the enhanced vortex-to-vortex interaction in the narrow near-wake region. Furthermore, a similar third harmonic vortex mode is also extracted in this SSBS arrangement, while taking the mean of
 $0.12$
and
 $0.24$
as a normalized modal frequency. The third harmonic vortex mode is represented by an isolated vortex mode at
 $fD/U\approx 0.5$
(crosses) in figure 21 and is highly concentrated in the narrow near-wake region, as depicted in figure 23(d).
Iso-surface plots of
 $\unicode[STIX]{x1D714}_{z}$
modes of stationary cylinder at
 $Re=500$
,
 $tU/D\in [250,350]$
and
 $\unicode[STIX]{x1D714}_{z}=\pm 0.01$
. A strong third-order harmonic vortex mode is decomposed at
 $fD/U\approx 0.61$
.

Iso-surface plots of
 $\unicode[STIX]{x1D714}_{z}$
modes of SSBS arrangement at
 $Re=500$
,
 $g^{\ast }=0.8$
,
 $tU/D\in [250,350]$
and
 $\unicode[STIX]{x1D714}_{z}=\pm 0.01$
. A vortex discontinuity is observed in a wide near-wake region behind the right-hand side cylinder in figure 23(b). A strong third-order harmonic vortex mode is decomposed into a narrow near-wake region behind the left-hand side cylinder in figure 23(d).

Contours of transverse velocity
 $v$
in the
 $(z,x)$
-plane for SSBS arrangement at
 $Re=500$
,
 $g^{\ast }=0.8$
,
 $tU/D=320$
and
 $v=\pm 0.1$
: (a) wide near-wake region of Cylinder 1 at
 $y=0.9D$
, where the gap flow deflects away momentarily, (b) narrow near-wake region of Cylinder 2 at
 $y=-0.9D$
with the gap-flow deflection.

Iso-surface plots of
 $\unicode[STIX]{x1D714}_{z}$
modes of VSBS arrangement at
 $Re=500$
,
 $g^{\ast }=0.8$
,
 $m^{\ast }=10$
,
 $\unicode[STIX]{x1D701}=0.01$
,
 $tU/D\in [250,350]$
and
 $\unicode[STIX]{x1D714}_{z}=\pm 0.01$
. The vortex modes are well distributed at the peak lock-in. A strong low frequency vortex mode is observed in the middle path of the gap flow.

It is known that the third-order harmonic mode is strongly related to the instability of a dynamical system, since it breaks down the equilibrium of the fundamental base mode and distorts the wave forms. These third-order harmonic modes of spanwise vorticity
 $\unicode[STIX]{x1D714}_{z}$
are only observed after the flow transition and are highly concentrated in the region with enhanced three-dimensional flow structures. The footprints of these modal vortex patterns are found to form further away from the cylinders in both the isolated and the SBS configurations. Consistent with the discussion on the recovery of 2-D hydrodynamic responses in § 3, it confirms again that the three-dimensional vortical structures originate from the vortex interactions. In addition, figure 23(b) shows a discontinuous vortex roller mode behind Cylinder 1 with a momentary wide near-wake region. The shedding cell strength is approximately three diameters along the spanwise direction. On the contrary, Cylinder 2 with the narrow near-wake region is followed by a continuous vortex roller mode in figure 23(c) in the same time window. The above observation is confirmed from the contour plots of the
 $y$
-component velocity in figure 24, where a vortex discontinuity is observed behind Cylinder 1 with a wider near-wake region in figure 24(a). The spanwise vorticity
 $\unicode[STIX]{x1D714}_{z}$
cluster of the same sign is dislocated in the streamwise direction and exhibits a discontinuity in
 $f_{vs}$
. Since the spanwise vorticity cluster momentarily or partially deflects away from the wide near-wake region,
 $f_{vs}$
of Cylinder 1 is dynamically varied by the motion of the gap flow and entails a vortex discontinuity.
In the VSBS arrangement,
 $f_{vs}$
for both cylinders are synchronized with the natural frequency
 $f_{n}$
of the locked-in vibrating cylinder. The vortex modes at the same modal frequencies (triangles) in figure 25 are well distributed behind both cylinders. Owing to the recovery of the 2-D hydrodynamic response, the
 $\unicode[STIX]{x1D714}_{z}$
modes in figure 25(c,d) are rather similar to their 2-D counterparts in Liu & Jaiman (Reference Liu and Jaiman2016) at relatively higher modal frequencies. Nonetheless, different from the 2-D laminar flow counterparts, an influential vortex mode at
 $fD/U\approx 0.16$
is observed in the middle path of the gap flow in figure 25(b). The 3-D effect is minimized to the greatest extent along the locked-in vibrating cylinder, thus the 3-D vortical structure is merely coupled with the gap flow and the stationary cylinder. By fast Fourier transform (FFT), we find a resemblance between the frequencies of the spanwise force fluctuation of the stationary cylinder and this modal frequency. By further analysing the position of its vortex pattern, this particular vortex mode is found to originate from the secondary vortex-to-vortex interaction in the gap flow.
7 Conclusions
The dynamics of three-dimensional gap flow and VIV interaction are numerically investigated in side-by-side circular cylinder arrangements at Reynolds numbers in the range
 $100\leqslant Re\leqslant 500$
. A body-conforming Eulerian–Lagrangian technique based on the variational finite-element formulation has been applied for the fluid–structure interaction. We found that the VIV kinematics regulate the streamwise vorticity concentration in the near wake, which results in a significant recovery of two-dimensional responses at the peak lock-in. An indeterminant streamline saddle point was observed to form along the interface between the imbalanced vorticity clusters in the near wake. The saddle-point regions are intrinsically associated with high local strain rates and contribute to the formation of three-dimensional vortical structures. The gap-flow momentum and the interactions between imbalanced vorticity clusters are found to be critical for the near-wake instability.
In both SSBS and VSBS arrangements, the concentration of
 $\unicode[STIX]{x1D709}_{xy}$
was observed to exhibit a strong dependency on the gap-flow proximity interference. We observed a distinctive concentration of
 $\unicode[STIX]{x1D709}_{xy}$
in the narrow and wide near-wake regions for both SSBS and VSBS arrangements. While the narrow near-wake region has a higher
 $\unicode[STIX]{x1D709}_{xy}$
concentration than the wide one for the SSBS arrangements, the narrow near-wake behind the locked-in vibrating cylinder exhibits a lower
 $\unicode[STIX]{x1D709}_{xy}$
concentration for the VSBS configuration. A force modulation was observed by the deflected gap flow in the SSBS arrangements, which caused the amplification of
 $C_{l}^{rms}$
. While an early onset of VIV lock-in was observed for the VSBS arrangements, the flip-flopping was remarkably suppressed for both SSBS and VSBS arrangements at off-lock-in. A quasi-stable deflected gap-flow regime and a recovery of two-dimensionality were reported for the VSBS arrangements at the peak lock-in. By promoting energy transfer and regulating the VIV lock-in, the gap flow was found to exert a strong proximity interference.
Through the modal analysis, the third-order harmonic
 $\unicode[STIX]{x1D714}_{z}$
vorticity modes were dynamically decomposed for the isolated cylinder and the SSBS arrangements. Owing to their odd-order characteristics, the third vortex modes are crucial to the stability of the dynamic fluid–structure system and represent an unstable factor. A vortex discontinuity originating from the gap-flow kinematics was observed using the DMD technique in the wide near-wake region. An additional influential
 $\unicode[STIX]{x1D714}_{z}$
vorticity mode along the middle path of the gap flow in the VSBS arrangement was observed, which was related to the periodic undulation of the spanwise force fluctuation along the cylinder and represented the promoted gap-flow instability.
Overall, it was found that the vortex-to-vortex interaction between the imbalanced counter-signed vorticity clusters plays an important role in the near-wake stability, because of the significant fluid shearing along the vortical interfaces. In general, the intensive fluid shear along the vortical interfaces is associated with the indeterminant streamline saddle-point regions. The saddle-point region is found in all range of Reynolds number and is interlinked with various flow dynamic events, e.g. vortex shedding, flip-flopping and the streamwise vorticity clusters. Furthermore, the near-wake instability is found to be closely interlinked with the gap flow and the VIV kinematics. In particular, as the VIV kinematics increases and stretches the vortices, the vorticity clusters are more separated which weaken the vortex-to-vortex interaction in the near-wake region. As a result, the two-dimensional hydrodynamic responses are significantly restored along the cylinder. On the contrary, the interaction dynamics between the gap-flow proximity interference and the gap-flow instability enhances the vortex-to-vortex interaction. These observations and findings are important in multi-body systems, from both operations and design viewpoints, found in offshore and aeronautical engineering.
Acknowledgements
The authors would like to thank Singapore Maritime Institute grant (SMI-2014-OF-04) for the financial support.
Appendix A. Streamline saddle point and
 $(x,y)$
-plane velocity profile

Here, we present a brief analysis on the streamline saddle point along the
 $(x,y)$
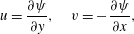
-plane. While the velocity components from the streamfunction
 $\unicode[STIX]{x1D713}(x,y)$
are
 $$\begin{eqnarray}\displaystyle u=\frac{\unicode[STIX]{x2202}\unicode[STIX]{x1D713}}{\unicode[STIX]{x2202}y},\quad v=-\frac{\unicode[STIX]{x2202}\unicode[STIX]{x1D713}}{\unicode[STIX]{x2202}x}, & & \displaystyle\end{eqnarray}$$
the streamline saddle point is given by
 $$\begin{eqnarray}\displaystyle \frac{\unicode[STIX]{x2202}\unicode[STIX]{x1D713}}{\unicode[STIX]{x2202}x}=0;\quad \frac{\unicode[STIX]{x2202}\unicode[STIX]{x1D713}}{\unicode[STIX]{x2202}y}=0;\quad \frac{\unicode[STIX]{x2202}^{2}\unicode[STIX]{x1D713}}{\unicode[STIX]{x2202}x^{2}}\frac{\unicode[STIX]{x2202}^{2}\unicode[STIX]{x1D713}}{\unicode[STIX]{x2202}y^{2}}-\left[\frac{\unicode[STIX]{x2202}^{2}\unicode[STIX]{x1D713}}{\unicode[STIX]{x2202}x\unicode[STIX]{x2202}y}\right]^{2}<0\quad \text{at }(x,y)=(0,0) & & \displaystyle\end{eqnarray}$$
in a two-dimensional incompressible flow far from any boundaries. A fourth-order biquartic polynomial for a
 $\unicode[STIX]{x1D713}(x,y)$
surface patch is employed to approximate the local continuous
 $\unicode[STIX]{x1D713}(x,y)$
field around an SSP (where the fluid shear stresses are linearly approximated in the field). Assuming that the parametric surface of the two-dimensional streamfunction is smooth, continuous and its spatial derivatives are everywhere well-defined up to the highest order of the approximating function, a local flow field can be represented by a general form as follows
 $$\begin{eqnarray}\displaystyle \unicode[STIX]{x1D713}(x,y) & = & \displaystyle a_{0}+a_{1}x+a_{2}y+a_{3}xy+a_{4}x^{2}+a_{5}y^{2}+a_{6}x^{3}+a_{7}x^{2}y+a_{8}xy^{2}+a_{9}y^{3}\nonumber\\ \displaystyle & & \displaystyle +\,a_{10}x^{4}+a_{11}x^{3}y+a_{12}x^{2}y^{2}+a_{13}xy^{3}+a_{14}y^{4}+O(x^{5},y^{5}).\end{eqnarray}$$
Here
 $a_{i}$
(
 $i=0,\ldots ,14$
) are arbitrary scalar constants and
 $O(x^{5},y^{5})$
is the truncation error. Based on the second derivative test for local extreme values, equation (A 3) has to satisfy criterion (A 2) to approximate a (non-degenerated) two-dimensional SSP at (
 $0$
,
 $0$
). This is equivalent to imposing the conditions
 $a_{1}=a_{2}=0$
and
 $4a_{4}\cdot a_{5}<(a_{3})^{2}$
in (A 3), which leads to the following function:
 $$\begin{eqnarray}\displaystyle \unicode[STIX]{x1D713}(x,y) & = & \displaystyle a_{0}+a_{3}xy+a_{4}x^{2}+a_{5}y^{2}+a_{6}x^{3}+a_{7}x^{2}y+a_{8}xy^{2}+a_{9}y^{3}\nonumber\\ \displaystyle & & \displaystyle +\,a_{10}x^{4}+a_{11}x^{3}y+a_{12}x^{2}y^{2}+a_{13}xy^{3}+a_{14}y^{4}+O(x^{5},y^{5}).\end{eqnarray}$$
To investigate the flow field characteristics at the saddle-point region,
 $x=0$
and
 $y=0$
are substituted into the first and second derivatives of (A 4) as follows
 $$\begin{eqnarray}\displaystyle \left.\begin{array}{@{}c@{}}\displaystyle u(0,0)=0;\quad v(0,0)=0,\\ \displaystyle \left.\frac{\unicode[STIX]{x2202}u}{\unicode[STIX]{x2202}y}\right|_{(0,0)}=2a_{5};\quad \left.\frac{\unicode[STIX]{x2202}v}{\unicode[STIX]{x2202}x}\right|_{(0,0)}=-2a_{4},\\ \displaystyle \left.\frac{\unicode[STIX]{x2202}^{2}u}{\unicode[STIX]{x2202}y^{2}}\right|_{(0,y)}=6a_{9}+24a_{14}y;\quad \left.\frac{\unicode[STIX]{x2202}^{2}v}{\unicode[STIX]{x2202}x^{2}}\right|_{(x,0)}=-6a_{6}-24a_{10}x,\\ \displaystyle \left.\frac{\unicode[STIX]{x2202}^{2}u}{\unicode[STIX]{x2202}y^{2}}\right|_{(0,0)}=6a_{9};\quad \left.\frac{\unicode[STIX]{x2202}^{2}v}{\unicode[STIX]{x2202}x^{2}}\right|_{(0,0)}=-6a_{6}.\end{array}\right\} & & \displaystyle\end{eqnarray}$$
By analysing (A 5), it is found that the velocity is zero at the saddle point and generates a local stagnant region. The directional gradients of
 $u$
and
 $v$
are scalar constants at the saddle point. The second-order derivatives of
 $u$
and
 $v$
have a linear relationship with respect to the
 $y$
and
 $x$
variables, respectively. Hence there is a point along
 $y$
and
 $x$
axes respectively across the streamline saddle point, where
 $\unicode[STIX]{x2202}^{2}u/\unicode[STIX]{x2202}y^{2}$
and
 $\unicode[STIX]{x2202}^{2}v/\unicode[STIX]{x2202}x^{2}$
switch their signs. The zero values of
 $\unicode[STIX]{x2202}^{2}u/\unicode[STIX]{x2202}y^{2}$
and
 $\unicode[STIX]{x2202}^{2}v/\unicode[STIX]{x2202}x^{2}$
are the locations of the inflection points of
 $u$
and
 $v$
. As the values of
 $a_{9}$
and
 $a_{6}$
approach zero, the inflection points in the velocity profile translate toward the streamline saddle point. Since the linear odd-order terms in the approximating biquartic polynomial tend to destroy the symmetry of
 $\unicode[STIX]{x1D713}(x,y)$
about the saddle point, the amplification of their coefficient values is detrimental to the formation of the saddle point. Thus, the locations of the velocity profile inflection points are expected to be in the vicinity of the streamline saddle point.
Appendix B. Stability analysis of streamline saddle point
This appendix is concerned with the near-wake instability in the saddle-point region behind the cylinders in the SSBS arrangements. The goal is to investigate the connection between the near-wake stability and its stability parameters e.g. the Reynolds number
 $Re$
, the fluid shear ratio
 $S=U_{1}/U_{2}$
and the gap ratio
 $g^{\ast }$
, using the DMD analysis. Here
 $U_{1}$
and
 $U_{2}$
are respectively
 $x$
-component inlet velocities at the upstream of the gap flow and the free side of cylinders in the SSBS arrangement. The development of the well-known Hopf bifurcation at a low Reynolds number
 $Re\lesssim 100$
is taken as an indication of the near-wake instability. Its direct relationships with
 $Re$
and
 $S$
values are used to analyse the importance of the fluid momentum and the fluid shearing ratio induced by the imbalanced counter-signed vorticity concentration to the near-wake stability. A relatively large
 $g^{\ast }>3.5$
at
 $Re\lesssim 100$
, is considered to eliminate the gap-flow proximity interference. The gap-flow proximity interference with the near-wake stability is subsequently analysed by further reducing
 $g^{\ast }$
. The rest of parameters are identical to the
 $(x,y)$
-section of the three-dimensional computational set-up.
Stability analysis of the wakes around the saddle-point regions behind the cylinders in SSBS arrangements: (a) bifurcation diagram at
 $Re=40$
for
 $v$
versus
 $Re$
and
 $v$
versus
 $S$
, where
 $v$
is an averaged peak value (
 $tU/D\in [300,400]$
) of
 $y$
-component velocity at the location (
 $2D$
,
 $0D$
) behind a cylinder (
 $0D$
,
 $0D$
); (b)
 $|\unicode[STIX]{x1D707}|$
versus
 $Re$
and
 $|\unicode[STIX]{x1D707}|$
versus
 $S$
.

To analyse the dependency of the near-wake instability on the Reynolds number, the DMD mode which accounts for the vortex shedding is identified in the saddle-point region in figure 26(b). At smaller
 $Re$
and
 $S$
, the unstable modes decay as the fluid flow develops, since
 $|\unicode[STIX]{x1D707}|<1$
. Using the DMD technique, the eigenvalue
 $\unicode[STIX]{x1D707}=\unicode[STIX]{x1D707}_{r}+j\unicode[STIX]{x1D707}_{i}$
is extracted from the modal data of
 $\unicode[STIX]{x1D714}_{z}$
, where
 $\unicode[STIX]{x1D707}_{r}$
,
 $\unicode[STIX]{x1D707}_{i}$
and
 $j$
are its real part, imaginary part and imaginary unit respectively. As the values of
 $Re$
and
 $S$
increase, the
 $\unicode[STIX]{x1D714}_{z}$
vorticity mode reaches an equilibrium state
 $|\unicode[STIX]{x1D707}|=1$
. Similar to the stability analysis in Mizushima & Ino (Reference Mizushima and Ino2008), a bifurcation diagram of the
 $y$
-component velocity at (
 $2D$
,
 $0D$
) is plotted in figure 26(a). The relation given in (B 1) is used to identify a Hopf bifurcation, where
 $p_{i}$
and
 $p_{s}$
are the stability parameter and its critical value, respectively. This means that the limit cycle size
 $|v_{+}(p_{i})-v_{-}(p_{i})|$
varies proportionally with respect to the square-root of the difference between the stability parameter
 $p$
and its critical value as follows
 $$\begin{eqnarray}\displaystyle |v_{+}(p_{i})-v_{-}(p_{i})|\propto \sqrt{p_{i}-p_{s}}, & & \displaystyle\end{eqnarray}$$
where
 $v_{+}(p_{i})$
and
 $v_{-}(p_{i})$
are the time-averaged maximum and the minimum of
 $y$
-component velocity
 $v(P_{i})$
at (
 $2D$
,
 $0D$
), respectively. For mathematical convenience, we shift the mean value to the middle of the range
 $|v_{+}(p_{i})-v_{-}(p_{i})|$
, whereby
 $\overline{v}_{+}$
and
 $\overline{v}_{-}$
are introduced as
 $$\begin{eqnarray}\displaystyle \left.\begin{array}{@{}c@{}}\overline{v}_{+}(p_{i})=0.5(v_{+}(p_{i})-v_{-}(p_{i})),\\ \overline{v}_{-}(p_{i})=-0.5(v_{+}(p_{i})-v_{-}(p_{i}))\\ \;\Longrightarrow \;|\overline{v}_{+}(p_{i})-\overline{v}_{-}(p_{i})|=|v_{+}(p_{i})-v_{-}(p_{i})|\propto \sqrt{p_{i}-p_{s}}.\end{array}\right\} & & \displaystyle\end{eqnarray}$$
Using (B 2), the origin of the fluid instabilities in figure 26(a) is identified as due to Hopf bifurcations. Observing figure 26(a,b), the onset of vortex shedding occurs exactly at
 $Re\approx 48$
as the
 $Re$
value increases. Its modal frequency and vortex pattern at the saturated state conform with those of vortex shedding documented in earlier numerical and experimental investigations of a stationary isolated circular cylinder. Similar to the Reynolds number effect, a saturation state of the vortex mode occurs at
 $S\approx 1.33$
.
Bifurcation diagram of
 $v$
with respect to the gap ratio
 $g^{\ast }$
at
 $Re=45$
,
 $g^{\ast }\in [0.1,0.33]$
, where
 $v$
is an averaged peak value (
 $tU/D\in [300,400]$
) of the
 $y$
-component velocity at locations (
 $2D$
,
 $0D$
) behind the cylinder (
 $0D$
,
 $0D$
).

The stability analysis results indicate that the near-wake instability is not only significantly correlated with the fluid momentum, but also the fluid shear ratio. This conclusion agrees with the observation of an earlier flow transition induced by a planar shear flow reported by Lankadasu & Vengadesan (Reference Lankadasu and Vengadesan2008), in which a planar shear was reported with an enhancement effect on the flow transition. Similarly the DMD technique is used to investigate the correlation between the gap ratio
 $g^{\ast }$
and the near-wake stability in the SSBS arrangement. Based on (B 2), the near-wake instability shown in figure 27 is identified as a Hopf bifurcation, which starts to develop as
 $g^{\ast }\lesssim 0.33$
. This means that the gap-flow proximity interference is also critical to the near-wake stability in the SSBS arrangements, as
 $g^{\ast }$
value decreases. To summarize, the fluid shear ratio
 $S$
, the fluid momentum intensity
 $Re$
and the gap-flow proximity interference
 $g^{\ast }$
are significant to the near-wake stability.