




No CrossRef data available.
Article contents
The effect of expression levels on codon usage in Plasmodium falciparum
Published online by Cambridge University Press: 03 March 2004
Abstract
The usage of alternative synonymous codons in the completely sequenced, extremely A+T-rich parasite Plasmodium falciparum was studied. Confirming previous studies obtained with less than 3% of the total genes recently described, we found that A- and U-ending triplets predominate but translational selection increases the frequency of a subset of codons in highly expressed genes. However, some new results come from the analysis of the complete sequence. First, there is more variation in GC3 than previously described; second, the effect of natural selection acting at the level of translation has been analysed with real expression data at 4 different stages and third, we found that highly expressed proteins increment the frequency of energetically less expensive amino acids. The implications of these results are discussed.
Keywords
Information
- Type
- Research Article
- Information
- Copyright
- 2004 Cambridge University Press
INTRODUCTION
Although it could be expected that all triplets coding for the same amino acid should be equally frequent (if a large sample of sequences is studied), it has been known for a long time that this is far from true, both among organisms and among genes from a single species (Grantham et al. 1981). This unequal usage of bases at third codon positions within synonymous codons is the result of different factors. For example, for prokaryotes it is generally accepted that the codon usage of any gene (and consequently, of any genome) is the result of the balance between natural selection (acting mainly at the level of translation) and mutational biases, which can be towards G+C or A+T. Since the direction and strength of these two factors can vary both within and among genomes, different patterns of preferences result among genes from a given genome and among different organisms (for reviews see Sharp & Matassi, 1994; Sharp et al. 1995). Furthermore, it is agreed that the effect of natural selection can be visible only if it is strong enough to overcome the effect of random genetic drift (Sharp & Li, 1986; Bulmer, 1991; Akashi & Eyre-Walker, 1998). The effect of natural selection on translation usually leads to an increment of a subset of major, or preferred codons among highly expressed genes, while sequences expressed at lowest levels display a more random codon usage pattern (for random, we understand a pattern determined mainly by mutational biases). These major codons are recognized, in general, by the cognate tRNAs that are more abundant and/or have perfect Watson-Crick pairing (Kanaya et al. 1999). Several experiments in Escherichia coli have shown that major codons are recognized and translated more quickly and with fewer errors (Andersson & Kurland, 1990; Deana, Ehrlich & Reiss, 1998). Faster rates of elongation allow more efficient use of the protein synthesis machinery in the cell. Moreover, major codons may reduce the energetic costs of proof-reading during protein synthesis and may reduce the probabilities of both missincorporation of amino acids and processivity errors. Therefore, major codons should be more beneficial (and therefore, fixed in the population) in highly expressed genes. In fact, quantitative data for mRNA and protein abundances measured by 2D gel electrophoresis have established correlations between the bias in synonymous codon usage and estimates of the level of translation in different organisms, including E. coli, Saccharomyces cerevisiae, Caenorhabditis elegans, Drosophila melanogaster and Arabidopsis thaliana (Coghlan & Wolfe, 2000; Duret & Mouchiroud, 1999; Akashi, 2001; Ermolaeva, 2001). Furthermore, it has been shown that the optimization of codon usage for heterologous gene expression towards major codons improves levels of gene expression and vice versa (Slimko & Lester, 2003; Carlini & Stephan, 2003). Silent mutations (mutations at synonymous sites) can also affect mRNA stability and protein folding in vivo (Cortazzo et al. 2002; Duan et al. 2003). Hence, the study of gene sequence evolution at synonymous sites helps to the better understanding of the factors shaping molecular evolution and some of the underlying mechanisms governing the regulation of gene expression in different species.
The aim of this paper is to re-examine the pattern of codon usage of the unicellular parasite Plasmodium falciparum, the causative agent of the most virulent form of malaria, and assess the effect of gene expression in this pattern. In 2002 the complete genome of this species was made public (Gardner et al. 2002), together with several genome-wide expression data, available at the Plasmodium genome resource, PlasmoDB (Bahl et al. 2003). Previous studies with only 153 genes (Musto et al. 1999) have shown that genes presumed to be expressed at high levels display an increment of certain codons, suggesting that translational selection is operative in this species. Here we have extended the study to the whole detected ORFs and evaluated the contribution of natural selection on codon usage comparing the actual protein expression patterns in different developmental stages, namely sporozoites, trophozoites, merozoites and gametocytes. Our results confirm that, although the GC content at silent sites is the main source of variation among the genes, natural selection is operative in this species. Furthermore, we show that the incremented codons in highly expressed sequences are almost the same for each stage.
MATERIALS AND METHODS
The coding sequences of P. falciparum (Gardner et al. 2002) and expression data were obtained from PlasmoDB (Bahl et al. 2003). Codon usage, correspondence analysis (COA) (Greenacre, 1984), GC3 (the frequency of codons ending in G or C, excluding Met, Trp and stop codons) and the relative synonymous codon usage (RSCU) (Sharp, Tuohy & Mosurski, 1986) were calculated using the program CodonW 1.3 (written by John Peden and available at http://www.molbiol.ox.ac.uk/cu/). A COA of RSCU values was carried out to determine the major source of variation among genes. With this multivariate statistical approach, the genes are ‘plotted’ in a multidimensional space of 58 axes which correspond to the number of variables studied (in this case, all synonymous codons) minus 1. All the axes are orthogonal and successively account for the maximum of the remainder variation among the genes. The analysis gives the position (coordinate) of each sequence on every axis, and the fraction of the total variability explained by each of them. Subsequently, the position of the genes on the main axes generated by the analysis can be compared with biological properties of the sequences, such as expressivity, base composition etc., which can help to understand the meaning of each main trend. RSCU is the observed frequency of a codon divided by the frequency expected if all synonyms coded for that amino acid are used equally, therefore RSCU values close to 1 indicate a lack of bias for that codon.
RESULTS
As is shown in Table 1, one of the main consequences of the strong mutational bias towards A+T characteristic of this species (Goman et al. 1982; Pollack et al. 1982; McCutchan et al. 1984; Gardner et al. 2002), is that the coding sequences display a biased composition at all codon positions, as shown previously with a much more limited data set (Musto, Rodríguez-Maseda & Bernardi, 1995). As expected, this feature is by far more evident at third codon positions (Hyde & Sims, 1987; Weber, 1987; Saul & Battistutta, 1988; Musto et al. 1997, 1999). This is clearly seen in Table 2, where the global codon usage pattern (RSCU values) for the 5268 ORFs found in P. falciparum (Gardner et al. 2002) is displayed. Indeed, for each amino acid the predominant triplet (or triplets for 3-, 4- and 6-fold degenerate codons) is A- and/or U-ended. Therefore, as previously shown, it can be concluded that the main factor driving codon usage in P. falciparum is the strong compositional constraint towards A and T. Even though this general trend towards these bases is clearly the result of strong compositional constraints, our previous analyses suggested that codon usage in Plasmodium might also be influenced by gene expression levels, since the presumed highly expressed genes displayed a significant increment of several C-ended triplets (Musto et al. 1999). With the complete genome sequence of P. falciparum and genome-wide expression data available (Gardner et al. 2002; Florens et al. 2002), we analysed again the variation in codon usage to assess the influence of gene expression, and hence the effect of translational selection, in the pattern of codon choices of this organism.

Table 2. Codon usage in Plasmodium falciparum (RSCU data) (All represents the codon usage of the whole data set; Tpz, Mrz, Gmt and Spz are the data from the 5% more expressed sequences in trophozoites, merozoites, gametocytes and sporozoites, respectively. Underlined or double underlined are the RSCU values of the triplets significantly incremented (P<0·05 or P<0·01, respectively) in each group in relation to the codon usage of the whole data set. Codons marked with * are incremented in at least 3 different developmental stages, and therefore are considered as translationally optimal. The codons underlined are those proposed as translationally optimal in a previous paper (Musto et al. 1999).)

Our first approach was to compare the biases in codon usage of the most heavily expressed sequences (5%) in 4 different developmental stages (namely trophozoites, merozoites, gametocytes and sporozoites) in relation to the whole data set, and the differences were tested with a Chi2-test. As can be seen in Table 2, several triplets are significantly incremented among the genes encoding the most highly expressed proteins (data taken from Florens et al. 2002). Indeed, if we consider an increment in at least 3 stages, it can be seen that 16 codons (coding for 14 amino acids) are incremented among the highly expressed genes. In other words, only 4 amino acids do not display an incremented triplet: Cys, Asp, Gln and Lys (Met and Trp are coded by only one codon). In accordance to our previous paper (Musto et al. 1999), we postulate that the incremented triplets in at least three different stages are translationally optimal in P. falciparum, and are marked with an asterisk in Table 2. We should stress, however, that our previous conclusion was based mainly on presumed expression levels, while the results presented here are based on experimentally determined data (Florens et al. 2002). Several points concerning these putative optimal codons should be remarked on. First, as reported previously (Musto et al. 1999), for the majority of the pyrimidine-ending 2-fold degenerate triplets, and for Ile and Thr, the incremented codon is C-ending (for the latter amino acids, AUU and ACU are also incremented). The fixation of some C-ending triplets among highly expressed genes, in a genome dominated by a strong mutational bias towards A+T has always been interpreted in terms of the action of natural selection (see, for example, Sharp & Devine, 1989; Musto et al. 1999; Romero, Zavala & Musto, 2000; Musto, Romero & Zavala, 2003). Second, 69% of the incremented codons (11/16) are pyrimidine-ending. Third, no optimal codon is G-ending. Fourth, among the 4-fold degenerate codons, 4 and 5 out of 6 incremented triplets are U- and pyrimidine-ending, respectively. Finally, there is no clear rule for the 6-fold degenerate triplets.
Our second approach was to apply a correspondence analysis (COA) to all the coding sequences (excluding pseudogenes and genes with internal stop codons). This kind of analysis has been widely used to investigate the variation in codon usage patterns (Shields & Sharp, 1987; Alvarez, Robello & Vignali, 1994; Romero et al. 2000; Fernández, Zavala & Musto, 2001). The first analysis was performed on the RSCU values for each gene (excluding Met, Trp, and stop codons), to minimize the effects of amino acid composition. Figure 1A shows the position of the genes on the plane defined by the first (horizontal) and second (vertical) axes, which accounted for 6·2 and 4·9% respectively of the total variation. We found a strong correlation (R=0·59, P<0·0001) between the GC3 levels of each sequence with the position of each gene along the first axis (Fig. 1B). Interestingly, in our previous report (Musto et al. 1999) this correlation was not detected, probably due to the small range of variability in the older dataset, which comprised only 153 genes (7–29%, as opposed to 3–58% when all the coding sequences are considered). A more interesting result was that the second main source of variation (second axis) was related with the expression level of the sequences. Indeed, when the position of the genes along this axis was plotted against the expression level of the identified peptides of each stage (Florens et al. 2002), significant correlations were found for the four stages, and the values were R=0·38, P<0·0001 for trophozoites; R=0·39, P<0·0001 for merozoites; R=0·30, P<0·0001 for gametocytes and finally R=0·34, P<0·0001 for sporozoites. It is important to note that in relation with our previous paper (Musto et al. 1999) these correlations do show (and not only suggest) that highly expressed genes display a different pattern of codon choices in relation to the rest of the sequences, giving experimental support to our previous theoretical conclusion in the sense that translational selection, although weak, is operative in P. falciparum. Furthermore, the abovementioned correlations are always negative (in other words, the most heavily expressed sequences display negative values along the second axis of the COA). This gives independent support to the results of Table 2 in the sense that the translational optimal codons in this species tend to be the same in the four stages analysed.

Fig. 1. The position of each gene along the first axis generated by the COA (calculated on RSCU values) is plotted against the second axis of the same analysis (A) and the respective GC3 (B).
We also conducted a COA in codon counts for each gene, since as has been shown by Perrière & Thioulouse (2001) that the use of relative measures of codon usage when performing a COA may introduce some errors and diminish the quantity of information to analyse. The first axis generated by this study accounted for 18·4% of the total variation. Surprisingly there are strong positive correlations with expression levels at all stages: trophozoites R=0·62, merozoites R=0·59, gametocytes R=0·57, and sporozoites R=0·54; the P value of each correlation being always <0·0001 (Fig. 2). This analysis confirms that gene expression relates to codon usage and also, since we are using simple codon counts, to amino acids composition, at all the developmental stages considered. In this sense, it is interesting to remark that we found slight (but significant) correlations (R values from 0·12 to 0·20, P always <0·0001) between the expression levels at all stages and the energetic cost of each protein (Akashi & Gojobori, 2002), in the sense that the most heavily expressed sequences tend to use ‘cheaper’ residues. Indeed, we found that the highest increment of amino acid frequencies among highly expressed sequences are for Ala (+128%) and Gly (+90%), and these are the less expensive and smaller residues. Furthermore, when we plotted the position of each gene along axis 1 obtained with codon counts with the energetic cost of each encoded protein, we found a correlation of R=0·23, P<0·0001.

Fig. 2. The position of each gene along the first axis generated by the COA (calculated on codon usage numbers) is plotted against the expression levels of proteins for trophozoites (Tpz), merozoites (Mrz), gametocytes (Gmt) and sporozoites (Spz).
DISCUSSION
The strong mutational bias towards A+T that characterizes the genome of P. falciparum has been recognized as the main force driving codon choices (Hyde & Sims, 1987; Weber, 1987; Saul & Battistutta, 1988; Musto et al. 1997, 1999). However, in a previous study (Musto et al. 1999) multivariate statistical analysis detected a trend that discriminated among presumed highly- and lowly-expressed genes, the former group displaying an increment in certain codons, many of which were C-ended. The different pattern of codon usage of both kinds of genes, together with the increment of C at the third codon position, which is against the strong mutational bias, was taken as evidence that translational selection is operative in this parasite. However, this conclusion was reached studying only a small data set (153 sequences) and, more important, highly- and lowly-expressed genes were only presumed, since at that moment experimentally determined expression data were not available. Given the availability of the whole genome (Gardner et al. 2002), together with several genome-wide expression data (Florens et al. 2002), we decided to reanalyse the factors shaping codon usage in this species. In general, the pattern previously described is valid. Indeed, the comparison of codon usage taking into consideration actual expression data in 4 different developmental stages shows that highly expressed sequences do display an increment of certain codons in relation to the whole data set, many of which are C-ended. We should remark that in the previous report 20 codons were postulated as optimal, while now 16 triplets are significantly incremented in at least three stages; however, 100% of these codons were among the previous group of 20 (see Musto et al. 1999). This indicates that if the sample is not biased and genes with different expression levels are available, even in a compositionally biased genome, a multivariate analysis with approximately 3% of the total genes can be enough to get a picture of the factors shaping codon usage.
Two different features related to these 16 codons support our proposal that they are translationally optimal. First, with the exception of GGU (incremented triplet for Gly), there always exists a tRNA that matches perfectly with the incremented codon among the highly expressed proteins. Second, for the pyrimidine-ending 2-fold degenerate codons, the only existing isoacceptor tRNA matches perfectly with the significantly incremented triplet. Furthermore, it is interesting to note that among almost all completed sequenced eukaryotic genomes, P. falciparum is exceptional in the sense of the low redundancy of isoacceptors tRNAs (Gardner et al. 2002), which might explain why the optimal codons are almost the same for the 4 stages studied here (see Table 2). In turn, it is possible to postulate that the biological basis for sharing the preferred codons at all stages, is that when more than one tRNA exists for a given amino acid, the relative concentration of these isoacceptors tRNAs does not change across the biological cycle of the parasite.
Finally, we have shown that highly expressed proteins tend to use energetically less expensive amino acids. This finding might be understood since it is well known, and confirmed by the analysis of the proteome, that this parasite obtains the majority of the amino acids from the host, and therefore the construction of proteins with an incremented proportion of less expensive residues might be an evolutionary advantage, since it can lead to a decrease in the energetic cost for the host to maintain the parasite.
We thank the two anonymous reviewers of this manuscript for their very helpful suggestions, and H. Naya, H. Romero and A. Zavala for their assistance and for valuable comments. This work was supported by award 7094 from ‘Fondo Clemente Estable’, Uruguay.
References
REFERENCES
AKASHI, H. &
EYRE-WALKER, A.
(1998).
Translational selection and molecular evolution.
Current Opinion in Genetics and Development 8, 688–693.CrossRefGoogle Scholar
AKASHI, H. &
GOJOBORI, T.
(2002).
Metabolic efficiency and amino acid composition in the proteomes of Escherichia coli and Bacillus subtilis.
Proceedings of the National Academy of Sciences, USA 99, 3695–3700.CrossRefGoogle Scholar
AKASHI, H.
(2001).
Gene expression and molecular evolution.
Current Opinion in Genetics and Development 11, 660–666.CrossRefGoogle Scholar
ALVAREZ, F.,
ROBELLO, C. &
VIGNALI, M.
(1994).
Evolution of codon usage and base contents in kinetoplastid protozoans.
Molecular Biology and Evolution 11, 790–802.Google Scholar
ANDERSSON, S. G. &
KURLAND, C. G.
(1990).
Codon preferences in free-living microorganisms.
Microbiological Reviews 54, 198–210.Google Scholar
BAHL, A.,
BRUNK, B.,
CRABTREE, J.,
FRAUNHOLZ, M. J.,
GAJRIA, B.,
GRANT, G. R.,
GINSBURG, H.,
GUPTA, D.,
KISSINGER, J. C.,
LABO, P.,
LI, L.,
MAILMAN, M. D.,
MILGRAM, A. J.,
PEARSON, D. S.,
ROOS, D. S.,
SCHUG, J.,
STOECKERT, C. J. jr. &
WHETZEL, P.
(2003).
PlasmoDB: the Plasmodium genome resource. A database integrating experimental and computational data.
Nucleic Acids Research 31, 212–215.Google Scholar
BULMER, M.
(1991).
The selection-mutation-drift theory of synonymous codon usage.
Genetics 129, 897–907.Google Scholar
CARLINI, D. B. &
STEPHAN, W.
(2003).
In vivo introduction of unpreferred synonymous codons into the Drosophila Adh gene results in reduced levels of ADH protein.
Genetics 163, 239–243.Google Scholar
COGHLAN, A. &
WOLFE, K. H.
(2000).
Relationship of codon bias to mRNA concentration and protein length in Saccharomyces cerevisiae.
Yeast 16, 1131–1145.3.0.CO;2-F>CrossRefGoogle Scholar
CORTAZZO, P.,
CERVENANSKY, C.,
MARIN, M.,
REISS, C.,
EHRLICH, R. &
DEANA, A.
(2002).
Silent mutations affect in vivo protein folding in Escherichia coli.
Biochemical and Biophysical Research Communications 293, 537–541.CrossRefGoogle Scholar
DEANA, A.,
EHRLICH, R. &
REISS, C.
(1998).
Silent mutations in the Escherichia coli ompA leader peptide region strongly affect transcription and translation in vivo.
Nucleic Acids Research 26, 4778–4782.CrossRefGoogle Scholar
DUAN, J.,
WAINWRIGHT, M. S.,
COMERON, J. M.,
SAITOU, N.,
SANDERS, A. R.,
GELERNTER, J. &
GEJMAN, P. V.
(2003).
Synonymous mutations in the human dopamine receptor D2 (DRD2) affect mRNA stability and synthesis of the receptor.
Human Molecular Genetics 12, 205–216.CrossRefGoogle Scholar
DURET, L. &
MOUCHIROUD, D.
(1999).
Expression pattern and, surprisingly, gene length shape codon usage in Caenorhabditis, Drosophila, and Arabidopsis.
Proceedings of the National Academy of Sciences, USA 96, 4482–4487.CrossRefGoogle Scholar
ERMOLAEVA, M. D.
(2001).
Synonymous codon usage in bacteria.
Current Issues in Molecular Biology 3, 91–97.Google Scholar
FERNÁNDEZ, V.,
ZAVALA, A. &
MUSTO, H.
(2001).
Evidence for translational selection in codon usage in Echinococcus spp.
Parasitology 123, 203–209.CrossRefGoogle Scholar
FLORENS, L.,
WASHBURN, M. P.,
RAINE, J. D.,
ANTHONY, R. M.,
GRAINGER, M.,
HAYNES, J. D.,
MOCH, J. K.,
MUSTER, N.,
SACCI, J. B.,
TABB, D. L.,
WITNEY, A. A.,
WOLTERS, D.,
WU, Y.,
GARDNER, M. J.,
HOLDER, A. A.,
SINDEN, R. E.,
YATES, J. R. &
CARUCCI, D. J.
(2002).
A proteomic view of the Plasmodium falciparum life cycle.
Nature, London 419, 520–526.CrossRefGoogle Scholar
GARDNER, M. J.,
HALL, N.,
FUNG, E.,
WHITE, O.,
BERRIMAN, M.,
HYMAN, R. W.,
CARLTON, J. M.,
PAIN, A.,
NELSON, K. E.,
BOWMAN, S.,
PAULSEN, I. T.,
JAMES, K.,
EISEN, J. A.,
RUTHERFORD, K.,
SALZBERG, S. L.,
CRAIG, A.,
KYES, S.,
CHAN, M. S.,
NENE, V.,
SHALLOM, S. J.,
SUH, B.,
PETERSON, J.,
ANGIUOLI, S.,
PERTEA, M.,
ALLEN, J.,
SELENGUT, J.,
HAFT, D.,
MATHER, M. W.,
VAIDYA, A. B.,
MARTIN, D. M.,
FAIRLAMB, A. H.,
FRAUNHOLZ, M. J.,
ROOS, D. S.,
RALPH, S. A.,
McFADDEN, G. I.,
CUMMINGS, L. M.,
SUBRAMANIAN, G. M.,
MUNGALL, C.,
VENTER, J. C.,
CARUCCI, D. J.,
HOFFMAN, S. L.,
NEWBOLD, C.,
DAVIS, R. W.,
FRASER, C. M. &
BARRELL, B.
(2002).
Genome sequence of the human malaria parasite Plasmodium falciparum.
Nature, London 419, 498–511.CrossRefGoogle Scholar
GOMAN, M.,
LANGSLEY, G.,
HYDE, J. E.,
YANKOVSKY, N. K.,
ZOLG, J. W. &
SCAIFE, J. G.
(1982).
The establishment of genomic DNA libraries for the human malaria parasite Plasmodium falciparum and identification of individual clones by hybridisation.
Molecular and Biochemical Parasitology 5, 391–400.CrossRefGoogle Scholar
GRANTHAM, R.,
GAUTIER, C.,
GOUY, M.,
JACOBZONE, M. &
MERCIER, R.
(1981).
Codon catalog usage is a genome strategy modulated for gene expressivity.
Nucleic Acids Research 9, r43–r74.CrossRefGoogle Scholar
GREENACRE, M.
(1984).
Theory and Application of Correspondence Analysis. London, Academic Press.
HYDE, J. E. &
SIMS, P. F.
(1987).
Anomalous dinucleotide frequencies in both coding and non-coding regions from the genome of the human malaria parasite Plasmodium falciparum.
Gene 61, 177–187.CrossRefGoogle Scholar
KANAYA, S.,
YAMADA, Y.,
KUDO, Y. &
IKEMURA, T.
(1999).
Studies of codon usage and tRNA genes of 18 unicellular organisms and quantification of Bacillus subtilis tRNAs: gene expression level and species-specific diversity of codon usage based on multivariate analysis. Gene 238, 143–155.CrossRefGoogle Scholar
McCUTCHAN, T. F.,
DAME, J. B.,
MILLER, L. H. &
BARNWELL, J.
(1984).
Evolutionary relatedness of Plasmodium species as determined by the structure of DNA.
Science 225, 808–811.CrossRefGoogle Scholar
MUSTO, H.,
CACCIÒ, S.,
RODRIGUEZ-MASEDA, H. &
BERNARDI, G.
(1997).
Compositional constraints in the extremely GC-poor genome of Plasmodium falciparum.
Memorias do Instituto Oswaldo Cruz 92, 835–841.CrossRefGoogle Scholar
MUSTO, H.,
ROMERO, H.,
ZAVALA, A.,
JABBARI, K. &
BERNARDI, G.
(1999).
Synonymous codon choices in the extremely GC-poor genome of Plasmodium falciparum: compositional constraints and translational selection.
Journal of Molecular Evolution 49, 27–35.CrossRefGoogle Scholar
MUSTO, H.,
RODRIGUEZ-MASEDA, H. &
BERNARDI, G.
(1995).
Compositional properties of nuclear genes from Plasmodium falciparum.
Gene 152, 127–132.CrossRefGoogle Scholar
MUSTO, H.,
ROMERO, H. &
ZAVALA, A.
(2003).
Translational selection is operative for synonymous codon usage in Clostridium perfringens and Clostridium acetobutylicum.
Microbiology 149, 855–863.CrossRefGoogle Scholar
PERRIÈRE, G. &
THIOULOUSE, J.
(2001).
Use and misuse of correspondence analysis in codon usage studies.
Nucleic Acids Research 30, 4548–4555.Google Scholar
POLLACK, Y.,
KATZEN, A. L.,
SPIRA, D. T. &
GOLENSER, J.
(1982).
The genome of Plasmodium falciparum. I: DNA base composition.
Nucleic Acids Research 10, 539–546.Google Scholar
ROMERO, H.,
ZAVALA, A. &
MUSTO, H.
(2000).
Compositional pressure and translational selection determine codon usage in the extremely GC-poor unicellular eukaryote Entamoeba histolytica.
Gene 242, 307–311.CrossRefGoogle Scholar
SAUL, A. &
BATTISTUTTA, D.
(1988).
Codon usage in Plasmodium falciparum.
Molecular and Biochemical Parasitology 27, 35–42.CrossRefGoogle Scholar
SHARP, P. M. &
DEVINE, K. M.
(1989).
Codon usage and gene expression level in Dictyostelium discoideum: highly expressed genes do ‘prefer’ optimal codons.
Nucleic Acids Research 17, 5029–5039.CrossRefGoogle Scholar
SHARP, P. M. &
LI, W. H.
(1986).
An evolutionary perspective on synonymous codon usage in unicellular organisms.
Journal of Molecular Evolution 24, 28–38.CrossRefGoogle Scholar
SHARP, P. M. &
MATASSI, G.
(1994).
Codon usage and genome evolution.
Current Opinion in Genetics and Development 4, 851–860.CrossRefGoogle Scholar
SHARP, P. M.,
TUOHY, T. M. &
MOSURSKI, K. R.
(1986).
Codon usage in yeast: cluster analysis clearly differentiates highly and lowly expressed genes.
Nucleic Acids Research 14, 5125–5143.CrossRefGoogle Scholar
SHARP, P. M.,
AVEROF, M.,
LLOYD, A. T.,
MATASSI, G. &
PEDEN, J. F.
(1995).
DNA sequence evolution: the sounds of silence.
Philosophical Transactions of the Royal Society of London, B 349, 241–247.CrossRefGoogle Scholar
SHIELDS, D. C. &
SHARP, P. M.
(1987).
Synonymous codon usage in Bacillus subtilis reflects both translational selection and mutational biases.
Nucleic Acids Research 15, 8023–8040.CrossRefGoogle Scholar
SLIMKO, E. M. &
LESTER, H. A.
(2003).
Codon optimization of Caenorhabditis elegans GluCl ion channel genes for mammalian cells dramatically improves expression levels.
Journal of Neuroscience Methods 124, 75–81.CrossRefGoogle Scholar
WEBER, J. L.
(1987).
Analysis of sequences from the extremely A+T-rich genome of Plasmodium falciparum.
Gene 52, 103–109.CrossRefGoogle Scholar
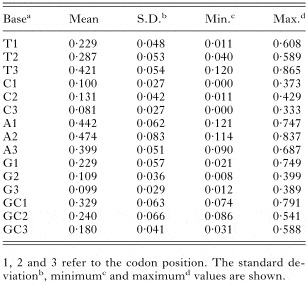
Table 1. Base frequencies in Plasmodium falciparum discriminated by codon position
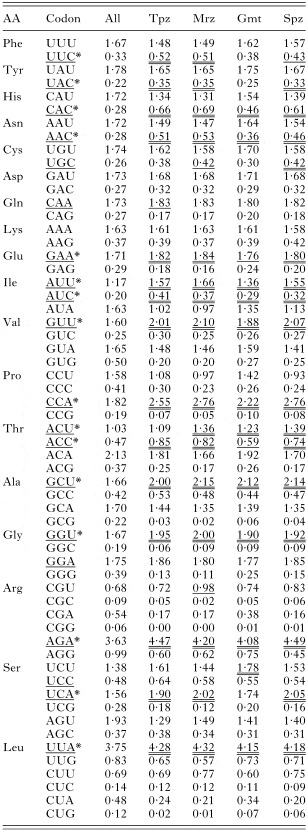
Table 2. Codon usage in Plasmodium falciparum (RSCU data)

Fig. 1. The position of each gene along the first axis generated by the COA (calculated on RSCU values) is plotted against the second axis of the same analysis (A) and the respective GC3 (B).

Fig. 2. The position of each gene along the first axis generated by the COA (calculated on codon usage numbers) is plotted against the expression levels of proteins for trophozoites (Tpz), merozoites (Mrz), gametocytes (Gmt) and sporozoites (Spz).
 You have
Access
- 31
- Cited by