

Estuaries typically support high densities of resident and transient fish (Haedrich, Reference Haedrich and Ketchum1983). Estuarine fish populations are often monitored to assess environmental quality (Elliott et al., Reference Elliott, Griffiths and Taylor1988) and to examine trends in abundance of indicator species (e.g. Greenwood et al., Reference Greenwood, Hill and McLusky2002). Long-term, continuous monitoring is preferred, but sampling programmes are costly and ensuring consistency over time is challenging. Useful information on major changes in estuarine fish assemblages can be obtained by comparing contemporary and historic data, even if individual collection periods are short (Pombo et al., Reference Pombo, Elliott and Rebelo2002; O'Connell et al., Reference O'Connell, Cashner and Schieble2004). We used unpublished data collected at the cooling-water intake screens of two nearby power stations to examine changes in fish-assemblage composition over nearly four decades in the Forth Estuary, Scotland. This means of sampling small-bodied estuarine fish is efficient; collects benthic, demersal, and pelagic species (Henderson, Reference Henderson1989; Maes et al., Reference Maes, Ollevier, Pas, Taillieu and Van Damme2001); and has been used to provide samples for autecological studies (e.g. Turnpenny et al., Reference Turnpenny, Bamber and Henderson1981; Maitland et al., Reference Maitland, Morris, East, Van der Wal and Potter1984; Claridge et al., Reference Claridge, Hardisty, Potter and Williams1985; Maes & Ollevier, Reference Maes and Ollevier2002).
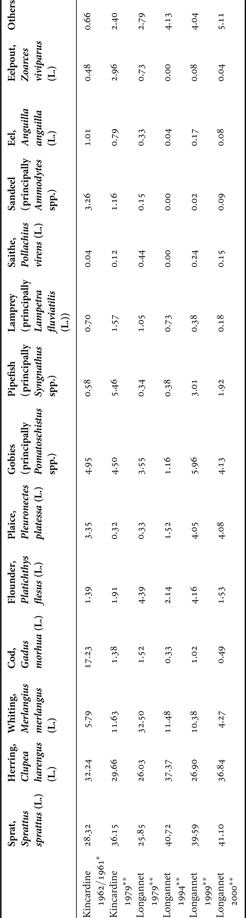
The earliest data included in this study were recorded from November 1961 to November 1962 at the intake screens of Kincardine Power Station (56°4′11″N 3°43′38″W) and reported by D.P. Sharman (Department of Agriculture and Fisheries for Scotland, Marine Laboratory, Aberdeen, unpublished report). Sub-samples of weekly 24-h screen catches were identified and estimates of total monthly catches were made for thirteen named taxa (Table 1) and all taxa together. We calculated the abundance of unnamed (‘other’) taxa by subtracting the sum of the named taxa from the total abundance; this occasionally gave negative values and we assumed that catches of other taxa were negligible in these months (which we have also observed from our own data). Further collections at Kincardine were made twice per month from January to December 1979 by one of us (P.S.M.). On each occasion, collections of 20-min duration were made. This procedure was also followed at Longannet Power Station (56°2′45″N 3°41′0″W; about 4 km downstream of Kincardine) in 1979 and again in 1994 (both by P.S.M.). Data were collected at Longannet from January 1999 to December 2000 (by M.F.D.G.) and generally consisted of eight 30-min samples per month. Although sampling in 1999–2000 was both diurnal and nocturnal, there was little difference in assemblages between day and night, so all data were included. Kincardine began operating at part-load in 1958 (120 MW), operated at 360 MW during the Sharman study and at 760 MW from the end of 1963 until the cessation of operations in 1986. Longannet was commissioned in 1972, fully operational by 1973, and is scheduled to operate beyond 2020. Salinity at both Kincardine and Longannet tends to be polyhaline (Elliott et al., Reference Elliott, O'Reilly and Taylor1990; Greenwood, Reference Greenwood2002). One other power station, Cockenzie, operates in the general area but is actually outside the estuary in the fully marine conditions of the Firth of Forth so that comparisons were not deemed worthy of inclusion in this study.
Mean monthly percentage contribution of fish to total assemblages collected at the cooling-water intake screens of Kincardine and Longannet power stations.

*, November 1961–November 1962; **, January–December.
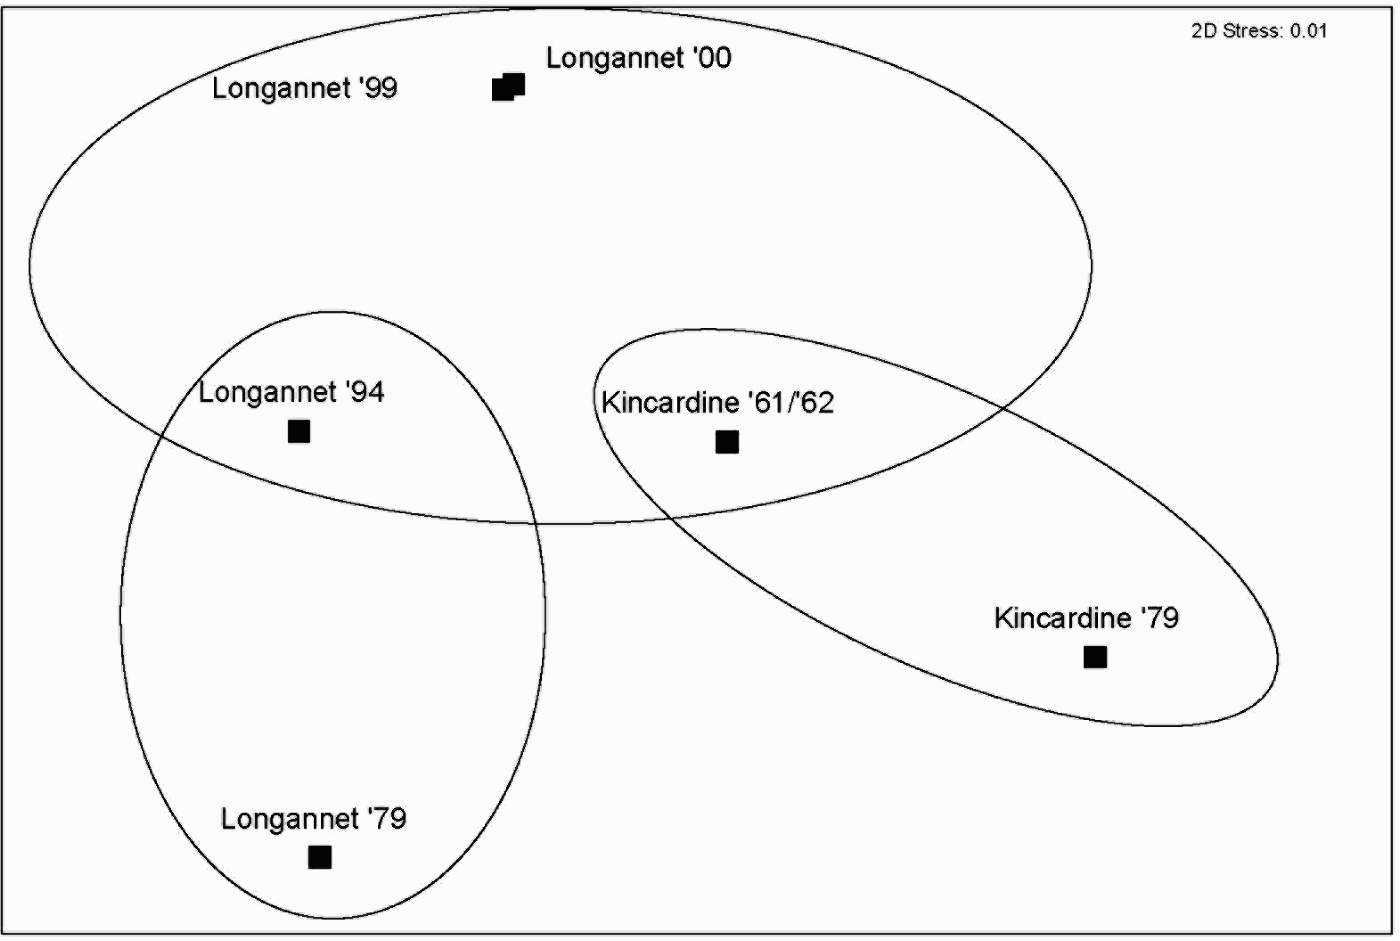
To maintain consistency with Sharman's early data, we grouped our data into the same taxa (Table 1) and summed all collections by month. It was not possible to use abundance data directly because water volumes filtered during each sampling session were not always recorded. Instead, we calculated each taxon's percentage contribution to total monthly abundance. Each month was assigned to quarters (January–March, April–June, etc.) and Bray–Curtis similarity between all pairs of samples (N = 73 total monthly samples) was calculated on square-root-transformed data (Bray & Curtis, Reference Bray and Curtis1957). We tested the null hypothesis of no significant difference in assemblage composition between the six station-periods (Kincardine 1961–1962, Kincardine 1979, Longannet 1979, Longannet 1994, Longannet 1999, and Longannet 2000), allowing for differences between seasons, using a two-way analysis of similarities (ANOSIM; Clarke, Reference Clarke1993) with station-period and season as factors. The pairwise differences in ANOSIM R were plotted using non-metric multidimensional scaling (nMDS; Clarke, Reference Clarke1993). Taxa responsible for differences between locations and periods were determined with a two-way similarity percentages analysis (SIMPER; Clarke & Gorley, Reference Clarke and Gorley2006), again with station-period and season as factors.
Our results indicated significant differences in intake-screen fish-assemblage composition (ANOSIM global R = 0.461, P = 0.001) between station-periods (Figure 1). Multiple comparison tests revealed that significant differences (P < 0.0033, the Bonferroni-corrected significance value) were between Longannet 1979 and all other station-periods (except Longannet 1994) and between Kincardine 1979 and all other station-periods (except Kincardine 1961/1962). There were no significant differences in screen-catch composition between any of the other years and the difference between Longannet 1999 and Longannet 2000 was particularly small (R = 0.127, P = 0.211). The SIMPER analyses revealed that the screen-catch composition in Longannet 1979 was generally different from the other station-periods because of the relatively high contribution by whiting and relatively low contributions by sprat, gobies, plaice, and pipefish (Table 1). The screen-catch composition from Kincardine 1979 mostly differed from the other station-periods because of the relatively high contributions by pipefish, eelpout, lamprey, and sandeels; and because of the relatively low contributions by others, flounder, and plaice.
Differences in fish-assemblage composition from the cooling-water-intake screens of Kincardine and Longannet power stations, with sampling years indicated. Distances on the plot represent the magnitudes of differences in fish assemblages from analysis of similarities and ellipses enclose station-periods that were not significantly different.

The patterns that we observed may reflect long-term local and broad-scale influences on the Forth Estuary fish assemblage. Smelt (Osmerus eperlanus (L.)), were present in the Forth Estuary in the early 1960s (as reflected in Sharman's species list and records of fishery landings; Howard et al., Reference Howard, McKay and Newton1987) but were extirpated by overfishing, siltation, and low dissolved oxygen (none were collected in 1979; P.S.M., unpublished data). Improvements in water quality attributable to commissioning of secondary sewage treatment facilities (Balls et al., Reference Balls, Brockie, Dobson and Johnston1996) led to the species first being detected in upper Forth Estuary trawling in 1989 (Costello et al., Reference Costello, Elliott, Thiel, Elliott and Hemingway2002). A similar resurgence in the species was noted in the Medway Estuary following enhancement of water quality (Wharfe et al., Reference Wharfe, Wilson and Dines1984). The species was the sixth-ranked in abundance at Longannet in 1999–2000 and the principal contributor to the ‘others’ category in this study, reflecting a major difference in assemblages between 1979 and the 1990s. In contrast, chronic warming of the Forth Estuary due to climate change has apparently led to the decline of eelpout, a species close to the southern edge of its geographic range, which was again reflected in power-station intake catches. Greenwood et al. (Reference Greenwood, Hill and McLusky2002) calculated that the species could be extinct in the Forth Estuary by about 2020. Climate change has induced northward shifts in a range of a number of North Sea fish (Perry et al., Reference Perry, Low, Ellis and Reynolds2005) and has led to notable changes in fish-assemblage composition in the Severn Estuary, as shown from intake-screen data at Hinkley Point B Power Station (Henderson, Reference Henderson2007). The early 1960s marked the onset of the ‘gadoid outburst’, a period lasting until the mid-1980s during which gadoids, in particular cod, were abundant (Beaugrand et al., Reference Beaugrand, Brander, Lindley, Souissi and Reid2003). The effects of overfishing and increasing water temperature on larval cod's planktonic prey has led to reduced survival (Beaugrand et al., Reference Beaugrand, Brander, Lindley, Souissi and Reid2003). Data from this study indicated a marked decrease in the contribution of cod to intake screen catches at Kincardine from 1961 to 1979 (Table 1). There was a significant decline in whiting abundance in the Forth Estuary from 1982 to 2001 (Greenwood et al., Reference Greenwood, Hill and McLusky2002) and this was reflected in the decrease in percentage contribution at Longannet from 1979 to 1994 and 1999/2000 (Table 1). In conclusion, the multi-decadal snapshots of fish assemblage structure of the Forth Estuary provide an interesting view of biological responses to changing environmental conditions. The assemblages from the late 1970s were most different from contemporary assemblages.