


1 Introduction
The aim of this Element is the analysis of newly or recently emerged grammatical and lexical forms in Colloquial Singapore English (CSE). The variety in question, occasionally subsumed (locally and globally) under the moniker ‘Singlish’, has been described as a high-contact L1 variety of English (Kortmann, Lunkenheimer, & Ehret Reference Kortmann, Lunkenheimer and Ehret2020) and as being in the late stages of endonormative stabilisation (Schneider Reference Schneider2007). In Singapore, the source contact languages continue to be used alongside CSE, with widespread bi- and multilingualism, which makes for a dynamic setting with continuous cross-influence between the languages involved. Innovative uses resulting from contact can be observed in apparent and real time. In this volume, we use a range of sources to look at recent changes in the lexicon and grammar of CSE, pointing to a complex dynamic variety that is difficult to fully capture with existing models of variation based on founder effects (Mufwene Reference Mufwene1996), substrate transfer (Mufwene Reference Mufwene1990; Siegel Reference Siegel1999), and even more diachronic approaches (Schneider Reference Schneider2007). In this first section, we begin with a short introduction to Singapore and its linguistic ecology. This is followed in Section 2 by a presentation of CoSEM, the Corpus of Singapore English Messages (https://github.com/wdwgonzales/CoSEM), which is the dataset on which our analyses are primarily based. Section 3 reports the results of a sociolinguistic survey examining, among other things, the usage of three innovative features in CSE – namely, clause-initial is it, adverbial confirm, and the sentence-final particle (SFP) sia – across age, gender, and ethnicity. The findings complement previous corpus-based findings and highlight age as the most reliable predictor of self-reported usage, while gender and ethnicity show limited effects. Section 4 presents a close-up study of the lexical item (bo)jio, a relatively recent innovation in CSE of Hokkien origin and with the surface translation ‘neg invite’. We show how the alternation between (bo)jio and its English counterpart is conditioned, as well as the extent to which it has been subjected to morphological integration into CSE. Section 5 considers grammatical change, with a case study of passive constructions (both CSE and standardised English counterparts), following up on Bao and Wee’s (Reference Bao and Wee1999) discussion of CSE kena and give passives. Unlike the Malay-influenced kena passive, the data suggest that the Chinese-influenced give passive has now fallen out of popular use, at least among younger CSE speakers. At the same time, we document the emergence of a novel tio passive, also derived from Chinese (more specifically, from Southern Min), in the same population.
1.1 Background: Singapore
The city-state of Singapore is characterised by a high degree of diversity, ethnically, culturally, and linguistically. This is in no small part due to its advantageous geographical location at the southern tip of the Malay Peninsula, just at the south-eastern entrance to the Straits of Malacca. Already in pre-colonial times, the island on which the current city stands enjoyed its strategic situation at the crossroads of several local, regional, and global maritime trade routes, attracting the attention of several of the empires of the region (Kwa et al. Reference Kwa, Heng, Borschberg and Tan2019; Baker Reference Baker2020). The settlement at the mouth of the Singapore River served as a trading and political centre of varying size and importance in the centuries leading up to the British landing of 1819. It is under the rule of the East India Company and, later, of the Empire, that modern Singapore saw the beginning of an economic and social development that shaped its affluent present (see e.g., Wong Reference Wong1978). The natural deep-sea harbour was expanded by the British into a major stop on the trade route from China, via India, onto Europe (eventually via the Suez Canal), and the tariff-free port city quickly developed into a prized destination for merchants and workers in search of a better life (Baker Reference Baker2020: chap. 5).
The history of migration into Singapore has been described widely (see inter alia Turnbull Reference Turnbull1989; Gupta Reference Gupta1994; Bao Reference Bao, Siemund and Leimgruber2021; Leimgruber Reference Leimgruber, Hickey and Burridge2026). Apart from the indigenous Malay population that lived on the island and in the surrounding archipelago, Chinese traders settled in what is now Singapore well before the arrival of the British. The latter brought with them, early on, colonial subjects from India for various administrative and military duties. Famines and instability in southern China in the nineteenth and early twentieth century led to a large number of migrants primarily from Fujian, Guangdong, and Hainan leaving for Singapore; by 1836 the Chinese were the majority ethnic group (Starr & Hiramoto Reference Hiramoto2019: 5; Hafiz Reference Hafiz2025: 3). These Chinese brought with them their languages, mostly Southern Min (Hokkien, Teochew, and Hainanese) and Cantonese. When the territory became a Crown Colony in 1867, the local education system in English and other languages was further consolidated. By the end of the nineteenth century, the population’s ethnic distribution of ca. 75 per cent Chinese, 15 per cent Malays, 8 per cent Indians, and 2 per cent ‘Others’ (1911 census, see Leimgruber Reference Leimgruber, Hickey and Burridge2026: 234) had been achieved, which would not change until the present day by more than a few percentage points (Pak & Hiramoto Reference Pak and Hiramoto2023).
The British military defeat against the Japanese in 1942 ushered in a brutal three years of occupation, which had few linguistic consequences but did its part to stoke anti-colonial sentiment in the years following the war (Turnbull Reference Turnbull1989: 209; Matsuoka Reference Matsuoka and Hashimoto2018; Huff & Huff Reference Huff and Huff2020). The first Legislative Assembly was elected in 1955, and self-government was granted four years later. In 1963, Singapore became independent from Britain by merging with Peninsular Malaya, Sabah, and Sarawak into the Federation of Malaysia and becoming one of its fourteen states. This short-lived solution came to an end in 1965, when Singapore became independent from the Federation and became the independent nation-state it is today (Hafiz Reference Hafiz2025: 3). Economic policies of global market integration and a focus on education, high technology, and high added-value services were combined with nation-building efforts of a social, cultural, and linguistic nature to ensure the survival of this small city-state.
1.2 Background: Linguistic Ecology
The migrations described in Section 1.1 resulted in a highly linguistically diverse population. At least four language families have been present in significant numbers since the early days of Singapore: Austronesian, Sino-Tibetan, Dravidian, and Indo-European. Austronesian is the autochthonous language family and includes Malay and its related varieties in the region, such as Javanese, Boyanese, and several others. These predate the colonial presence, and the Malay language is, in fact, legislated as the national language of the country, in addition to its co-official status (Hafiz Reference Hafiz2025: 5). Malay – or more precisely, the variety now known as Bazaar Malay – was once the lingua franca of Singapore given its status as a trade port part of the larger Malay Archipelago (Bao & Aye Reference Bao and Aye2010). Malay was said to be used for communication between various communities in Singapore (Aye Reference Aye2005), in ‘non-formal areas of discourse in particular as the language of inter-ethnic communication’ (Tham Reference Tham1996: 1). Singaporean languages from the Sinitic branch of Sino-Tibetan include the Southern Min varieties Hokkien, Teochew, and Hainanese, as well as several varieties of Yue (Cantonese). Mandarin, one of the co-official languages, and nowadays the second most widely used language after English, was not brought into Singapore by migrants, but was rather imposed by language policy on the Sinophone majority as an intra-ethnic lingua franca, thereby serving a unifying function as well as helping to reduce diversity to a manageable number of officially endorsed languages (see Wong & Tan Reference Wong and Tan2017; Lim, Chen & Hiramoto Reference Lim, Chen and Hiramoto2021). Statistics from census data report a dramatic shift towards Mandarin as a dominant home language among the Chinese population, with the co-official language rising from close to 0 per cent in 1957 to over a third of households in 2010. Proficiency in non-Mandarin varieties of Chinese is, nowadays, rare among the under-50s: census data indicates that they are used as ‘most or second most frequent home language’ by just 2.4 per cent of that age group (Department of Statistics Singapore 2020). The third language family, Dravidian, includes the co-official language Tamil, Malayalam, and other southern South Asian languages. Additional South Asian languages belonging to the Indo-European family are also represented in Singapore, such as Hindi and Gujarati. Last (but certainly not least), the Indo-European family includes the co-official language English, which is now (according to 2020 census data) the most widely used home language.
The English language in Singapore has benefitted from strong institutional support, also (and perhaps even more so) in post-colonial times. It is one of the four co-official languages but has the additional non-statutory status of the country’s ‘working language’. In short, it is the language in which institutions of the state work and function, the medium of education in all (since 1987) state schools, the official language of the conscription-based armed forces, and the dominant language of the white-collar workplace. Most tellingly, despite legislation elevating English above the other official languages, all legislative texts are in English, as it is the language of judicial (and generally governmental) records. Proficiency in the language has long been a marker of social class, adding to its attraction in a culturally competitive educational landscape. The fact that English is itself not only a school subject but also the medium of instruction of all other subjects (excluding the ‘mother tongue’ subject) further puts pressure on Singaporeans to add it to their repertoires. Census data since the mid twentieth century show that there has been a steady increase in the percentage of Singaporeans who report predominantly using English as their home language, reaching 48 per cent of households in 2020. The rest use Mandarin (30%), Malay (9%), other Chinese varieties (9%), Tamil (3%), and other languages (1.4%) (Department of Statistics Singapore 2020).
Given the diversity mentioned earlier, it is not surprising that multilingualism is the norm rather than the exception in Singapore. This is true both in terms of dominant home language, for which 81 per cent responded using more than one language at home, and in terms of literacy, for which 74 per cent of the literate population reported literacy in two or more languages (Department of Statistics Singapore 2020). Most of this multilingualism is actually bilingualism in English and one of the other three official languages (65%), in line with governmental language policy, and confirmed by sociolinguistic studies (Leimgruber, Siemund, & Terassa Reference Leimgruber, Siemund and Terassa2018). Such a linguistic ecology, in which the languages involved in the contact situation during the foundational period (cf. Schneider Reference Schneider2007) are in continued, sustained contact with English, and taught, learnt, and spoken to a considerable degree side by side with English, results in a situation in which constant admixture and transfer are possible in both directions. As such, we have here a dynamic contact setting in which contact-induced changes are continuously likely, meaning that today’s CSE may be quite different from the one spoken a generation ago or so. This is a question that we will actively engage with in Section 3.
1.3 Colloquial Singapore English
Our recurrent and main argument in this Element is that the vernacular form of English used in Singapore (often called ‘Singlish’ locally; we will use herein the term CSE) is constantly exposed to influence from the languages with which it has been in contact since its inception, thus leading to continuing innovation originating in this contact. Unlike other frameworks such as the third-wave variationist framework (Johnstone Reference Johnstone2016; Ilbury Reference Ilbury2020) that views CSE as one of the enregistered styles of English used in Singapore (Leimgruber Reference Leimgruber2012; Khoo Reference Khoo2023; Lee Reference Lee2023; Lu Reference Luke2025), from the perspective of world Englishes scholars, CSE is a contact form of English, with influences from Sinitic languages and Malay, along with Tamil to a lesser extent. The variety has long been subject to scholarly attention; the interested reader is referred to the book-length works by Ho and Platt (Reference Mian-Lian and Platt1993), Gupta (Reference Gupta1994), Lim (Reference Lim2004), Deterding (Reference Deterding2007), Leimgruber (Reference Leimgruber2013), and Bao (Reference Bao2015) for a general overview; specific features of the variety have been described in a range of scientific articles over the past three decades. Among the more stereotypical features of CSE are its discourse particles (the most salient being lah), which have received some attention and which we also touch on in Section 3.
The dynamic nature of the continued contact between especially Sinitic varieties (but also Malay and, to a lesser extent, Tamil) and English in this context, as well as widespread bilingualism, have allowed us to argue in previous work (e.g., Lim, Hiramoto, et al. Reference Lim, Hafiz, Gonzales, Leimgruber and Hiramoto2024; Hafiz et al. Reference Hafiz, Hiramoto, Leimgruber, Gonzales and Lim2025; but also Leimgruber Reference Leimgruber2016) that innovations in CSE can continuously be ‘transferred in’ from the putative substrate languages (e.g., is it discussed in Hiramoto et al. Reference Hiramoto, Gonzales, Leimgruber, Lim, Hafiz, Rüdiger, Leukert and Leimgruber2025). This view goes against traditional ideas of such substrate influence being restricted to early contact (e.g., Siegel Reference Siegel1999), for instance, by the so-called founder principle (Mufwene Reference Mufwene2001). Therefore, the variety of CSE used by younger speakers, reflected in our corpus and described in this Element, is influenced not only by global youth language phenomena and Americanisation (see e.g., Tan Reference Tan2012 on rhoticity; or Starr Reference Starr2019 on the bath–trap split), but also by locally grown cross-fertilisation between languages that are actively used in the community. This impact goes both ways, too, perhaps best conceptualised in terms of a complex dynamic system (on which see Schneider Reference Schneider2025). While Singaporean instantiations of Mandarin, Malay, and so on exist, our focus here remains on the local form of English and the ways in which the complex linguistic environment has shaped it.
2 Corpus Approaches to CSE Change
The primary source of data used in this Element is the Corpus of Singapore English Messages (CoSEM). In this section, we present the corpus and show how it differs from other existing resources of CSE. A fuller description of the corpus can be found in Gonzales et al. (Reference Gonzales, Hiramoto, Leimgruber and Lim2023a).
2.1 Brief Description
Compiled between 2016 and 2022, CoSEM (version 5) currently stands at 6.6 million tokens. Previous publications using the corpus were based on earlier versions, hence the difference in word counts (e.g., 3.6 million in Gonzales et al. Reference Gonzales, Hiramoto, Leimgruber and Lim2023a). For version 5, the data was further cleaned for duplicates, and punctuation was excluded from the token/word count. It was anonymised using the scrubadub package as well as customised RegEx scripts. As with any type of automated scrubbing, there is a chance of remnant utterances that are not properly scrubbed.
The corpus was compiled over several semesters spanning 2016 to 2022 at the National University of Singapore as part of an advanced sociolinguistics class (EL3211: Language in Contact) taught by one of the authors. The idea behind the class project was to give students the opportunity to experience data collection and curation, corpus preparation, and to critically engage with linguistic data from a variety with which they would be, for the most part, familiar. Students built their own dataset, consisting of WhatsApp group chats (later extended to include Telegram chats), anonymised the data, and made sure they obtained informed consent from all chat participants in line with university research ethics guidelines. The group chats included users in the students’ wider social circle, that is, family members, classmates, friends, colleagues, and so on. As the corpus was being developed, we also received institutional support from Undergraduate Research Opportunities Programme (UROP) students and research assistants at the National University of Singapore, who contributed to the ongoing process of cleaning and refining the dataset.
The Corpus of Singapore English Messages exhibits a pronounced age-based distribution, with younger individuals dominating contributions, as shown in Table 1. Speakers aged 21–29 account for 70.7 per cent of lines and 69.3 per cent of words, followed by those aged 18–20 at 23.5 per cent for both metrics. Together, these groups comprise over 94 per cent of the dataset, highlighting a strong generational skew. By contrast, contributions from those over 30 are minimal. The 30–39 group contributes just 1.1 per cent of lines and 1.2 per cent of words, while the 40–49 group adds 1.7 per cent for both measures. The 50–59 demographic, though slightly more represented, remains small at 2.8 per cent of lines and 4.1 per cent of words. The 60–69 group is nearly absent, with only 0.1 per cent of lines and 0.2 per cent of words. The ‘Others’ category, likely representing speakers outside standard age brackets, accounts for a mere 0.1 per cent of lines and words.
| Age category | Lines (n) | Lines (%) | Words (n) | Words (%) |
|---|---|---|---|---|
| 18−20 | 325,312 | 23.5 | 1,551,172 | 23.5 |
| 21−29 | 979,303 | 70.7 | 4,577,378 | 69.3 |
| 30−39 | 15,575 | 1.1 | 78,717 | 1.2 |
| 40−49 | 23,323 | 1.7 | 108,873 | 1.7 |
| 50−59 | 38,018 | 2.8 | 267,850 | 4.1 |
| 60−69 | 1,916 | 0.1 | 14,046 | 0.2 |
| Others | 1,265 | 0.1 | 5,421 | 0.1 |
| Total | 1,384,712 | 100.0 | 6,603,457 | 100.0 |
This generational imbalance reflects broader trends in digital language data, where younger users dominate. Consequently, the corpus captures linguistic forms and interactional styles aligned with younger speakers, particularly those in their twenties, which is of interest in this Element.
Table 2 indicates that CoSEM exhibits a slight imbalance, with female users contributing a majority of the data. Women account for 52.7 per cent of lines and 53.8 per cent of words, while men contribute 47.3 per cent of lines and 46.2 per cent of words. This suggests that not only do female users produce slightly more lines, but they also tend to use more words per line on average. The ‘Others’ category, representing non-binary, unspecified, or alternative gender identities, is effectively absent, contributing just 55 lines and 213 words, which is statistically negligible within the dataset.
| Gender | Lines (n) | Lines (%) | Words (n) | Words (%) |
|---|---|---|---|---|
| Female | 729,473 | 52.7 | 3,551,742 | 53.8 |
| Male | 655,184 | 47.3 | 3,051,502 | 46.2 |
| Others | 55 | 0.0 | 213 | 0.0 |
| Total | 1,384,712 | 100.0 | 6,603,457 | 100.0 |
In terms of chat gender composition, notable differences in participation and linguistic output across different gender groupings can be found, as summarised in Table 3. Chats composed exclusively of female participants account for the largest share of the corpus, contributing 31.6 per cent of all lines and 30.2 per cent of all words. This suggests that all-female spaces are among the most linguistically active in the dataset. Mixed-gender settings also make up a significant portion of the corpus. Chats with an equal split between male and female participants contribute 20.5 per cent of lines and 20.8 per cent of words, while ‘Dominantly female’ chats, where women form a majority but not the totality, account for 12.0 per cent of lines and 12.8 per cent of words. On the male-dominated side, ‘Dominantly male’ chats represent 24.2 per cent of lines and 25.2 per cent of words, and ‘Exclusively male’ chats contribute the smallest share, with 11.7 per cent of lines and 11.0 per cent of words. These figures suggest that gender composition influences participation levels and word output, with female-majority spaces contributing more lines overall. However, the relatively balanced distribution between male- and female-dominated chats suggests that neither gender group is vastly underrepresented.
| Chat gender make-up | Lines (n) | Lines (%) | Words (n) | Words (%) |
|---|---|---|---|---|
| Exclusively female | 438,014 | 31.6 | 1,996,941 | 30.2 |
| Dominantly female | 166,087 | 12.0 | 844,555 | 12.8 |
| Half male/half female | 283,434 | 20.5 | 1,373,316 | 20.8 |
| Dominantly male | 335,544 | 24.2 | 1,661,556 | 25.2 |
| Exclusively male | 161,633 | 11.7 | 727,089 | 11.0 |
| Total | 1,384,712 | 100.0 | 6,603,457 | 100.0 |
Table 4 shows the distribution of lines and words by nationality and racial groups in the corpus, which reveals a striking concentration of contributions from a single dominant group, with notable disparities among others. Singaporean Chinese users overwhelmingly account for the largest share of the corpus, contributing 77.4 per cent of all lines and 76.9 per cent of all words. This suggests that the linguistic patterns captured in the dataset will be heavily shaped by this demographic. The next largest contributors are Singaporean Indian users, who make up 10.0 per cent of lines and 10.0 per cent of words, followed by Singaporean Malays, who contribute 6.2 per cent of lines and 6.6 per cent of words. Singaporean Eurasians are a smaller but still notable presence, accounting for 0.9 per cent of lines and 0.9 per cent of words. Other ethnic groups, including Indonesian (0.7%), Indian users from India (0.6%), and Chinese users from China (0.4%) and Indonesia (0.3%), contribute modestly to the corpus. The remaining racial and ethnic categories, including Japanese, Filipino, Vietnamese, and various other Chinese subgroups, each account for less than 0.5 per cent of the total dataset. Many groups, such as those from the USA (0.01%) and Australia (0.2%), contribute minimally, suggesting that their linguistic representation in the corpus is negligible. These figures highlight the strongly localised nature of the dataset, with Singaporean users, especially Singaporean Chinese, being the dominant contributors.
| Race/ethnicity | Lines (n) | Lines (%) | Words (n) | Words (%) |
|---|---|---|---|---|
| Australian | 2,015 | 0.2 | 9,013 | 0.1 |
| China Chinese | 4,951 | 0.4 | 22,727 | 0.3 |
| Spanish | 16 | 0.0 | 102 | 0.0 |
| French | 20 | 0.0 | 114 | 0.0 |
| British Pakistani | 51 | 0.0 | 121 | 0.0 |
| Hongkong Chinese | 345 | 0.0 | 1,994 | 0.0 |
| Indonesian Chinese | 4,497 | 0.3 | 21,411 | 0.3 |
| Indonesian | 9,809 | 0.7 | 47,068 | 0.7 |
| India Indian | 7,997 | 0.6 | 31,205 | 0.5 |
| Japanese | 46 | 0.0 | 265 | 0.0 |
| Korean | 1,230 | 0.1 | 4,238 | 0.1 |
| Myanmar Chinese | 791 | 0.1 | 4,249 | 0.1 |
| Malaysian Chinese | 291 | 0.0 | 1,032 | 0.0 |
| Malaysian Malay | 519 | 0.0 | 4,452 | 0.1 |
| Malaysian | 2,119 | 0.2 | 10,706 | 0.2 |
| Filipino | 46 | 0.0 | 245 | 0.0 |
| Saudi Arab | 883 | 0.1 | 2,936 | 0.0 |
| Singaporean Armenian | 86 | 0.0 | 450 | 0.0 |
| Singaporean Arab | 570 | 0.0 | 2,780 | 0.0 |
| Singaporean Bengali | 90 | 0.0 | 687 | 0.0 |
| Singaporean Chinese | 1,071,534 | 77.4 | 5,075,449 | 76.9 |
| Singaporean Chinese–Indian | 2,538 | 0.2 | 10,881 | 0.2 |
| Singaporean Chinese–Malay | 294 | 0.0 | 2,001 | 0.0 |
| Singaporean Eurasian | 12,046 | 0.9 | 57,783 | 0.9 |
| Singaporean Indian | 138,724 | 10.0 | 660,927 | 10.0 |
| Singaporean Malay | 85,568 | 6.2 | 432,584 | 6.6 |
| Singaporean (Mixed) | 780 | 0.1 | 4,888 | 0.1 |
| Singaporean Filipino | 26 | 0.0 | 138 | 0.0 |
| Singaporean Sinhalese | 29,044 | 2.1 | 160,820 | 2.4 |
| Singaporean | 5,176 | 0.4 | 17,849 | 0.3 |
| Thai | 716 | 0.1 | 4,233 | 0.1 |
| Taiwanese Chinese | 815 | 0.1 | 3,634 | 0.1 |
| USA/American | 118 | 0.0 | 931 | 0.0 |
| Vietnamese | 890 | 0.1 | 5,212 | 0.1 |
| Others | 71 | 0.0 | 332 | 0.0 |
| Total | 1,384,712 | 100.0 | 6,603,457 | 100.0 |
With respect to the year, the corpus reveals clear temporal patterns, with a peak in contributions between 2015 and 2017, followed by a steady decline in more recent years. This is depicted in Table 5. The corpus sees a gradual increase in contributions from 2012 to 2014, with the number of lines rising from 13,877 (1.0%) in 2012 to 77,922 (5.6%) in 2014. A significant jump occurs in 2015 (15.2%) and 2016 (25.0%), which together account for over 40 per cent of the total corpus. The peak contribution year is 2016, with 346,545 lines and 24.0 per cent of the total words. Following this peak, the number of lines decreases, though 2017 (19.2%) and 2018 (12.9%) remain substantial contributors. A sharper decline follows in 2019 (6.5%) and 2020 (10.0%), suggesting reduced engagement or shifts in data collection. From 2021 onward, contributions drop dramatically, with only 1.51 per cent of lines in 2021 and virtually no data in 2022 (0.01%). This suggests that the corpus is primarily reflective of conversations occurring between 2015 and 2018, with more recent linguistic trends being underrepresented.
| Year | Lines (n) | Lines (%) | Words (n) | Words (%) |
|---|---|---|---|---|
| 2012 | 13,877 | 1.0 | 65,215 | 1.0 |
| 2013 | 42,792 | 3.1 | 186,043 | 2.8 |
| 2014 | 77,922 | 5.6 | 347,019 | 5.3 |
| 2015 | 210,354 | 15.2 | 939,696 | 14.2 |
| 2016 | 346,545 | 25.0 | 1,584,041 | 24.0 |
| 2017 | 265,292 | 19.2 | 1,229,895 | 18.6 |
| 2018 | 178,696 | 12.9 | 902,801 | 13.7 |
| 2019 | 90,446 | 6.5 | 545,972 | 8.3 |
| 2020 | 137,770 | 10.0 | 705,037 | 10.7 |
| 2021 | 20,887 | 1.5 | 97,227 | 1.5 |
| 2022 | 131 | 0.01 | 511 | 0.01 |
| Total | 1,384,712 | 100.0 | 6,603,457 | 100.0 |
The dataset presented in this section provides a comprehensive overview of CoSEM, highlighting its scope, structure, and demographic balance. Building upon this descriptive foundation, the following section offers a closer examination of how the corpus composition informs the patterns of linguistic usage observed within it. By understanding the demographic and temporal dimensions, we gain insight into how sociolinguistic factors shape digital communication practices among Singaporean users.
As the data shows, CoSEM is largely shaped by contributions from younger speakers, particularly those in their twenties, given that the data was primarily collected from university students. The gender distribution further highlights meaningful participation from both male and female speakers, with a slight female majority, suggesting dynamic gendered interactions within Singapore’s digital discourse spaces. This imbalance reflects the general tendency in linguistics courses at the National University of Singapore, where female students typically outnumber their male counterparts, and aligns with the demographic composition of the course from which much of the data was collected. The breakdown by nationality and race demonstrates the corpus’s strong local grounding, with Singaporean Chinese users making up the majority of participants, followed by Indian and Malay contributors. This composition underscores how local demographic realities and social networks are reflected in digital communication patterns.
2.2 CoSEM in Relation to Other Corpora
The Corpus of Singapore English Messages stands apart from other corpora of CSE in several ways. First, it is a corpus of written electronic communication, a type of conversational fingered speech (Faulkner & Culwin Reference Faulkner and Culwin2005), which consists, therefore, of language belonging to a separate medium from the purely spoken or written type found, for instance, in the International Corpus of English (ICE). Due to its largely informal style, the genre has been said to be sited halfway between spoken and written, though this qualification is by no means unchallenged (cf. Maynor Reference Maynor1994; Crystal Reference Crystal2006; Androutsopoulos Reference Androutsopoulos2006). Text messaging is semi-synchronous in nature, which sets it apart from spoken conversation as well as from written emails, for example. The earliest publicly available text messaging corpus with Singapore English content, as far as we know, is the NUS SMS Corpus (Chen & Kan Reference Chen and Kan2012), although it is much smaller than CoSEM (~56,000 messages) and not focussed on CSE. Other previous research on CSE has also drawn on online discussion forums as a source of data (e.g., Deuber, Leimgruber, & Sand Reference Deuber, Leimgruber and Sand2018; Ziegeler Reference Ziegeler2020; Ziegeler Reference Ziegeler2024), which are yet another genre characterised by less synchronous interaction than the text messages in CoSEM. More recently, the YouTube Corpus of Singapore English Podcasts (YCSEP, see Coats et al. Reference Coats, Basile, Morin and Fuchs2025) has expanded the landscape of CSE corpora by providing a large-scale, fully transcribed dataset of informal spoken Singapore English. Like CoSEM, YCSEP captures informal, spontaneous use of CSE across a wide range of speakers, offering valuable insights into contemporary CSE use. However, while YCSEP represents spoken interaction primarily through long-form podcast discourse, CoSEM captures short-form, everyday digital communication.
Second, CoSEM features a form of CSE more contemporary than is found in other recent corpora. ICE-SIN in particular, which is often used in cross-varietal analyses due to its consistent internal architecture in line with other national corpora of the same suite, is among the earliest ICE components collected and dates from the 1990s. As such, it is at least one generation older than CoSEM and does not reflect current linguistic practices or the societal changes that have taken place in the country since then, including a larger English-speaking base in the population and changing attitudes towards CSE. Third, CoSEM contains a decidedly young variety of CSE, as evidenced by the age distribution given in Table 1. While this is at least in part an artefact of the data collection procedure as well as the electronic medium used, it sets CoSEM somewhat apart from other corpora such as ICE-SIN and the Sgforums corpus (Deuber, Leimgruber, & Sand Reference Deuber, Leimgruber and Sand2018). Furthermore, especially compared with ICE-SIN, CoSEM features much less acrolectal speech, given the low-impact data collection method removing many of the issues associated with the interviewer paradox. As such, the corpus is a timely addition to existing databases on CSE, allowing new insights into young and innovative uses of language in the Singapore context.
For these reasons, the CSE captured in CoSEM should be of interest to a wide range of linguistics researchers: from World Englishes researchers and sociolinguists to formal linguists and psycholinguists interested in CSE and/or nonstandard varieties of English. To ensure that the corpus itself can be used easily by the field, we are currently exploring ways to enrich CoSEM further with part-of-speech (POS) tagging and syntactic parses. Following the approach outlined in Lin et al. (Reference Lin, Han and Hing2023) and Huang et al. (Reference Huang, Lin and Han2025), we plan to apply statistical taggers and parsers to automatically annotate the corpus, followed by manual validation of tags and parses, especially for linguistic phenomena of interest like SFPs and constructions like topic-comment structures, ellipsis, and so on. The manual validation process will require a substantial investment of time and resources, but it will help ensure that the tags and parses are sufficiently accurate for research purposes.
In summary, the overview of CoSEM in this section establishes the foundation for subsequent analyses in this volume. The next section introduces a recently administered survey on how Singaporeans use CSE in social media, designed to supplement the corpus data. The remainder of this Element will explore the findings, highlighting both corpus-based observations and survey-driven perspectives on language use, identity, and sociocultural meanings.
3 Integrating Corpus and Survey Methods to Examine CSE Use and Change
3.1 Introduction
3.1.1 CoSEM Studies Thus Far
In the previous section, we discussed CoSEM’s design and logistics; in this section, we provide an overview of research conducted with the corpus to date. One of our first publications, Gonzales et al. (Reference Gonzales, Hiramoto, Leimgruber and Lim2023a), introduced CoSEM, situating it alongside existing corpora of Singapore English, detailing its construction and 3.6-million-word composition (v.1), and illustrating its analytical potential through preliminary case studies on two CSE features: the Hokkien-derived (bo)jio ‘neg invite’ and clause-final adverbs (CFAs). In conjunction with the larger and more recent CoSEM (v. 5) described earlier, this work established the corpus as a key resource for tracing change in CSE in computer-mediated communication. Subsequent studies have used CoSEM to investigate SFPs – arguably the most well-known feature of CSE and an enduring area of interest in CSE research. Leimgruber et al. (Reference Leimgruber, Lim, Gonzales and Hiramoto2021) showed that gender and ethnicity shape the use of certain particles in CSE, reinforcing the view that SFPs are a particularly sensitive locus of sociolinguistic differentiation in CSE (see also Leimgruber Reference Leimgruber2009; Smakman & Wagenaar Reference Smakman and Wagenaar2013; Botha Reference Botha2018). Building on Khoo (Reference Khoo2012), Hiramoto et al. (Reference Hiramoto, Gonzales, Leimgruber, Lim, Choo, Ngefac, Wolf and Hoffmann2022) traced the development of the novel SFP sia from its origins as a Malay swearword into a marker of youth identity and a ‘coarse but cool’ style, used across a variety of speakers and interactional contexts. Hafiz et al. (Reference Hafiz, Hiramoto, Leimgruber, Gonzales and Lim2025) extended this work, examining the distribution of sia and its variants (sial, siak, and siol) across demographic groups and showing that the use of sia and its variants has spread beyond young male CSE speakers and is increasingly used by younger CSE speakers.
Building on the pilot study in Gonzales et al. (Reference Gonzales, Hiramoto, Leimgruber and Lim2023a), J. J. Lim, Hiramoto et al. (Reference Lim, Hiramoto, Leimgruber and Gonzales2024) revisited CFAs in CSE, showing that already and only have increased in frequency over time while also has remained relatively stable. These results provide evidence for growing morphosyntactic endonormativity (Schneider Reference Schneider2007) in CSE. The authors also demonstrated that younger and male speakers lead in the use of CFAs, reinforcing earlier findings that age and gender are highly relevant for understanding variation in CSE.
The Corpus of Singapore English Messages has also facilitated our investigation of innovative CSE features, such as adverbial confirm and the clause-initial question tag is it. Drawing on data from CoSEM and ICE-SIN, J. J. Lim, Hafiz et al. (Reference Lim, Hafiz, Gonzales, Leimgruber and Hiramoto2024) documented the emergence and formal properties of a novel adverb in CSE – confirm – used to express strong speaker certainty in an utterance. Strikingly, the authors also showed that adverbial confirm was used more frequently in CoSEM over other surface-semantically equivalent adverbials such as definitely and for sure. As the adverbial use of confirm has not been reported elsewhere in the CSE literature, the authors introduce it as an emerging CSE resource and use CoSEM text message data to describe its formal properties and distribution. Similarly, Gonzales et al. (Reference Gonzales, Hiramoto, Leimgruber and Lim2023b) first drew attention to the innovative use of is it in clause-initial position in CSE, documenting not only its formal properties but also showing that this construction is more likely to be used in rhetorical, playful contexts and by younger Singaporean speakers. Building on this work, Hiramoto et al. (Reference Hiramoto, Gonzales, Leimgruber, Lim, Hafiz, Rüdiger, Leukert and Leimgruber2025) showed that the use of clause-initial is it in CSE has increased over time, and drawing on Siegel’s (Reference Siegel2000, Reference Siegel and Michaelis2008) substrate transfer theory, argued that it entered CSE due to contact with local Sinitic languages in Singapore.
In addition to the abovementioned features, CoSEM contains many other playful and innovative CSE forms that may indicate ongoing changes in the variety. Using data from CoSEM, several undergraduate honours theses have investigated features like already and only (Cheong Reference Cheong2016), toh ‘fall, die’ of Hokkien origin (Chee Reference Chee2019), dei, a vocative directed particularly at Indian men (Kaur Reference Kaur2019), and the lesser-studied SFPs bah and wor (Choo Reference Choo2024). Other promising avenues for further study have surfaced in exploratory student projects, such as the use of double SFPs (see Boo, Lee, & Tan Reference Boo, Lee and Tan2023). Together, these studies underscore the richness of the CoSEM dataset and its potential to capture socially salient innovations that have not yet been systematically described in the literature. At the same time, our reliance on CoSEM necessarily constrains the kinds of claims we can make about CSE more broadly. As a text-message corpus, CoSEM privileges relatively young, digitally active speakers and offers only indirect access to speakers’ metalinguistic awareness, social evaluations, and reported usage outside the messaging context. The digital communication landscape has also shifted considerably since we began building CoSEM, with many Singaporeans now using other messaging platforms beyond WhatsApp and Telegram and making it increasingly difficult to capture CSE usage in Computer-Mediated communication. This may be why some of the innovative items identified in the corpus (e.g., toh, dei, and double SFPs) occur infrequently, making it challenging for fine-grained quantitative modelling by age, ethnicity, or gender. However, these features are recognisable and stylistically salient for many CSE speakers. To address these limitations and test whether these features are diffusing beyond the specific cohorts represented in CoSEM, it became crucial to supplement the corpus with an attitudinal and usage survey.
3.1.2 Motivations for the Survey
A central question in sociolinguistics research concerns the relationship between how speakers perceive their own language use and their actual linguistic behaviour. Classic work by Labov (Reference Labov1966, Reference Labov1972, Reference Labov1975) demonstrated that speakers’ self-reported usage of certain linguistic features often diverges from observed usage, suggesting that metalinguistic intuitions may not always be reliable indicators of linguistic behaviour (see also Trudgill Reference Trudgill1972, Reference Trudgill1974a). Such mismatches may arise because speakers’ perceptions are shaped by their attitudes towards certain linguistic features, as well as broader prescriptive norms about language. At the same time, other studies (e.g., Bailey, Wikle & Tillery Reference Bailey, Wikle and Tillery1997; Chambers Reference Chambers1998; Bailey & Tillery Reference Bailey and Tillery1999; Tillery, Wikle & Bailey Reference Tillery, Wikle and Bailey2000; Benson et al. Reference 75Benson, Chik, Gao, Huang and Wang2009; Dollinger Reference Dollinger2012; Dollinger Reference Dollinger2015; Kostadinova Reference Kostadinova2018) have demonstrated that speakers’ perceptions can, under certain conditions and for certain linguistic features, reliably track actual patterns of language use. The supplementary survey to CoSEM allows us to probe how widely these forms are known, how often and in what contexts they are used (e.g., speech vs. texting), and what social meanings speakers attribute to them, including possible associations with particular ethnic groups, genders, or stance styles. In this way, corpus data and survey evidence can be brought into productive dialogue: the corpus provides ecologically valid records of usage in situ, while the survey offers a broader window onto the penetration, social evaluation, and perceived normativity of emerging CSE features among speakers outside CoSEM.
We administered an online survey containing questions about respondents’ demographic info, CSE use (awareness, acceptability, frequency, etc.) (see Section 3.3 for details), and contact information for possible follow-up. The survey was distributed across our social networks in Singapore between 2024 and 2025 and was targeted at adults over eighteen who reported being native CSE speakers and were living in Singapore. While it was not possible to exclude CoSEM participants in the survey entirely, we tried our best to recruit participants who are outside of the CoSEM cohorts by encouraging the survey participants to distribute the survey to a wider range of people in terms of age, race, occupation, education, and language background. This snowball method yielded 230 participants, of which 214 met our criteria and were retained for analysis.
In this section, we focus on comparing survey data on Singaporeans’ self-reported usage of CSE linguistic features with actual usage patterns attested in CoSEM as our initial step of utilising the combination method. To do this, we highlight three salient CSE linguistic features mentioned earlier as our test samples: clause-initial is it (Gonzales et al. Reference Gonzales, Hiramoto, Leimgruber and Lim2023b; Hiramoto et al. Reference Hiramoto, Gonzales, Leimgruber, Lim, Hafiz, Rüdiger, Leukert and Leimgruber2025), adverbial confirm (Lim, Hafiz, et al. Reference Lim, Hafiz, Gonzales, Leimgruber and Hiramoto2024), and the Malay-derived SFP sia (Khoo Reference Khoo2012; Hiramoto et al. Reference Hiramoto, Gonzales, Leimgruber, Lim, Choo, Ngefac, Wolf and Hoffmann2022; Hafiz et al. Reference Hafiz, Hiramoto, Leimgruber, Gonzales and Lim2025). These linguistic tokens were selected due to the fact that they show frequencies in CoSEM substantial enough to support a meaningful comparison. We anticipate that insights gained from these high-frequency items will help guide future analyses of less frequent CSE features by revealing how survey-based perceptions may align with or diverge from corpus-based observations.
It is important to note that the survey respondents and corpus participants do not constitute the same group of individuals. Because both datasets were collected anonymously, it is not possible to determine any overlap between them, nor to directly compare a respondent’s perception of their linguistic behaviour with their actual observed usage. However, this is not our objective. Rather, by examining whether self-reported usage by survey respondents aligns with or diverges from previous corpus-based findings, we aim to contribute to ongoing discussions about the extent to which self-reports can serve as reliable indicators of language use across social variables.
Section 3.2 provides a brief overview of the three linguistic features under consideration. Section 3.3 outlines the survey design and our hypotheses. Section 3.4 presents the results of our analysis, and Section 3.5 concludes with a discussion of how self-reported usage compares with observed patterns in CoSEM, and what this might reveal about language variation in CSE.
3.2 Overview of Is It, Confirm, and sia
3.2.1 Clause-Initial Is It
In addition to its canonical use in standardised English, where is it functions primarily as a question tag seeking agreement from the listener (1), CSE also contains an innovative clause-initial use of is it, which serves mainly as a rhetorical device conveying a playful or teasing affect (2). It is hypothesised that this clause-initial use arose through substrate influence from the clause-initial A-not-A question construction found in the Sinitic languages spoken in Singapore. See Gonzales et al. (Reference Gonzales, Hiramoto, Leimgruber and Lim2023b) and Hiramoto et al. (Reference Hiramoto, Gonzales, Leimgruber, Lim, Hafiz, Rüdiger, Leukert and Leimgruber2025) for detailed discussions of CSE clause-initial is it, including how it differs from the question-tag is it in standardised English.
(1) it’s not their problem is it
<ICE–SIN:S1A–062#89:1:B>
(2) wa is it you think i wuliao
‘Wow, are you saying that I am boring?’
<COSEM:18CF59–2829–20CHF–2017>
Gonzales et al. (Reference Gonzales, Hiramoto, Leimgruber and Lim2023b) find that younger speakers are more likely to use clause-initial is it than older ones. However, inadequate evidence of gender and ethnicity effects is found.
3.2.2 Adverbial Confirm
As in standardised English, the lexical item confirm can function as a verb in CSE (3). However, unlike in standardised English, CSE also features an adverbial use of confirm, which expresses strong speaker certainty, as illustrated in (4). J. J. Lim, Hafiz, et al. (Reference Lim, Hafiz, Gonzales, Leimgruber and Hiramoto2024) argue that CSE adverbial confirm represents a case of grammatical replication (Heine & Kuteva Reference Heine and Kuteva2003; Heine & Kuteva Reference Heine and Kuteva2005; Heine et al. Reference Heine, Kaltenböck, Kuteva and Long2021) from Mandarin kending, which similarly functions both as a verb meaning ‘to confirm’ and as an adverb meaning ‘definitely’. See J. J. Lim, Hafiz, et al. (Reference Lim, Hafiz, Gonzales, Leimgruber and Hiramoto2024) for intricate evidence that supports treating CSE adverbial confirm as a strongly subjective speaker-oriented adverb.
(3) But let’s wait for <name> to confirm the timing?
‘Let’s wait for <name> to confirm the time, shall we?’
<COSEM:17CF24-111-23CHM-2016>
(4) Aiyah I will confirm be late
‘Damn, I will definitely be late.’
<COSEM:18CF47-1636-20CHF-2017>
While previous work has not reported any effect of age, gender, and ethnicity on the use of adverbial confirm, ongoing research in the team indicates that younger speakers, male speakers, and Chinese speakers are more likely to use adverbial confirm.
3.2.3 Sentence-Final Particle sia
A recent addition to CSE’s well-known inventory of SFPs is sia, which contains four variants: sia, sial, siak, and siol. Previous research has suggested that sia functions as an intensifier signalling coarseness (Khoo Reference Khoo2012) and may also be pragmatically employed to index youthfulness and coolness (Hiramoto et al. Reference Hiramoto, Gonzales, Leimgruber, Lim, Choo, Ngefac, Wolf and Hoffmann2022). See Hafiz et al. (Reference Hafiz, Hiramoto, Leimgruber, Gonzales and Lim2025) for a detailed discussion of the pragmatic meaning differences between the four variants of sia. An example of sia is shown in (5).
(5) How much honey he buy sia
‘How much honey did he buy?!’
<COSEM:18CF42-1803-23MAF-2016>
Building on Khoo (Reference Khoo2012) and Hiramoto et al. (Reference Hiramoto, Gonzales, Leimgruber, Lim, Choo, Ngefac, Wolf and Hoffmann2022), Hafiz et al. (Reference Hafiz, Hiramoto, Leimgruber, Gonzales and Lim2025) show that younger speakers, male speakers, and Malay speakers are more likely to use sia.
3.2.4 Intermediate Summary
Table 6 summarises the findings regarding the relationship between the use of clause-initial is it, adverbial confirm, and SFP sia, and the speaker’s age, gender, and ethnicity.
| Age | Gender | Ethnicity | |
|---|---|---|---|
| Clause-initial is it | Younger | (Not enough evidence of effect) | (Not enough evidence of effect) |
| Adverbial confirm | Younger | Male | Chinese |
| SFP sia | Younger | Male | Malay |
First, younger Singaporeans are found to be more likely to use all three linguistic features, reinforcing the idea that these variables represent recent innovations in CSE. However, limited evidence of the effect of ethnicity has been found on the use of clause-initial is it in CoSEM, while Chinese speakers are more likely to use adverbial confirm, and Malay speakers are more likely to use SFP sia. This contrast suggests that adverbial confirm and SFP sia may represent later developments in CSE, while clause-initial is it may represent an earlier development and is therefore broadly shared across Singapore’s major ethnic groups. The hypothesis that adverbial confirm and SFP sia are newer innovations receives some support from gender patterns: inadequate gender effects are observed for clause-initial is it, while males are more likely to use adverbial confirm and SFP sia. Previous research has similarly identified the male gender as a positive predictor of the use of morphosyntactic features in CSE (e.g., Leimgruber et al. Reference Leimgruber, Lim, Gonzales and Hiramoto2021; Lim, Hiramoto, et al. Reference Lim, Hiramoto, Leimgruber and Gonzales2024; Hafiz et al. Reference Hafiz, Hiramoto, Leimgruber, Gonzales and Lim2025).
3.3 Methodology and Hypotheses
3.3.1 Structure of the Survey
We designed the survey using Google Forms, titled Survey on Singlish use. The aim of the survey was to investigate the contexts in which CSE is used among Singaporeans, how Singaporeans perceive the use of CSE across different age groups, and respondents’ perceptions of their own use of specific CSE morphosyntactic features. The survey was divided into eight sections, and respondents could only proceed to the next section after completing all mandatory fields in the current one.
Section 1 introduced the survey and included its title, purpose, and the investigators involved in the research (i.e., the authors of this monograph). It also provided an overview of the survey questions and information about data privacy and contact details. Participation in the survey was entirely voluntary, and respondents did not receive any compensation for completing the survey.
Section 2 collected demographic information from respondents, including their age (numerical value), gender (male, female, or option to self-identify), ethnicity/race (Chinese, Malay, Indian, Eurasian, or option to self-identify), nationality (Singaporean or option to self-identify), years of residency in Singapore (numerical value), and social media platforms used (TikTok, WhatsApp, Twitter, Line, Viber, WeChat, Facebook, Messenger, Instagram, Signal, Telegram, SMS, Reddit, and an option to specify others). Respondents could also optionally self-identify their generational membership (Gen Alpha, Gen Z/Zoomer, Gen Y/Millennial, Gen X, Baby Boomers, Silent Generation, Greatest Generation, or option to select ‘No idea’ or to specify others).
Section 3 asked respondents to indicate which social media platforms they frequently use CSE on, with the same options available as presented in Section 2. Respondents were then asked to describe, based on their experience, the distinctive ways in which children, teenagers, young adults (ages twenty-one to fifty), and older adults (over fifty) use CSE. Respondents were also invited to share examples and reflections on whether they perceive there to be any age-related differences in the use of Singlish on social media.
Sections 4 to 7 focussed on respondents’ self-reported frequency of use of specific morphosyntactic features in CSE. For each feature, respondents indicated whether they used it ‘a lot’, ‘occasionally’, ‘very rarely’, or ‘never’. Because the survey covered a wide range of features, the questions were divided across three sections to reduce participant fatigue. Section 4 included a mix of relatively new and older CSE features, as well as a question asking whether respondents believed jio or bojio entered CSE first, whether both emerged simultaneously, or whether they were unsure. Section 5 concentrated on relatively older CSE features. Sections 6 and 7 focussed primarily on SFP usage, with particular attention to double SFPs. To minimise misinterpretation, each feature was accompanied by an example sentence – some drawn from CoSEM – illustrating how the feature might be used in a CSE utterance. The features investigated in each section are as follows:
Section 4
(1) never jio (e.g., Why you never jio me to the party? ‘Why didn’t you invite me to the party?’)Footnote 1
(2) confirm + verb (e.g., I confirm fail the test. ‘I will definitely fail the test’.)
(3) is it (e.g., Izzit you think I’m crazy? ‘Do you think I’m crazy?’)
(4) shag (e.g., I damn shag these few days sigh can’t help much. ‘I’m damn tired these days, I can’t help it.’)
(5) spoil market (e.g., You do so much for what? Don’t spoil market leh. ‘What are you doing so much for? Don’t make us look bad.’)
(6) chop (e.g., You got chop your card? ‘Did you stamp your card?’)
Section 5
(1) kena + verb (e.g., I kena scold by the teacher yesterday. ‘I was scolded by the teacher yesterday.’)
(2) shiok! (e.g., This drink damn shiok! ‘This drink is very refreshing/tasty!’)
(3) rabak (e.g., He feeling sick. I saw him today really quite rabak. ‘He is feeling sick. I saw him today and he looked really terrible.’)
(4) rabz (e.g., Yeah my cough also rabz af. ‘Yeah, my cough is also very terrible.’)
(5) pon (e.g., I’m going to pon tomorrow’s training. ‘I’m going to skip tomorrow’s training.’)
(6) cheem (e.g., His English very cheem leh. ‘His English is very difficult to understand.’)
(7) sibeh (e.g., Her mee rebus sibeh good sia! ‘Her mee rebus is very tasty!’)
(8) goondu (e.g., She bring the wrong book again. Damn goondu leh her. ‘She brought the wrong book again. She’s really absent-minded.’)
Section 6
(1) sia (e.g., So hot sia? ‘It’s very hot, isn’t it?’)
(2) toh (e.g., anyways I just ended my event and gonna toh till 9 ‘Anyway, my event just ended and I’m going to crash (i.e., rest) till 9.’)
(3) sia la (e.g., ya sia, don’t think we stupid siala ‘Yeah, don’t think we are stupid.’)
(4) nia (e.g., I providing beer nia leh ‘I’m only providing beer.’)
(5) nia la (e.g., I think still count as 3hrs nia la ‘I think it still counts as only 3 hours.’)
(6) liao sia (e.g., Can preorder liao sia ‘We can [begin to] preorder.’)
(7) liao lor (e.g., Eh cannot buy drinks liao lor ‘Eh, it is no longer possible to buy drinks.’)
Section 7
(1) le meh (e.g., Can open le meh? ‘Can we [begin to] open it?’)
(2) le leh (e.g., Its very loud le leh ‘It is already very loud.’)
(3) le hor (e.g., Now u know why fat le horh ‘Now you know why [you’re] fat.’)
(4) la eh (e.g., Good luck la eh ‘Good luck!’)
(5) la hor (e.g., Should be fine la hor ‘It should be fine, right?’)
(6) la sia (e.g., Tell her she can leave la sia! ‘Tell her she can leave!’)
(7) leh hor (e.g., John has been coming to work late. You’re worried that he might get into trouble if he’s late again. You say to John, ‘Don’t come late again leh hor’. ‘Don’t come late again, please.’)
(8) leh sia (e.g., You are hiking with your friends. You are hungry but your friends want to continue. Finally, you say, ‘I’m hungry leh sia. Can we stop for lunch?’ ‘I’m hungry. Can we stop for lunch?’)
(9) what (e.g., I don’t know we need to bring IC. They also never tell us what. ‘I didn’t know we had to bring our IC (identification card). They didn’t tell us!’)
Finally, Section 8 asked whether the respondents would be willing to be contacted for a follow-up interview, with the option to provide their contact information.
3.3.2 Survey Distribution
The survey was distributed between 2024 and 2025, beginning with the authors’ personal networks and subsequently extending to the networks of their friends and family members. The first responses were collected on 17 May 2024, and the final response was received on 13 March 2025.
3.3.3 Respondent Pool
We collected a total of 230 survey responses. Sixteen were excluded because the respondents were either non-Singaporean or Singaporean individuals who had spent the majority of their lives outside Singapore. Of the 214 remaining responses, 118 (55.1%) belonged to female respondents and 96 (44.9%) belonged to male respondents, creating a slight imbalance in gender distribution. We also assigned the respondents to generational cohorts based on their age: 56 (26.2%) Zoomers (ages 12 to 27 in 2024; 13 to 28 in 2025), 83 (38.8%) Millennials (ages 28 to 43 in 2024; 29 to 44 in 2025), 59 (27.6%) Gen X respondents (ages 44 to 59 in 2024; 45 to 60 in 2025), and 15 Boomers (ages 60 to 78 in 2024; 61 to 79 in 2025). Only one respondent was 80 years of age – above 78 – in 2024, and we opted to group this individual with the Boomers due to the proximity of their age rather than creating a separate category. This brings the total number of Boomers to 16 (7.5%). In terms of ethnicity, 167 (78.0%) respondents were Chinese, 20 (9.3%) respondents were Indian, 13 (6.1%) respondents were Malay, and 14 (6.5%) respondents identified as Other. A limitation of the study is the uneven distribution across generational cohorts and ethnic groups in the respondent pool.
3.3.4 Predictions
As mentioned earlier, this study investigates whether CSE speakers’ self-reported frequency of use of three features – clause-initial is it, adverbial confirm, and SFP siaFootnote 2 – aligns with previously reported and ongoing corpus-based findings. To recap, these findings have shown that younger speakers are more likely to use all three features, male speakers and Chinese speakers are more likely to use adverbial confirm, and male speakers and Malay speakers are more likely to use SFP sia. Based on these findings, we predict that younger CSE speakers – which we define as belonging to the Zoomer and Millennial cohorts – will report higher frequencies of use for all three features. We further expect that male speakers will report higher use for both adverbial confirm and sia, while Chinese speakers will report higher use of adverbial confirm and Malay speakers higher use of sia. By testing these predictions, we aim to assess whether self-reported usage matches corpus-based distributions, thereby contributing to broader discussions on the reliability of self-reports as indicators of language variation across social groups.
3.4 Results
For the purposes of running correlation tests, we recoded categorical variables in the survey into numeric values to calculate the strength and direction of associations between social variables and reported usage patterns. Gender was recoded as a binary variable (0 = female, 1 = male). Because several ethnic categories contained very small cell counts, including zeroes, making groupwise comparisons unreliable, ethnicity was collapsed into a binary contrast between Chinese and non-Chinese respondents (0 = Non-Chinese, 1 = Chinese). Finally, self-reported frequency of use was recoded onto a four-point scale (0 = Never, 1 = Very rarely, 2 = Occasionally, 3 = A lot).
3.4.1 Self-Reported Frequency of Clause-Initial Is It Usage
A Spearman correlation test between continuous age and recoded frequency revealed a significant association between the age of the respondent and self-reported frequency of clause-initial is it usage (n = 214, r = −0.276, p < 0.001). In other words, as age increases, the less likely it is for individuals to report using clause-initial is it.
The data also display clear generational patterns. To recap, we grouped participants into generations based on their ages in 2024/2025: Zoomers (ages 12/13–27/28), Millennials (ages 28/29–43/44), Gen X (ages 44/45–59/60, and Boomers (ages 60/61–78/79). As seen in Figure 1, younger cohorts (Zoomers and Millennials) are more likely to report using clause-initial is it ‘A lot’, while older cohorts (Gen X and Boomers) are less likely to do so, creating a descending staircase pattern for ‘A lot’ across the age groups.
Self-reported frequency of clause-initial is it usage across generations
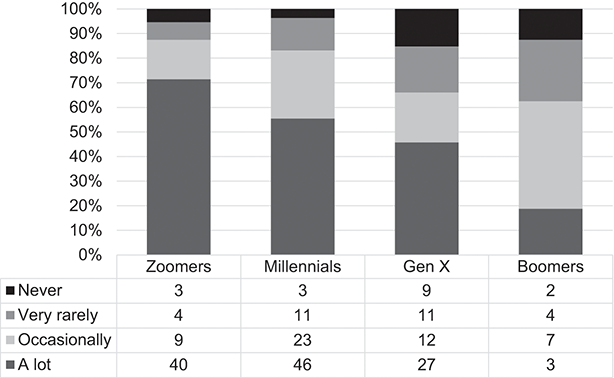
Figure 1 Long description
Percentages are displayed along the y-axis. On the x-axis are the four generational groups (Zoomers, Millennials, Gen X, and Boomers). The stacked bars are colour-coded by level of use and include never (black), very rarely (medium grey), occasionally (light grey), and a lot (dark grey). Under the chart is a data table with the following counts. Zoomers: never (3), very rarely (4), occasionally (9), a lot (40). Millennials: never (3), very rarely (11), occasionally (23), a lot (46). Gen X: never (9), very rarely (11), occasionally (12), a lot (27). Boomers: never (2), very rarely (4), occasionally (7), a lot (3).
Figure 2 shows the self-reported frequency of clause-initial is it usage across gender. Inferential statistics (i.e., Mann–Whitney U-test) revealed a significant difference between females (n = 118) and males (n = 96), U = 4789, p < 0.05, indicating that females are more likely to report using clause-initial is it.
Self-reported frequency of clause-intial is it usage across genders
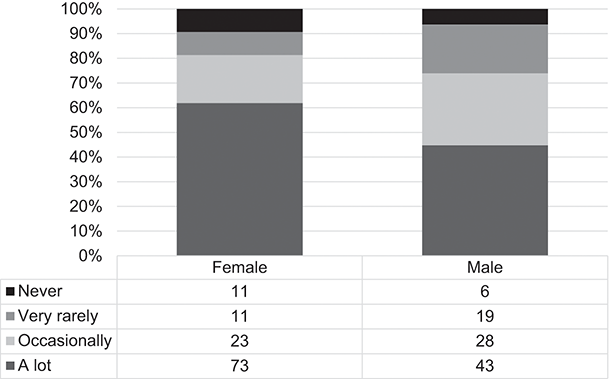
Figure 2 Long description
Percentages are displayed along the y-axis. On the x-axis are the two genders (Female and Male). The stacked bars are colour-coded by level of use and include never (black), very rarely (medium grey), occasionally (light grey), and a lot (dark grey). Under the chart is a data table with the following counts. Female: never (11), very rarely (11), occasionally (23), a lot (73). Male: never (6), very rarely (19), occasionally (28), a lot (43).
Finally, the same test was conducted to assess whether there was an effect of ethnicity on the participants’ self-reported frequency of clause-initial is it use. The test did not find any significant difference between Non-Chinese (n = 47) and Chinese (n = 167) respondents, U = 3,684, p = 0.48, despite the descriptive variation shown in Figure 3.
Self-reported frequency of clause-intial is it usage across ethnic groups
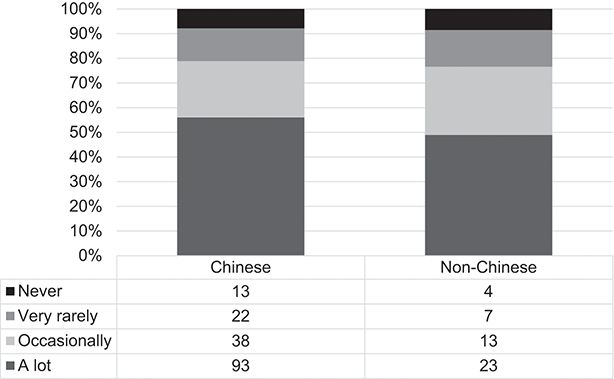
Figure 3 Long description
Percentages are displayed along the y-axis. On the x-axis are the two ethnic groups (Chinese and non-Chinese). The stacked bars are colour-coded by level of use and include never (black), very rarely (medium grey), occasionally (light grey), and a lot (dark grey). Under the chart is a data table with the following counts. Chinese: never (13), very rarely (22), occasionally (38), a lot (93). Non-Chinese: never (4), very rarely (7), occasionally (13), a lot (23).
3.4.2 Self-Reported Frequency of Adverbial Confirm Usage
Turning next to adverbial confirm, a Spearman correlation test between continuous age and recoded frequency revealed a significant association between the age of the respondent and self-reported frequency of use (n = 214, r = −0.18, p < 0.001). This suggests that as age increases, the likelihood of reporting using adverbial confirm decreases.
The data also shows clear generational patterns, as shown in Figure 4. Younger speakers (Zoomers and Millennials) are more likely to report using adverbial confirm ‘A lot’, while older cohorts (Gen X and Boomers) are less likely to do so, creating a descending staircase pattern for ‘A lot’ across the age groups.
Self-reported frequency of adverbial confirm usage across generations
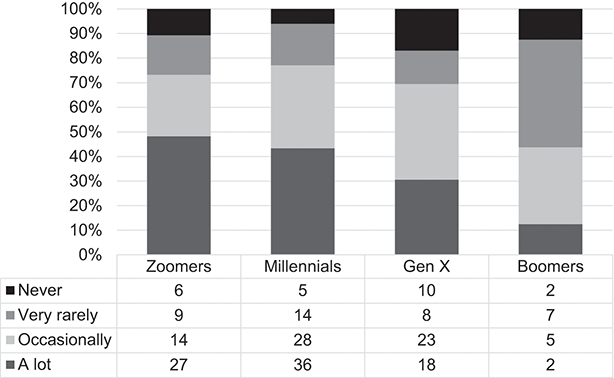
Figure 4 Long description
Percentages are displayed along the y-axis. On the x-axis are the four generational groups (Zoomers, Millennials, Gen X, and Boomers). The stacked bars are colour-coded by level of use and include never (black), very rarely (medium grey), occasionally (light grey), and a lot (dark grey). Under the chart is a data table with the following counts. Zoomers: never (6), very rarely (9), occasionally (14), a lot (27). Millennials: never (5), very rarely (14), occasionally (28), a lot (36). Gen X: never (10), very rarely (8), occasionally (23), a lot (18). Boomers: never (2), very rarely (7), occasionally (5), a lot (2).
Figure 5 shows the self-reported frequency of adverbial confirm usage across gender. A Mann–Whitney U-test revealed no significant difference between females (n = 118) and males (n = 96), U = 5,567.5, p = 0.82.
Self-reported frequency of adverbial confirm usage across genders
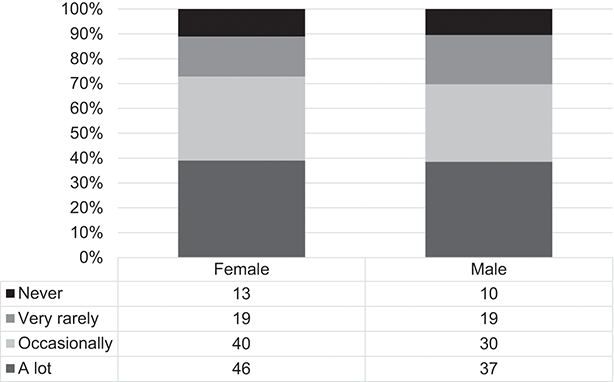
Figure 5 Long description
Percentages are displayed along the y-axis. On the x-axis are the two genders (Female and Male). The stacked bars are colour-coded by level of use and include never (black), very rarely (medium grey), occasionally (light grey), and a lot (dark grey). Under the chart is a data table with the following counts. Female: never (13), very rarely (19), occasionally (40), a lot (46). Male: never (10), very rarely (19), occasionally (30), a lot (37).
Finally, the same test was conducted to assess whether there was an effect of ethnicity on the participants’ self-reported frequency of adverbial confirm use. The test did not find any significant difference between Non-Chinese (n = 47) and Chinese (n = 167) respondents, U = 3,429.5, p = 0.16, despite the descriptive variation shown in Figure 6.
Self-reported frequency of adverbial confirm usage across ethnic groups
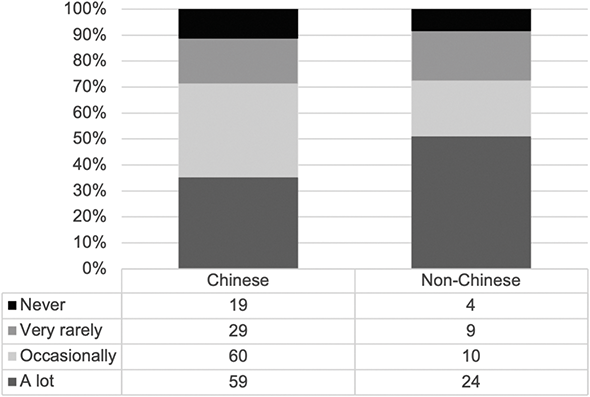
Figure 6 Long description
Percentages are displayed along the y-axis. On the x-axis are the two ethnic groups (Chinese and non-Chinese). The stacked bars are colour-coded by level of use and include never (black), very rarely (medium grey), occasionally (light grey), and a lot (dark grey). Under the chart is a data table with the following counts. Chinese: never (19), very rarely (29), occasionally (60), a lot (59). Non-Chinese: never (4), very rarely (9), occasionally (10), a lot (24).
3.4.3 Self-Reported Frequency of Sentence-Final Particle Sia
Turning finally to the SFP sia, a Spearman correlation test between continuous age and recoded frequency revealed a significant association between the age of the respondent and self-reported frequency of use (n = 214, r = −0.45, p < 0.001). In other words, as age increases, the likelihood of reporting using sia decreases.
The data also shows clear generational patterns, as shown in Figure 7. Younger speakers (Zoomers and Millennials) are more likely to report using sia ‘A lot’, while older cohorts (Gen X and Boomers) are less likely to do so, creating a descending staircase pattern for ‘A lot’ across the age groups.
Self-reported frequency of sia usage across generations
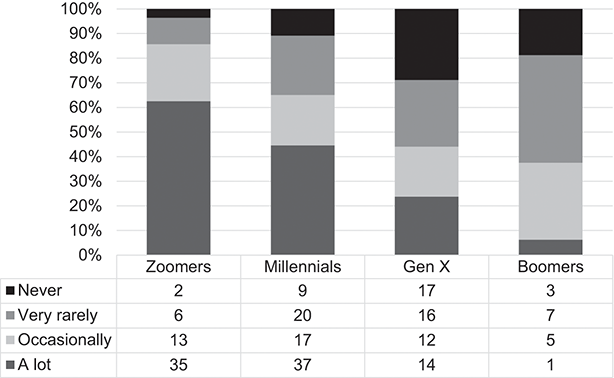
Figure 7 Long description
Percentages are displayed along the y-axis. On the x-axis are the four generational groups (Zoomers, Millennials, Gen X, and Boomers). The stacked bars are colour-coded by level of use and include never (black), very rarely (medium grey), occasionally (light grey), and a lot (dark grey). Under the chart is a data table with the following counts. Zoomers: never (2), very rarely (6), occasionally (13), a lot (35). Millennials: never (9), very rarely (20), occasionally (17), a lot (37). Gen X: never (17), very rarely (16), occasionally (12), a lot (14). Boomers: never (3), very rarely (7), occasionally (5), a lot (1).
Figure 8 shows the frequency of sia usage across genders. A Mann–Whitney U-test revealed no significant difference between females (n = 118) and males (n = 96), U = 5,507, p = 0.71.
Self-reported frequency of sia usage across genders
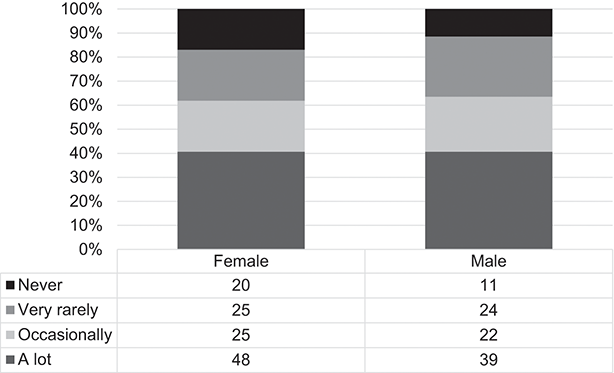
Figure 8 Long description
Percentages are displayed along the y-axis. On the x-axis are the two genders (Female and Male). The stacked bars are colour-coded by level of use and include never (black), very rarely (medium grey), occasionally (light grey), and a lot (dark grey). Under the chart is a data table with the following counts. Female: never (20), very rarely (25), occasionally (25), a lot (48). Male: never (11), very rarely (24), occasionally (22), a lot (39).
Finally, the same test was conducted to assess whether there was an effect of ethnicity on the participants’ self-reported frequency of use of sia. The test did not find any significant difference between Non-Chinese (n = 47) and Chinese (n = 167) respondents, U = 3,356, p = 0.3, despite the descriptive variation shown in Figure 9.
Self-reported frequency of sia usage across ethnic groups
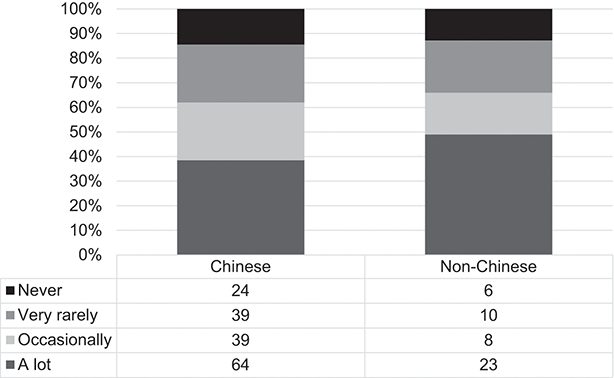
Figure 9 Long description
Percentages are displayed along the y-axis. On the x-axis are the two ethnic groups (Chinese and non-Chinese). The stacked bars are colour-coded by level of use and include never (black), very rarely (medium grey), occasionally (light grey), and a lot (dark grey). Under the chart is a data table with the following counts. Chinese: never (24), very rarely (39), occasionally (39), a lot (64). Non-Chinese: never (6), very rarely (10), occasionally (8), a lot (23).
3.4.4 Perceived Age-Related Differences in CSE Use on Social Media
Given that younger speakers self-report greater use of innovative CSE features while older speakers self-report less, we also wanted to find out whether respondents perceive age-related differences in CSE usage. One survey item asked participants whether they perceived any age-related differences in the use of CSE on social media, and to describe the differences, if any. Based on the response, we categorised it as ‘Yes’ (i.e., the participant perceived age-related differences in the use of CSE on social media) or ‘No/Unsure’ (i.e., the participant did not perceive any age-related differences). Four participants did not respond to this question and were excluded (n = 210). A Mann–Whitney U-test revealed no significant difference between continuous age and ‘Yes’ vs. ‘No/Unsure’ responses, U = 4,585, p = 0.05. Nonetheless, Figure 10 indicates a clear generational trend: as their age increases, the participants’ responses are more likely to indicate ‘No/Unsure’.
Perception of age-related differences in CSE usage on social media across generations
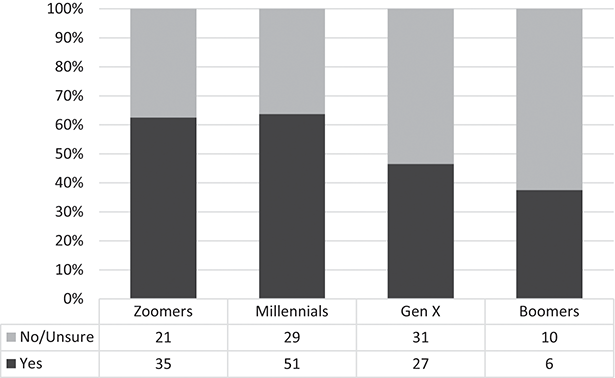
Figure 10 Long description
Percentages are displayed along the y-axis. On the x-axis are the four generational groups (Zoomers, Millennials, Gen X, and Boomers). The stacked bars are colour-coded by response: No or Unsure in light grey and Yes in dark grey. Under the chart is a data table with the following counts. Zoomers: No or Unsure (21), Yes (35). Millennials: No or Unsure (29), Yes (51). Gen X: No or Unsure (31), Yes (27). Boomers: No or Unsure (10), Yes (6).
Several respondents also highlighted differences in the digital domains where Singaporeans use CSE. As one noted: ‘Facebook generally has an older population, TikTok probably has the youngest. X/twitter is probably a mix of teens + 21–50 since [it’s] kinda old and new at the same time’. These observations suggest that platform choice may correlate with age-based variation in CSE usage – a promising avenue for further investigation.
3.4.5 Intermediate Summary
Table 7 summarises the survey-based findings in this subsection and compares it to previous and ongoing corpus-based findings.
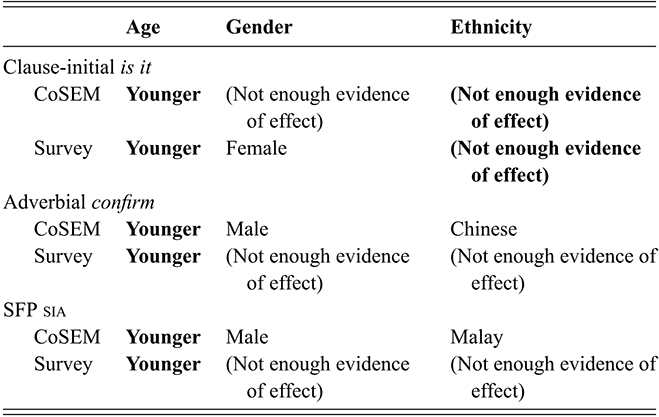
Table 7 Long description
The y-axis shows the corpus and survey findings for three CSE features (clause-initial is it, adverbial confirm, and sentence-final particle sia). The x-axis shows three social variables (age, gender, and ethnicity). Bold text marks cases where corpus and survey results align. The table shows how corpus and survey findings relate to each social variable:
For is it: corpus and survey findings show higher use among younger speakers and no evidence of an ethnicity effect; corpus findings show no evidence of a gender effect, while survey findings show higher use among females. For confirm: corpus and survey findings show higher use among younger speakers; corpus findings show higher use among males and Chinese, while survey findings show no evidence of a gender or ethnicity effect. For sia: corpus and survey findings show higher use among younger speakers; corpus findings show higher use among males and Malays, while survey findings show no evidence of a gender or ethnicity effect.
Across both the data from CoSEM and the survey, age consistently emerges as the most robust predictor of variation in the three CSE features examined herein. In every case, younger speakers show higher rates of use, regardless of whether the data comes from naturally occurring CMC or self-reported usage. In contrast, gender and ethnicity effects are largely confined to corpus data, as most of the self-reported data – apart from the gender effect on clause-initial is it – do not show significant differences.
3.5 Summary
This section has investigated the self-reported usage of three innovative CSE features – clause-initial is it, adverbial confirm, and the SFP sia – using survey data as an independent lens on contemporary CSE practices and as a complement to earlier corpus-based findings from CoSEM. The findings suggest that self-reported data may serve as reliable indicators of linguistic behaviour with respect to age, but not necessarily for gender or ethnicity. This position aligns with previous research arguing that self-reports are more accurate for non-phonetic linguistic features and/or features that are less stigmatised (e.g., Bailey, Wikle, & Tillery Reference Bailey, Wikle and Tillery1997; Benson et al. Reference 75Benson, Chik, Gao, Huang and Wang2009; Dollinger Reference Dollinger2015). As several scholars have noted, attitudes towards CSE have become increasingly positive in recent years (see e.g., Leimgruber Reference Leimgruber2014; Lim Reference Lim2015; Leimgruber, Siemund & Terassa Reference Leimgruber, Siemund and Terassa2018; Hiramoto Reference Hiramoto2019; Lee & Ahn Reference Lee and Ahn2021; Lim & Aman Reference Lim and Aman2024), suggesting that stereotypically ‘Singlish’ features may carry less stigma among younger speakers. In this way, the survey results contribute to broader discussions about the utility of self-reported data in linguistics research.
Methodologically, the section demonstrates the value of putting corpus data and survey data into systematic dialogue. CoSEM offers ecologically valid records of actual usage in a specific CMC register, allowing us to trace the emergence and diffusion of new forms with considerable temporal and social resolution. The survey extends this perspective by tapping into how CSE users outside the corpus understand their own usage and that of others, and by providing explicit evidence of how features are evaluated, stereotyped, or linked to particular age groups and identities. Where corpus and survey findings converge, our confidence in the robustness of a pattern is strengthened; where they diverge, we gain insight into how linguistic practice and linguistic awareness may be decoupled.
Overall, the findings reinforce the idea that youth identity is closely tied to innovative linguistic developments in CSE. Younger CSE speakers’ recognition of age-based differences in CSE reflects an awareness of their role as linguistic trendsetters (cf. Labov Reference Labov1972; Eckert Reference Eckert2000). This may explain why younger speakers both self-report in our survey and are observed in CoSEM to use clause-initial is it, adverbial confirm, and the SFP sia more frequently. This converging finding strengthens our interpretation that these CSE features are part of an ongoing generational shift within CSE, with younger speakers driving the use of these innovative features. On the other hand, the divergence between our corpus‑based and survey‑based findings for gender and ethnicity effects suggests that these social‑indexical associations, while observable in actual linguistic behaviour, may not be salient in speakers’ metalinguistic consciousness. It may also indicate that speakers are less inclined to report gender‑ or ethnicity‑based differences in the use of CSE features.
Finally, this section points towards several avenues for future work. On the empirical side, further survey-based and experimental studies could probe the social meanings of features such as toh, dei, double SFPs, and other low-frequency innovations that remain underattested in CoSEM. On the methodological side, expanding the respondent pool – especially among non-Chinese and older speakers – and incorporating follow-up interviews would allow a more fine-grained account of how CSE users talk about their own language. More broadly, the combined corpus-survey approach will offer a model for investigating other contact varieties in which digitally mediated data and speaker perceptions both play crucial roles in ongoing change. In future work, these survey-based insights can be brought into dialogue with CoSEM analyses to broaden our understanding of modern-day CSE across different communicative contexts. One such feature from contemporary CSE use found in CoSEM is (bo)jio, which we investigate in the next section.
4 Structural and Stylistic Variation in the Use of (Bo)Jio
The CSE construction bojio can be traced to the two Hokkien elements bô ‘not’ and chio ‘invite’Footnote 3 (Wong Reference Wong, Bromhead and Ye2020: 104; Babcock Reference Babcock2022: 337). Together, they are used primarily as an interjection that can be translated, rather clumsily, as ‘why did you not invite me’; its use is illustrated in example (6). Both Wong (Reference Wong, Bromhead and Ye2020) and Babcock (Reference Babcock2022) give a good account of its linguacultural relevance, which can be further sited within the concept of kiasu ‘afraid of losing out’. Wong (Reference Wong, Bromhead and Ye2020: 103) surmises that the term bojio is rather recent (and ‘only entered Singlish in the last five or six years’ at the time of his publication). Our corpus analysis in Gonzales et al. (Reference Gonzales, Hiramoto, Leimgruber and Lim2023a) supports this view, with the item entirely absent from ICE-SIN, for instance.
(6)
A: Yall not gonna drink right? B: We drinking now bruh A: Wtf A: Bojio ‘You didn’t invite me!’ <COSEM:17CF12-31046-21SGINM00-2015>
Whereas the interjection bojio has by now achieved a certain degree of salience within the Singaporean speech community,Footnote 4 the term, especially its jio ‘invite’ element, has also taken on a life of its own, with even inflectional and derivational morphology applied to it: bare verbal and nominal forms are illustrated in (7) and (8), whereas inflected (regular past tense and plural forms, as well as -ing forms) are seen in (9), (10), and (11). Rarer examples include derivational jioness.
(7) House heads went out for supper and never jio us!!!
‘The house heads went out for supper and didn’t invite us!’
<COSEM:21DC19-13118-23SGCHMEK-2020>
(8) <name> just ignored my jio
‘DT/F/CH/20 just ignored my invitation.’
<COSEM:17CF11-12621-20SGCHF00-2015>
(9) we should’ve jioed you for lunch
‘We should’ve invited you for lunch.’
<COSEM:19CM03-39813-22SGXXFNW-2018>
(10) SPEAKING OF jios …. can I jio someone to help me collect something later at 7++ at the drop off point
‘Speaking of invitations, can I invite someone to help me collect something later at 7+ at the drop off point?’
<COSEM:18CF58-9614-19SGCHF00-2017>
(11) I specifically recall jioing everyone
‘I specifically recall inviting everyone.’
<COSEM:21DC31-7892-20SGMAM0A-2018>
The aim of this section is to take a comprehensive look at (bo)jio (henceforth labelled (jio) as a sociolinguistic variable) in contrast to (not) invite, its non-CSE counterpart. In the following, we explain our methods (Section 4.1), present the results (Section 4.2), and discuss the findings from our datasets (Sections 4.3 and 4.4).
4.1 Methodology
4.1.1 Data Sources and Data Pre-Processing
The dataset for this study draws from two primary sources: CoSEM (Gonzales et al. Reference Gonzales, Hiramoto, Leimgruber and Lim2023a) and the social media platform X (formerly Twitter).Footnote 5 Data underwent preprocessing using both manual and automated tools to facilitate linguistic and sociolinguistic analysis. To examine the distribution and usage of jio, the corpus was queried using R, with regular expressions extracting all occurrences of jio, including related tokens such as bojio and invite. This process yielded 1,745 tokens, which were subsequently reviewed by two proficient speakers of CSE to ensure accuracy and exclude spurious matches (e.g., cases where jio appeared within unrelated strings like emoji only). While CoSEM provided a structured dataset of text messages, no comparable corpus existed for Twitter data at the time of this study. Moreover, the introduction of restrictive and costly API policies in 2023 precluded the construction of a specialised Twitter corpus akin to CoSEM. To approximate CoSEM’s scope and relevance, we leveraged data scraping techniques. Fortunately, in late 2021, a research team member had already conducted preliminary data extraction using Gonzales’ Twitter Corpus Suite (Gonzales Reference Gonzales2024, Reference Gonzales2025b), a Python-based framework. This yielded a dataset of 5,286 tokens of jio (including bojio and invite), distributed over 2010 to 2021, circumventing API-related constraints. As with CoSEM, two proficient speakers of CSE reviewed the extracted tokens to ensure accuracy. Unlike CoSEM, the Twitter dataset lacked sociolinguistic metadata, necessitating computational methods to infer demographic variables. Specifically, we adopted an approach informed by the social construction of age and gender, following Gonzales’ (Reference Gonzales2024) methodology for demographic inference on Twitter. Using Wang et al.’s (Reference Wang, Che, Guo, Liu and Liu2019) deep learning framework, we extracted age and gender information based on profile pictures, self-descriptions, and other textual markers. However, no existing computational tools achieved sufficient accuracy (>60%) for race and nationality inference, leading to their exclusion from the dataset. While this omission limits cross-corpus generalisability for these variables, it does not significantly affect the study’s primary focus on age as a sociolinguistic variable.
The final dataset, integrating WhatsApp (CoSEM) and Twitter (jio) data, comprised 7,031 tokens. These were coded for key linguistic factors, including presence/absence of morphological affixation (e.g., jio-ing, bo jio-ed) and negation (e.g., jio vs. bojio, invite vs. not invite). To streamline annotation, Natural Language Processing (NLP) tools such as nltk and spaCy (Bird, Klein, & Loper Reference Bird, Klein and Loper2009; Montani et al. Reference Montani, Honnibal, Boyd, Van Landeghem and Peters2023) automated the coding of English tokens, while non-English items underwent manual annotation by two proficient speakers of CSE.
Beyond linguistic features, sociolinguistic variables were computationally derived to assess their influence on jio usage. These included measures of sociolinguistic style, sentiment, intensity, and platform-based variation. Following Kiesling et al.’s (Reference Kiesling2018) discussion of sentiment as one operationalisable component of social and interactional meaning in computational work, sentiment was analysed using the sentimentR package (Rinker Reference Rinker2021), which assigns each text a polarity score representing the direction of affective evaluation: positive values indicate approval, enthusiasm, or endorsement, whereas negative values indicate disapproval, frustration, or complaint. In Kiesling et al.’s terms, this measure captures the affective dimension of stancetaking, that is, (positive, neutral, and negative) evaluation towards discourse entities, while abstracting away from the dialogic processes of alignment and investment that emerge across turns and participants. To operationalise this concept, we thus draw on polarity as a metric, which broadly captures what kind of stance is being taken. In contrast, sentiment intensity captures how strongly that stance is expressed, regardless of whether it is positive or negative. Intensity was operationalised as the absolute value of the polarity score, such that both highly positive and highly negative utterances receive high intensity values, while neutral or weakly evaluative utterances receive low values. For example, a strongly negative warning and a strongly positive invitation differ in polarity but may exhibit comparable intensity, reflecting similar levels of emotional investment. Distinguishing between polarity and intensity allows the analysis to test whether jio usage is more sensitive to evaluative direction (e.g., positive vs. negative stance) or to affective strength and engagement more generally.
Stylistic variation was examined along three dimensions. First, platform-based style was categorised based on dataset origin (text message vs. Twitter). Second, formality was inferred computationally following Grafmiller et al. (Reference Grafmiller, Szmrecsanyi, Röthlisberger and Heller2018), incorporating markers such as mean word length, nouniness, passive constructions, and noun-verb ratio. Third, informational versus interpersonal tendencies were measured through linguistic indicators, including subordinating conjunction frequency, stranded prepositions, and mean sentence length. These stylistic features were distilled into two overarching dimensions: formality and informationality/interpersonality. Additionally, POS tagging was applied, as the syntactic environment of jio – particularly adjacent POS categories – was hypothesised to condition its variability.
Both datasets underwent systematic collection and preprocessing to enable cross-platform analysis of jio usage. Prior research has shown that linguistic variation is shaped by platform-specific constraints, including character limits, multimodal affordances (e.g., images and videos), and interactional norms (Davies & Fuchs Reference Davies and Fuchs2015; Bohmann Reference Bohmann and Squires2016). By incorporating text message and Twitter data, this study offers a comprehensive account of the sociolinguistic factors shaping the distribution and use of jio, bojio, and invite in Singapore English.
4.1.2 Data Analysis
Using a curated dataset, we examined variation in the use of jio through a combination of frequency distribution analysis, where we get the proportional distribution of variants and compare them by factors of interest. To enhance generalisability, Bayesian logistic regression analysis was also used, following contemporary approaches in linguistics (Vasishth et al. Reference Nicenboim, Beckman, Fangfang and Kong2018; MacKenzie Reference MacKenzie2020). To assess the robustness of our model beyond the training data, we implemented an 80/20 training-test data split. The training set was fitted using a mixed-effects binomial model, appropriate for the binary syntactic variable under investigation – jio vs. invite. We estimated model parameters via Markov chain Monte Carlo sampling implemented in the brms package in R.
The model was trained on 5,625 observations, with 30,000 iterations per chain across four Markov chains. To mitigate the influence of early stage sampling bias, we applied a burn-in period of 15,000 iterations per chain and set a thinning parameter of 2. Weakly informative priors (normal distribution [0,5]) were assigned to both intercepts and slopes. Testing alternative priors (e.g., uniform, Cauchy [0,5]) revealed no substantial impact on the resulting posterior distributions. Model convergence was verified using R̂ values and Effective Sample Size (ESS) estimates, in line with Vehtari et al. (Reference Vehtari2021: 683). Specifically, we ensured that R̂ remained below 1.01 and ESS exceeded 400 (see ‘Results’ for specific values). We did not conduct a frequentist regression analysis, as Bayesian methods, despite their computational demands, provide more interpretable probabilistic inferences and allow for explicit statements regarding the absence of effects – something frequentist approaches do not permit (McElreath Reference McElreath2020; Levshina Reference Levshina2022).
The final model incorporated a range of predictors (Table 8), selected based on sociolinguistic research on CSE, previous studies, and ethnographic insights into variables influencing (jio) variation. Multi-level categorical variables (e.g., race) were coded using Weighted Helmert coding (Sonderegger Reference Sonderegger2023). Additionally, we specified random intercepts for the POS of adjacent words and for lexeme, though, following Levshina (Reference Levshina2016: 253), only lexemes and users with more than five tokens were retained as individual factor levels. Those with fewer than five occurrences were collapsed into an ‘other’ category to ensure sufficient data representation.
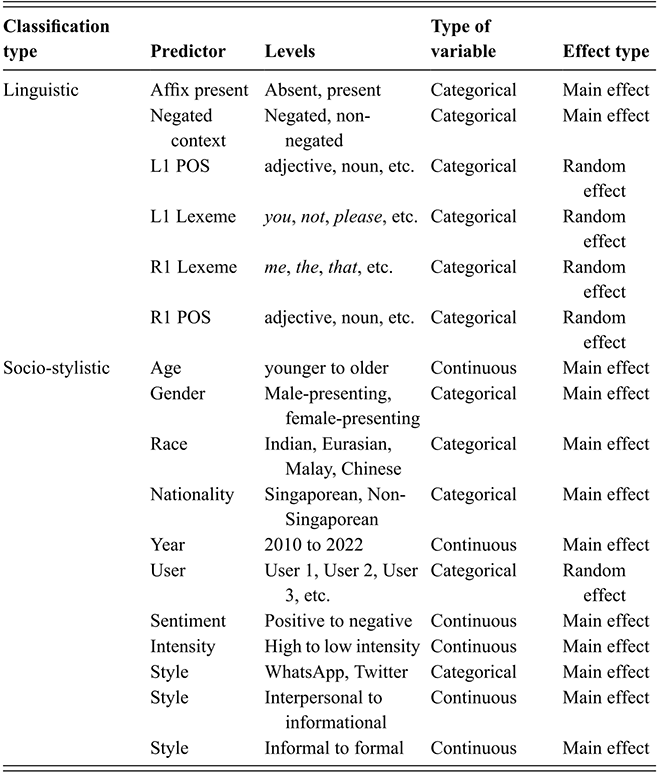
Table 8 Long description
The table shows predictors used in the analysis, grouped into linguistic and socio stylistic categories. Each predictor is listed with its levels, variable type, and whether it is modelled as a main or random effect. Linguistic predictors are all categorical and include affix presence (absent or present) and negated context (negated or non-negated), both main effects, plus four contextual variables modelled as random effects: L1 POS and R1 POS (part of speech immediately left or right) and L1 Lexeme and R1 Lexeme (the neighbouring words). Socio-stylistic predictors include the following main effects: age (continuous), race (four levels, categorical), nationality (categorical), year (continuous), sentiment (continuous), intensity (continuous), and style (both interpersonal-informational and informal-formal, continuous) and user I D as a categorical random effect.
Following the Bayesian posterior summary, we assessed the predictors influencing (jio) variation using the probability of direction (pd) measure. A predictor was considered to have a meaningful effect on the dependent variable (e.g., likelihood of using jio) if its median estimate was substantively distant from zero or if its credibility intervals excluded zero. The probability of direction (pd) – defined as the proportion of posterior draws that share the sign of the median – serves in this study as a probabilistic measure of effect existence and certainty. A pd value approaching 1 suggests strong evidence for an effect in the indicated direction (positive or negative), whereas a pd near 0.5 implies that the effect may be negligible or non-existent (Makowski et al. Reference Makowski, Ben-Shachar, Chen and Lüdecke2019). For instance, if a predictor’s median estimate in our model is −1.2 with a pd of 0.95, this indicates that 95 per cent of the posterior distribution falls below zero, while only 5 per cent of values exceed zero (Levshina Reference Levshina2016). Given that jio was coded as the reference category, this would imply a 95 per cent probability that the predictor in question reduces the likelihood of selecting the jio variant.
4.2 Results
We first present the results of the frequency distribution analysis to establish the presence of variation, which serves as a necessary justification for the use of regression while also providing readers with an overview of the variability under investigation. We then introduce the regression model, outlining its key features. Following this, we evaluate the model’s predictive accuracy and other relevant metrics before proceeding to a detailed analysis of (jio) variation as conditioned by the factors of interest.
4.3 (Jio) Variation: Frequency Distribution Analysis
Before proceeding with the regression analysis, it is crucial to establish evidence of variation in the use of (jio) and present an overview of variation patterns involving (jio). The frequency analysis presented in Table 9 demonstrates that speakers exhibit a preference for the English-derived invite (59.59%) over the Hokkien-derived jio (40.41%). However, this distribution is not heavily skewed in favour of invite, as the difference is relatively modest – approximately 10 percentage points – suggesting that jio remains a salient and productive variant within the linguistic repertoire of speakers. A closer examination of variation by negation context reveals a systematic pattern: while invite is favoured in affirmative contexts, jio predominates in negated constructions. Crucially, the majority of tokens in negated contexts occur in the lexicalised expression bojio, a case of what Labov (Reference Labov1972) characterises as ‘stable variation’, in which speakers consistently alternate between variants in accordance with social or discursive constraints. This distribution suggests that the selection of jio in negation contexts is not arbitrary but reflects an embedded social constraint shaping its use.
| Negated | Non-negated | Total | |
|---|---|---|---|
| Invite | 274 (27.18%) | 3,078 (66.67%) | 3,352 (59.59%) |
| Jio | 734 (72.82%) bojio: 466 (46.23%) never, no, not, don’t: 268 (26.59%) | 1,539 (33.33%) | 2,273 (40.41%) |
| Total | 1,008 (100%) | 4,617 (100%) | 5,625 (100%) |
4.4 (Jio) Variation: Regression Analysis
4.4.1 General Introduction
The Bayesian model helps clarify which factors make speakers more or less likely to use (jio) rather than its alternative. Table 10 reports the model’s posterior estimates, with the median values indicating the direction and typical size of each effect (positive values increase the likelihood of (jio), negative values decrease it). Importantly, all predictors show a high probability of direction (pd > 0.95), meaning that the model is highly confident about the direction of each effect.
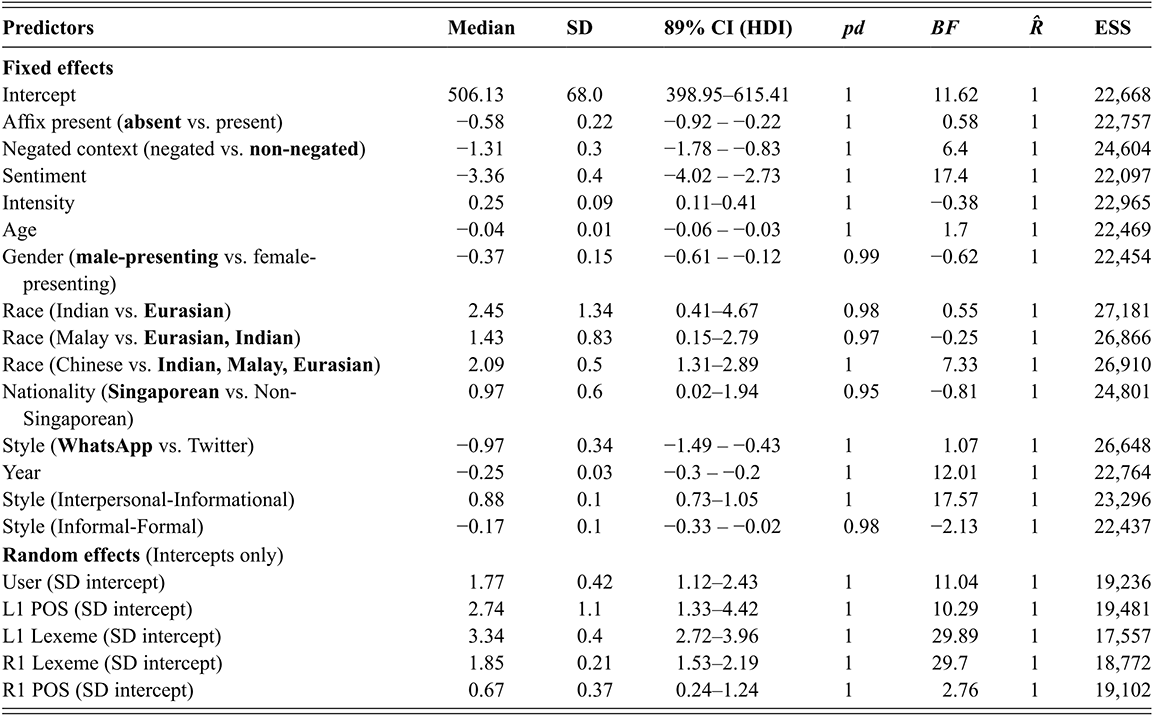
Table 10 Long description
Posterior estimates from the Bayesian model, divided into fixed and random effects. For both effect types, the median, standard deviation, 89% confidence interval, probability direction, Bayes factor, R-hat and effective sample size are given. The fixed effects include the intercept, affix presence, negation context, sentiment, intensity, age, gender, race, nationality, style (WhatsApp versus Twitter), year, style (interpersonal versus informational) and style (informal versus formal). The random effects are the user ID, as well as the part of speech and the lexeme in the left and right context of the search term.
A clear quantitative pattern emerges when comparing groups of predictors. Intralinguistic factors have larger effects on average (mean absolute median n = 1.75, SD = 1.11) than socio-stylistic factors (mean n = 1.15, SD = 1.02). This means that grammatical and structural conditions exert a stronger pull on speakers’ choices, while social and stylistic factors still matter but operate more subtly. In practical terms, structure sets the main limits on where (jio) is likely to appear, and social meaning fine-tunes usage within those limits.
4.4.2 Model Predictions and Accuracy
To check how reliable the model’s results are, we tested how well it predicts new data that were not used to fit the model. Specifically, we compared the model’s predictions to the actual choices speakers made in a held-out test dataset (n = 1,406). This comparison is summarised in a confusion matrix (Table 11), which simply shows how often the model correctly predicts each variant and where it makes mistakes. The model predicts speakers’ choices very well: it correctly identifies the observed variant in about 94 per cent of cases (Table 12). This performance is far better than a simple baseline strategy of always guessing the most frequent variant (invite), which would be correct only 59 per cent of the time. Statistical tests confirm that this improvement is not due to chance (p(Acc > baseline) < 0.001; McNemar’s p < 0.001), and the high Kappa value (0.87) indicates strong agreement between the model’s predictions and the observed data beyond what would be expected by chance. In practical terms, these results show that the model has learned systematic patterns in how speakers choose between jio and invite, instead of merely memorising the training data. Its strong performance on unseen data indicates that the predictors included in the model provide a robust account of variation and generalise well beyond the specific dataset analysed here, supporting the validity of the analysis.
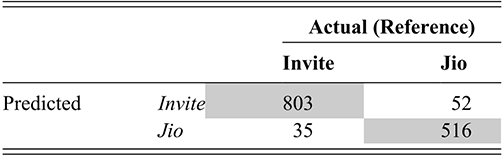
Table 11 Long description
In this matrix, the actual and predicted values for the variants jio and invite are compared: the actual reference values are the columns, and the predicted values are the rows.
| Measure | Value |
|---|---|
| n | 1,406 |
| Acc. (Bal. Acc.) | 0.94 (0.93) |
| CI [Acc] | 0.92–0.95 |
| NIR | 0.59 |
| p [Acc > NIR] | <0.001 |
| ρ | 0.87 |
| CI [ρ] | 0.86–0.88 |
| t | 66.5 |
| p [ρ] | <0.001 |
4.4.3 Structural/Linguistic Constraints on (Jio)
The analysis reveals that affix presence exerts minimal influence on the selection between the Hokkien-derived variant jio and the English-derived invite, where the use of Hokkien-derived jio is slightly more preferred when (jio) is not affixed (Figure 11a). The lack of a stronger effect is somewhat unexpected, as morphological factors often play a strong role in constraining variation, particularly in contact settings where phonological or morphosyntactic integration can influence borrowing patterns (Szmrecsanyi Reference Szmrecsanyi2006; Gonzales Reference Gonzales2025a). However, in this case, the relative stability of jio use regardless of affix presence suggests that speakers may not perceive affixation as a meaningful constraint on variant selection.
Marginal effects of structural factors on jio usage. The y-axis shows the model-estimated probability that jio is used rather than invite, with 100 per cent indicating a categorical preference for jio. Panels display posterior predicted probabilities as a function of (a) affix presence, (b) negation, (c) sentiment polarity, and (d) sentiment intensity, holding all other predictors constant. Points and lines represent predicted values, and error bars and shaded bands indicate 95 per cent credible intervals.
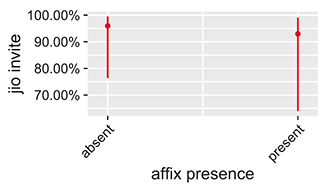
Figure 11a Long description
Figure 11(a) shows model-predicted probabilities of using jio rather than invite. The y-axis ranges from 0 percent to 100 percent and represents predicted probability, with error bars or shaded areas indicating 95 percent credible intervals. The graph compares affix absence and presence; both show high predicted probabilities with overlapping uncertainty.
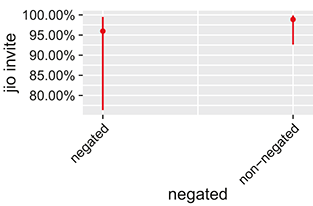
Figure 11b Long description
Figure 11(b) shows model-predicted probabilities of using jio rather than invite. The y-axis ranges from 0 percent to 100 percent and represents predicted probability, with error bars or shaded areas indicating 95 percent credible intervals. The graph compares negated and non-negated contexts; both have high predicted probabilities, with greater uncertainty for negated contexts.
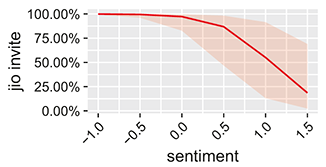
Figure 11c Long description
Figure 11(c) shows model-predicted probabilities of using jio rather than invite. The y-axis ranges from 0 percent to 100 percent and represents predicted probability, with error bars or shaded areas indicating 95 percent credible intervals. The graph plots sentiment polarity; predicted probability decreases as sentiment becomes more positive, with wider uncertainty at higher values.
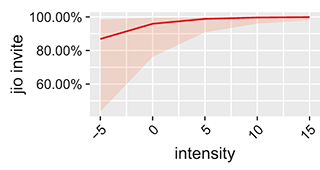
Figure 11d Long description
Figure 11(d) shows model-predicted probabilities of using jio rather than invite. The y-axis ranges from 0 percent to 100 percent and represents predicted probability, with error bars or shaded areas indicating 95 percent credible intervals. The graph plots sentiment intensity; predicted probability increases with intensity and approaches near-maximal levels, with wider uncertainty at low intensity.
Negation shows a nuanced effect on jio usage once model-based predictions are considered. While raw frequencies indicate that jio is more common than invite in negated contexts overall (Table 9), the marginal effects in Figure 11b reveal that non-negated contexts exhibit a higher and more stable predicted likelihood of jio usage, as indicated by the tighter uncertainty interval. In contrast, negated contexts display greater variability in predicted probabilities, suggesting that negation does not uniformly favour jio across interactional settings. This divergence reflects the difference between aggregate distributional tendencies and conditional effects estimated by the model. The wider uncertainty associated with negated contexts likely arises from heterogeneity within the negation category, which subsumes both relatively fixed expressions such as bojio and more compositional constructions (e.g., not jio and never jio). These subtypes differ in their degree of routinisation and pragmatic function, resulting in less consistent model predictions. By contrast, non-negated jio usage appears more regular and contextually stable, yielding higher and more consistent predicted probabilities. These results collectively suggest that negation does not categorically license jio, but rather introduces context-dependent variability, whereas non-negated environments support a more uniform preference for jio in the lexical alternation with invite.
The results for sentiment introduce a gradient social constraint that is implemented as a continuous structural predictor in the model, with jio being strongly associated with negative sentiment and invite emerging as the preferred variant in more positive contexts (Figure 11c). In this sense, sentiment occupies an intermediate position: it is social in its interpretation (indexing affective stance), but structural in its formal treatment as a scalar constraint on variant selection. This pattern is consistent with sociolinguistic work demonstrating that linguistic variants often carry affective or evaluative meanings, linking language choice to stance-taking and social positioning (Kiesling Reference Kiesling2018; Pratt Reference Pratt2023). The association between jio and negative sentiment aligns with its frequent use in complaint-driven discourse, further reinforcing its pragmatic function in expressing exclusion or missed opportunities. However, the increasing variability in jio use at the more positive end of the sentiment scale suggests that speakers are not entirely constrained by sentiment alone, indicating that affective stance sets probabilistic tendencies rather than categorical limits, and leaving room for context-dependent variation.
Finally, the effect of intensity, while statistically significant, appears more subtle after an examination of median values. The trend suggests that as emotional intensity increases, speakers are more likely to use jio (Figure 11d), though the absolute-value effect (media n = 0.25) is weaker compared to negation (media n = −1.31) and sentiment (media n = −3.36). This suggests that speakers may prioritise conveying their attitudes or evaluations over merely reflecting the intensity of their emotions in their linguistic choices. Therefore, the current finding that affective stance exerts a stronger influence than intensity is consistent with previous research in variationist sociolinguistics. Another possible explanation is that intensity interacts with other factors, such as discourse framing or interlocutor expectations, which were not directly tested in the current model. This suggests avenues for future research that could explore whether jio is particularly sensitive to pragmatic or interactional constraints beyond those captured here.
Collectively, these findings reinforce the idea that linguistic variation is shaped by structural constraints, with jio serving not merely as an interchangeable alternative to invite but as a variant whose use is systematically conditioned by negation, sentiment/affect, and to a lesser extent, intensity. While some results, such as the role of negation, were expected based on previous research, the minimal influence of affix presence and the relatively weak effect of intensity suggest that additional factors, such as discourse context and pragmatic function or even socio-stylistic factors, may be at play in shaping jio variation.
4.4.4 Socio-Stylistic Constraints on (Jio)
Figure 12 presents the effects of key socio-demographic factors – age, gender, race, and year– on the variation between jio and invite. The results for age (Figure 12a) reveal a gradual decline in jio use as speaker age increases. Younger speakers exhibit the highest rates of jio usage, while older speakers show a clear shift towards invite. This pattern suggests that jio is more robustly maintained among younger individuals but becomes less frequent with age, aligning with research on age-based variation, where younger speakers tend to favour innovative or localised forms while older speakers conform more closely to dominant linguistic norms (Meyerhoff Reference Meyerhoff2018).
Marginal effects of socio-stylistic factors on jio usage. The y-axis shows the model-estimated probability that jio is used rather than invite, with 100 per cent indicating a categorical preference for jio. Panels display posterior predicted probabilities as a function of (a) age, (b) gender, (c) race (simplified categories), and (d) year of production, holding all other predictors constant. Lines and points represent predicted values, while error bars and shaded bands indicate 95 per cent credible intervals.
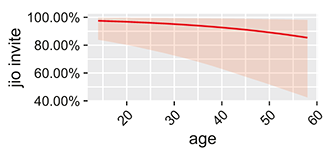
Figure 12a Long description
Figure 12(a) shows model-predicted probabilities of using jio rather than invite. The y-axis ranges from 0 percent to 100 percent and represents predicted probability, with error bars or shaded regions indicating 95 percent credible intervals. The graph plots age, showing a gradual decline in predicted probability of jio usage with increasing age.
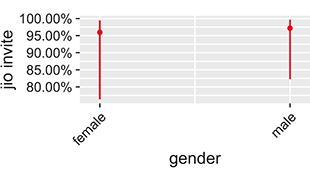
Figure 12b Long description
Figure 12(b) shows model-predicted probabilities of using jio rather than invite. The y-axis ranges from 0 percent to 100 percent and represents predicted probability, with error bars or shaded regions indicating 95 percent credible intervals. The graph compares gender categories; both female and male groups show high predicted probabilities with overlapping uncertainty.
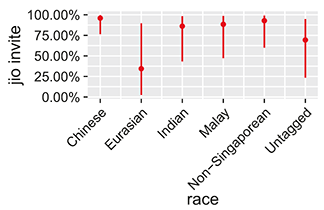
Figure 12c Long description
Figure 12(c) shows model-predicted probabilities of using jio rather than invite. The y-axis ranges from 0 percent to 100 percent and represents predicted probability, with error bars or shaded regions indicating 95 percent credible intervals. The graph compares simplified race categories; predicted probabilities vary across groups, with wider uncertainty in non-Chinese groups.
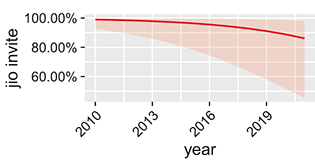
Figure 12d Long description
Figure 12(d) shows model-predicted probabilities of using jio rather than invite. The y-axis ranges from 0 percent to 100 percent and represents predicted probability, with error bars or shaded regions indicating 95 percent credible intervals. The graph plots year, showing a gradual decline in predicted probability of jio usage over time, with increasing uncertainty in later years.
From a sociolinguistic perspective, this age pattern can be interpreted in two theoretically distinct ways, depending on how community norms are assumed to behave over time. Under an age-grading account, individuals change their linguistic behaviour across the life course, but community-level norms remain stable: each new generation would be expected to use jio at similarly high rates when young and to reduce usage as they age. Under a lifespan effect account, by contrast, individuals shift their usage in response to changing community norms, such that both individuals and the community distribution change over time. In this scenario, younger cohorts could use jio less than earlier cohorts did at the same age, signalling community-level change rather than stable age stratification. The present data cannot adjudicate conclusively between these interpretations, as doing so would require panel or real-time evidence, but the results nonetheless show that age is a strong and systematic predictor of jio variation, with important implications for its long-term vitality in speakers’ repertoires.
If we examine the change in real time instead of apparent time (Figure 12d), we also find that jio usage shows a steady decline over time. While jio was more evenly distributed with invite in the early 2010s, its use has steadily decreased, particularly after 2017. This downwards trajectory suggests an overall shift towards invite, raising the possibility that jio is undergoing recession in favour of its English-derived alternative. This trend is further corroborated in Figure 13, which provides a year-by-year breakdown of jio and invite use. In earlier years, jio and invite were used at comparable rates, but by 2021, jio had nearly disappeared from the dataset. The accelerated decline of jio in recent years suggests that while it may have once been a stable variant, it is now becoming increasingly restricted in use. This pattern is in line with broader studies of lexical shift in contact varieties, where localised forms may recede due to ongoing globalisation and the increasing dominance of English.
Change in (jio) over time
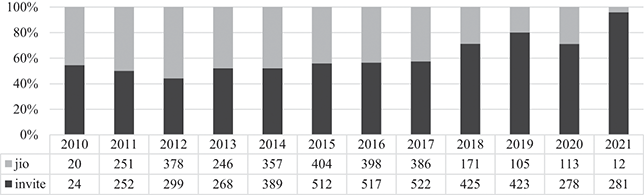
Figure 13 Long description
Percentages are displayed along the y-axis. On the x-axis are the twelve years, from 2010 to 2021. The stacked bars are colour-coded by value with jio (light grey) and invite (dark grey). Under the chart is a data table with the following counts. 2010: jio (20), invite (24). 2011: jio (251), invite (252). 2012: jio (378), invite (299). 2013: jio (246), invite (268). 2014: jio (357), invite (389). 2015: jio (404), invite (512). 2016: jio (398), invite (517). 2017: jio (386), invite (522). 2018: jio (171), invite (425). 2019: jio (105), invite (423). 2020: jio (113), invite (278). 2021: jio (12), invite (281).
Turning to gender (Figure 12b), the results show no meaningful difference in jio use between male and female speakers, as indicated by overlapping confidence intervals. This finding contrasts with much of the variationist literature, which frequently identifies gender-based differentiation, particularly when a variant carries strong social or indexical associations (Eckert Reference Eckert1989; Gonzales et al. Reference Gonzales, Chan, Zhang and Ng2026). The absence of a significant gender effect suggests that jio is not strongly linked to masculinity or femininity and may function as a broadly available linguistic resource for expressing other identities, which is consistent with research on gender and language contact (Meyerhoff & Birchfield Reference Meyerhoff, Birchfield, Darquennes, Salmons and Vandenbussche2019).
Ethnolinguistic background (Figure 12c) emerges as a more salient predictor, with jio use being highest among Chinese speakers and significantly lower among other ethnic groups. While Eurasian, Indian, and Malay speakers display a more balanced distribution between jio and invite, non-Singaporeans overwhelmingly favour invite. Although the presence of jio among non-Chinese speakers suggests some degree of diffusion, its lower frequency among these groups reinforces its continued association with Chinese linguistic heritage.
In addition to socio-demographic constraints, stylistic factors also play a significant role in shaping jio variation. Figure 14 examines the influence of style, revealing distinct patterns across the informational–interpersonal dimension, which is analytically independent from the formal–informal dimension. To clarify this distinction, two stylistic dimensions, formal–informal and informational–interpersonal, were derived separately based on the primary linguistic parameters identified by Grafmiller et al. (Reference Grafmiller, Szmrecsanyi, Röthlisberger and Heller2018) for English, allowing these dimensions to vary independently rather than being treated as opposites.
Marginal effects of sociolinguistic style on jio usage. The y-axis shows the model-estimated probability that jio is used rather than invite, with 100 per cent indicating a categorical preference for jio. Panels display posterior predicted probabilities across levels of (a) informational style and (b) formal style, holding all other predictors constant. Solid lines represent predicted values, and shaded bands indicate 95 per cent credible intervals.
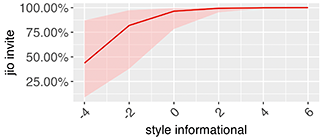
Figure 14a Long description
Figure 14(a) shows model-predicted probabilities of using jio rather than invite. The y-axis ranges from 0 percent to 100 percent and represents predicted probability; shaded regions indicate 95 percent credible intervals. The graph plots informational style, showing an increase in predicted jio usage as informational style values rise, approaching near-maximal probabilities at higher values.
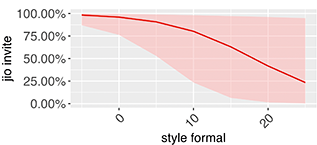
Figure 14b Long description
Figure 14(b) shows model-predicted probabilities of using jio rather than invite. The y-axis ranges from 0 percent to 100 percent and represents predicted probability; shaded regions indicate 95 percent credible intervals. The graph plots formal style, showing a decrease in predicted jio usage as formality increases, with wider uncertainty at higher values.
In highly informational styles (Figure 14a), jio is used at higher rates, with usage increasing as the level of informational content rises. Importantly, this is not a contrast between formal and informal styles: texts can be highly informational while also being formal, and vice versa, as established in multidimensional models of register variation. This suggests that jio is preferred in more communicative settings, where speakers engage in high-information exchanges that prioritise efficient transmission of content rather than interpersonal or presentational concerns. This pattern aligns with Bell’s (Reference Bell1984) audience design framework, which posits that speakers modulate linguistic choice in response to communicative context.
By contrast, formal discourse (Figure 14b) exhibits the opposite trend, with jio usage declining as formality increases. At the highest levels of formality, invite is overwhelmingly preferred, suggesting that it is perceived as the more standard or socially neutral variant. This result is expected given long-standing findings that formal speech styles tend to favour standard or English-derived forms over localised variants (Labov Reference Labov1972). The association between jio and informality suggests that it may be socially marked in a way that invite is not, further reinforcing the idea that jio is undergoing stylistic restriction.
4.5 Summary
The use of the innovative jio in CSE, in contrast with its counterpart invite, shows variation along structural and socio-stylistic axes. Here, ‘innovative’ refers to the relatively recent emergence of jio in the CSE repertoire, instead of its current direction of change. Model-based analyses qualify the apparent association between negation and jio: while raw distributions suggest a higher frequency of jio in negated environments, likely reflecting the early entrenchment of the borrowed form bojio, the marginal effects reveal that non-negated contexts in fact support a higher and more stable predicted likelihood of jio usage. Negated contexts, by contrast, show greater variability because, unlike bojio, these forms are not stored as fixed expressions but are constructed through ordinary negation, making their use more flexible and less predictable.
The sentiment and intensity measures are consistent with explicatory models of language contact, in which borrowed forms initially circulate in affectively marked niches before being redistributed. Apparent-time patterns showing higher jio use among younger speakers support the interpretation of jio as a relatively recent addition to the CSE vocabulary. At the same time, the real-time decline documented earlier suggests that this innovation seems reminiscent of an undergoing process of dialect focussing (Trudgill Reference Trudgill1974b): instead of continuing to spread, jio is becoming increasingly restricted to particular ethnolinguistic groups, pragmatic functions, and interactional contexts. In this view, decline does not contradict innovation but reflects the narrowing and stabilisation of a previously diffuse variant as community norms consolidate.
The continued ethnolinguistic bias towards jio use among Chinese speakers, together with its decrease over real time, therefore suggests focussing rather than attrition, with jio persisting as a socially meaningful and locally indexed resource even as its overall frequency drops. In the next section, these issues are explored in the context of passive marking in CSE, for which several competing options are available.
5 Variation and Change in CSE Passive Marking
5.1 Introduction to Passives in CSE
This section focusses on passive constructions in CSE, which have received some scholarly attention in the literature (e.g., Bao & Wee Reference Bao and Wee1999; Fong Reference Fong and Lim2004; Lee, Ping, & Nomoto Reference Lee, Ping and Nomoto2009; Bao Reference Bao and Lefebvre2011; Kim & Sato Reference Kim and Sato2013). Bao and Wee (Reference Bao and Wee1999) and Fong (Reference Fong and Lim2004) argue that, in addition to two ‘standard’ English-derived passives containing be (12) and get (13), CSE speakers have innovated two passive(-like) constructions due to influence from locally prominent substrate languages: the kena passive (14), due to influence from Malay; and the give passive (15), due to influence from Sinitic languages such as Cantonese, Hokkien, and Mandarin.
(12) Be passive
John was scolded by his boss.
(Fong Reference Fong and Lim2004: 97)
(13) Get passive
How many got arrested?
(Fong Reference Fong and Lim2004: 97)
(14) Kena passive
The thief kena catch by the police
‘The thief was caught by the police.’
(Bao & Wee Reference Bao and Wee1999: 1)
(15) Give passive
John give his boss scold
‘John was scolded by his boss.’
(Bao & Wee Reference Bao and Wee1999: 5)
Bao and Wee (Reference Bao and Wee1999) note that the substrate-derived passive constructions (14)–(15) carry an adversative reading absent from standardised English passives (12)–(13). Thus, kena and give passives fulfil a distinct function from be- and get-passives in CSE and can be seen as competing constructions within its emerging grammar. They further propose that, in a language contact situation, between two competing variants of the same construction, speakers will favour the variant that ‘most closely resembles in structure’ the standard form (Bao & Wee Reference Bao and Wee1999: 9). Applying this to the context of Singapore English, this predicts that the kena passive will win out over the give passive, as the kena passive is more similar in word order to the standard be- and get-passives, sharing the structure patient passive.marker V-en by agent.
In this section, we revisit Bao and Wee’s (Reference Bao and Wee1999) prediction – proposed over a quarter of a century ago – by examining passive constructions in CoSEM. Our findings show that the kena passive is robustly attested in CoSEM, whereas the give passive is entirely absent. The robustness of the kena passive alongside the absence of the give passive in CoSEM lends support to Bao and Wee’s prediction, suggesting that the inventory of passive constructions in CSE has stabilised. However, we also document the emergence of a novel passive construction that challenges this notion. This construction, which appears in a small set of CoSEM examples, involves the lexical item tio, derived from a passive marker in the Southern Min varieties of Hokkien and Teochew that we will transcribe as tioh (/tioʔ/ in Hokkien and Teochew, also /tieʔ/ in certain Teochew varieties).Footnote 7 In the rest of this section, we will use tioh to refer to the Southern Min morpheme and tio to its CSE counterpart.
The emergence of the tio passive indicates that the passive system in CSE remains dynamic. To account for its emergence, we point to structural similarities between standardised English passives, kena passives, and the Southern Min tioh passive construction. An analysis of the uses of Southern Min tioh further reveals semantic similarities between English get and Malay kena. These facts lead us to suggest that the adoption of a variant might not only be dependent on structural similarities (as Bao and Wee suggest), but also on semantic similarities.
Since kena and tio but not give passives are attested in CoSEM, Section 5.2 begins with an overview of the use of kena and tio passives in CSE, comparing the CSE kena passive to how kena is used in Malay and the CSE tio passive to how its counterpart tioh is used in Singapore Southern Min varieties. Section 5.3 outlines the methods of our study, detailing how passive constructions were identified and extracted from CoSEM, how the sample was constructed, and how the dataset was coded for sentiment analysis. Section 5.4 presents and discusses the results of our study. Finally, Section 5.5 concludes by considering factors that may have contributed to the emergence of the tio passive in CSE, and the relatively low frequency of kena and tio passives in our data.
5.2 Overview of Kena and Tio Passives
5.2.1 Kena Passives in CSE
The use of the Malay-derived kena passive in CSE was first reported by Bao and Wee (Reference Bao and Wee1999), who also asserted that it was more frequently used than the give passive. Similar to the standard be and get passives, in the CSE kena passive construction, the theme or patient Noun Phrase (NP) is promoted to subject, while the agent NP is optionally expressed as an oblique argument using a by-phrase. The kena passive in both Malay and CSE also usually involves an adversative reading. Examples (16) and (17) are taken from Bao and Wee (Reference Bao and Wee1999), demonstrating this documented use of the kena passive in CSE.
(16) The thief kena caught by the police
‘The thief was caught by the police.’
(Bao & Wee Reference Bao and Wee1999: 2)
(17) The durian kena eaten already
‘The durian got eaten already.’
(Bao & Wee Reference Bao and Wee1999: 2)
Examples (18), (19), (20), and (21) are taken from CoSEM, and they show how the kena passive is still attested in present-day CSE.
(18) Cried bc kena scolded by ms <name>
‘He cried because he got scolded by Ms <name>.’
<COSEM:21DC45-1514-19SGCHFST-2018>
(19) More and more ppl kena quarantined
‘More and more people are being quarantined.’
<COSEM:21DC09-9133-42SGCHFGH-2020>
(20) I kena cut from the team
‘I was cut from the team.’
<COSEM:19CF10-5176-23SGCHM0A-2018>
(21) Tmr my dinner kena cancelled so I can MAHJONG
‘My dinner tomorrow got cancelled, so I can play mahjong.’
<COSEM:18CF42-3081-23SGMAF00-2017>
5.2.2 Kena in Malay
Kena in Malay may function as a passive marker,Footnote 8 as seen in (22)–(24). In the Malay kena passive construction, the agent can be omitted as shown in (22) and (23), and may also be expressed as an oblique argument using oleh as shown in (24).
(22)
Aminah kena tampar Aminah pass slap ‘Aminah got slapped.’ (Nomoto & Kartini Reference Nomoto and Kartini2012: 364)
(23)
Dompet aku kena curi semalam purse 1sg.poss pass steal yesterday ‘My purse got stolen yesterday.’ (Nomoto & Kartini Reference Nomoto and Kartini2012: 364)
(24)
Pencuri itu kena tangkap oleh polis semalam thief that pass catch by police yesterday ‘That thief was caught by the police yesterday.’ (Nomoto & Kartini Reference Nomoto and Kartini2012: 367)
Note that kena possesses other functions in Malay. First, as shown in (25) and (26), kena can be used to express a deontic reading similar to ‘have to’ in English (see Nomoto and Kartini Reference Nomoto and Kartini2012 for more discussion on potential polysemy between these functions of kena in Malay).
(25)
Nak kena bongkar kat rumah will deo ransack at house ‘(I) will have to ransack the house.’ <COSEM:18MF03−19411−23SGMAF00−2017>
(26)
saya kena bikin kuih 1sg deo make snack ‘I have to make snacks.’ <COSEM:18MF03−14392−23SGMAF00−2017>
Kena can also be used as a verb to mean ‘to strike or be struck by’ or ‘to receive or be subjected to’. As a verb, kena is followed by an NP object, as seen in (27) and (28).
(27)
kereta-nya kena tiang eletrik car-poss hit pole electric ‘His car hit the electric pole.’ (Dewan Bahasa dan Pustaka Reference dan Pustaka2010: 735)
(28)
kena penyakit demam kepialu receive illness fever typhoid ‘(He) contracted typhoid fever.’ (Dewan Bahasa dan Pustaka Reference dan Pustaka2010: 735)
Lastly, kena also serves as an adjective that roughly means ‘suitable, right’, as seen in (29) and (30).
(29)
Warna baju Aminah kena dengan warna selendang-nya colour clothes Aminah suitable with colour shawl-poss ‘The colour of Aminah’s clothes matches that of her shawl.’ (Nomoto & Kartini Reference Nomoto and Kartini2012: 366)
(30)
Dia menjadi berang kalau ada sesuatu yang tidak kena 3sg become furious if exist something that not right di hati-nya at heart-poss ‘She becomes furious if there is something that is not right in her heart.’ (Nomoto & Kartini Reference Nomoto and Kartini2012: 366)
Of these functions, this section will primarily focus on the use of kena as an adversative passive marker (Bao & Wee Reference Bao and Wee1999), which is well-attested in the CoSEM data set. However, it is pertinent to note that kena as a verb – meaning ‘to be subjected to’ – can also be found in CSE, as seen in the CoSEM examples (31) and (32). In these examples, CSE kena co-occurs with an NP object. This is in contrast with the passive marker kena, in which kena must precede the main verb.
(31) wah I kena sore throat
‘Damn, I got a sore throat.’
<COSEM:19SF01-47194-20SGSIFNA-2018>
(32) I hope u kana car accident
‘I hope you get caught in a car accident.’
<COSEM:18CF52-15075-23SGCHM00-2017>
It is also worth noting that the ‘have to’ or deontic function of kena can be found, albeit to a smaller extent, in some CSE utterances in CoSEM, as shown in (33) and (34).
(33) Yeah kena wait for 2nd round
‘Yeah (you) have to wait for the second round.’
<COSEM:18MF03-11905-24SGMAF00-2017>
(34) all kena scan IC
‘(They) all had to scan their identity cards.’
<COSEM:19MM02-206-42SGMAM00-2019>
5.2.3 The Tio Passive in CSE
The tio passive construction was not mentioned in Bao and Wee’s (Reference Bao and Wee1999) study, and appears to be a relatively new feature of CSE. As such, it has not, to our knowledge, been studied in contemporary CSE research. Interestingly, the online dictionary Wiktionary does list tio as a lexical item of CSE, describing one of its functions as that of a passive marker (Wiktionary 2025). In this section, we present a more thorough description of the tio passive in CSE based on our findings from CoSEM.
In the corpus, tio is used similarly to be and get passives, as shown in examples (35) and (36). On the surface, tio is used in place of the standardised English passive markers, be and get.
(35) Can not say later i tio scolded again hahaha
‘I can’t say, otherwise I’ll get scolded again.’
<COSEM:17CF24-5711-26SGCHM00-2015>
(36) Wah today station games tio squeezed by guys
‘Today at the station games, I got squeezed by guys.’
<COSEM:17CF34-61588-21SGCHF00-2013>
Notably, example (36) shows the tio passive co-occurring with the optional by-phrase, by guys, which contains the agent argument. This is interesting since tioh passive constructions in Singapore Hokkien and Teochew, which we argue in what follows is the source of the tio passive construction in CSE, may not contain an oblique argument identifying the agent.
5.2.4 Tioh in Singapore Southern Min
There are three major varieties of Southern Min spoken in Singapore: Hokkien, Teochew, and Hainanese. Hokkien and Teochew can be reasonably identified as the source of CSE tio, as both varieties contain the phonologically similar passive marker /tioʔ/ (or /tieʔ/ in certain Teochew varieties). In contrast, Hainanese does not contain a phonologically similar passive marker,Footnote 9 which suggests that Hainanese is unlikely to be the source of CSE tio. Demographically, Hokkien and Teochew speakers also greatly outnumber Hainanese speakers in Singapore (Department of Statistics Singapore 2020), which further supports the idea that Hainanese has had less of an influence on CSE than Hokkien and Teochew. For these reasons, we will base the following discussion on examples drawn from Singapore Hokkien and Singapore Teochew. As Hokkien and Teochew are closely related varieties, we have tried to pick examples that are intelligible in both varieties. We will henceforth refer to these two varieties as ‘Southern Min’ as a shorthand. The examples discussed here were obtained via consultation with two native speakers of Singapore Hokkien and two native speakers of Singapore Teochew.
In a tioh passive construction such as (37), the passive marker tioh precedes a transitive verb like ‘scold’, and the theme argument appears in the subject position, which precedes tioh. However, unlike the kena passive construction in Malay, the tio passive construction in CSE tio, or the bei passive construction in Mandarin, tioh passives do not allow the expression of an oblique agent. To express the agent in Singapore Southern Min, another passive construction using a marker derived from the verb ‘give’ must be used instead (cf. Bao and Wee’s (Reference Bao and Wee1999) discussion of Cantonese and Hokkien ‘give’ passive constructions).
(37)
ua tioʔ me / phaʔ 1sg tioh scold beat ‘I got scolded/beaten.’
(38)
*ua tioʔ i me / phaʔ 1sg tioh 3sg scold beat Intended: ‘I got scolded/beaten by him/her.’
(39)
ua puŋ / khoʔ i me / phaʔ 1sg give 3sg scold beat ‘I was scolded/beaten by him/her.’ (Teochew)
(40)
ua ho i me / phaʔ 1sg give 3sg scold beat ‘I was scolded/beaten by him/her.’ (Hokkien)
For completeness, it is worth pointing out that there are dialectal differences in whether and how tioh is used as a passive marker in Southern Min more generally. Hing (Reference Hing2019), citing Zhou (Reference Zhou2006: 683), reports that tioh passives are absent in mainland China varieties. However, tioh passives appear to exist in Taiwanese Southern Min (e.g., Lien Reference Lien2001: 191–192; also cited in Ansaldo Reference Ansaldo and Lim2004); Hing (Reference Hing2019, Reference Hing2023) also reports a tioh passive in Penang Hokkien. In both Taiwanese Min and Penang Hokkien, the agent may appear between tioh and the verb, unlike the case in Singapore Southern Min. In other words, the equivalent of example (38) is acceptable in these varieties.
In addition, like Malay kena, Southern Min tioh has other uses: as a deontic modal meaning ‘must’, a lexical verb that might be translated as ‘obtain, get, win’, an adjective meaning ‘correct’, and as an aspectual marker suffixing to verbs, among others (see Lien Reference Lien2001; Hing Reference Hing2019 and references therein). For scope reasons, we will review in detail only the deontic and lexical verb uses, which, as we will see, might explain the emergence of the tio passive in CSE. In the deontic modal use, Singapore Southern Min tioh is often paired with another modal marker ai (in Hokkien, as shown in (41)) (Lien Reference Lien2001; Chappell Reference Chappell, Vittrant and Watkins2019; Hing Reference Hing2019: 152) or ãĩ (Teochew), which variously has desire (‘want, like’), deontic (‘must’), and/or future uses (we tentatively gloss this morpheme as deontic here). However, as (42) shows, ai / ãĩ is not necessary for the modal interpretation.
(41)
ua tioʔ ai khun. 1sg deo deo sleep ‘I must sleep.’ (Hokkien)
(42)
tioʔ! deo ‘[S/he] must!’ (in response to a question like i tioʔ ai khun? ‘Must s/he sleep?’)
Second, tioh can be used as a lexical verb, with a meaning along the lines of ‘obtain’, ‘get’, and ‘win’. This is a generally well-documented usage of tioh in Southern Min, even outside of Singapore (e.g., Lien Reference Lien2001; Ansaldo Reference Ansaldo and Lim2004; Hing Reference Hing2019). In Singapore Southern Min, the verbal use of tioh is prominently associated with winning games of chance (43) and contracting diseases (44). For thoroughness, it should be pointed out that the same verbal use can also be found in CoSEM.
(43)
tioʔ bepio win lottery ‘to win [a prize] in the lottery’
(44)
i bo tioʔ COVID. 3sg neg.perf get COVID ‘S/he did not get (catch) COVID.’
5.2.5 Summary
This section has compared the use of kena in CSE to the use of kena in Malay, and the use of tio in CSE to the use of tioh in Singapore Southern Min (Hokkien and Teochew). While Malay kena can be used as a passive marker, a marker of deontic modality, and a lexical item to mean ‘to match’ or ‘suitable’, CSE kena may only be used as a passive marker. While tioh in Singapore Southern Min can be used as a passive marker, a marker of deontic modality, and a lexical verb meaning ‘to obtain, get, win’, only the passive marker and lexical verb uses are found with CSE tio.
5.3 Passives in CoSEM
Next, we investigated the distribution of CSE passive constructions in CoSEM. A central goal of this investigation is to understand how kena and tio passives are used relative to other passive constructions in CSE, namely, be, get, and give passives. In particular, we sought to test Bao and Wee’s prediction that kena passives will ‘outcompete’ give passives in CSE.
Beyond this, we wanted to use the CoSEM data to address two other questions. The first is a high-level demographic question: who uses which passives, and how frequently? One might expect that the kena passive might have become more widespread among younger speakers if Bao and Wee’s predictions are correct. On the other hand, the newer tio passive, being of Chinese origin, might be more popular with younger Chinese speakers. The second concerns the sentiment-bearing properties of CSE passive constructions – specifically, the extent to which they occur with predicates expressing positive, neutral, or negative sentiment. This latter question addresses the popular claim that kena predominantly conveys an adversative meaning. We have also encountered claims online (e.g., Wiktionary 2025) that tio can be used positively, unlike kena. Since this claim has not been empirically verified and no prior description of the tio passive exists, we take this opportunity to evaluate it as well.
5.3.1 Identifying Passive Constructions in the Corpus
We first wrote a Python script to extract all lines containing kena, tio, give, be, and get, and their various inflected forms (e.g., was and were) and alternative orthographic forms (e.g., kana for kena). Each message was then slightly preprocessed to remove emojis and standardise characters (e.g., quotation marks), which are known to affect the accuracy of statistical parsing. The preprocessed messages were then parsed with a version of the Stanford Parser (Klein & Manning Reference Klein and Manning2003 and subsequent work) customised for CSE – this was done by training the Stanford Parser on CSE parses manually validated by Bao, Huang, and colleagues in another CSE corpus project (see Lin et al. Reference Lin, Han and Hing2023; Huang et al. Reference Huang, Lin and Han2025). The parser parsed and generated phrase structure trees for all preprocessed lines except those that contain forty words or more, as these tend to create memory issues and cause the parser to crash. We note that lines of this length or greater are very rare, making up 0.3 per cent of all lines.
We then wrote another Python script to check each generated syntax tree. This was particularly important for the be and get tokens, since not all instances of be and get appeared with passives; be, of course, can appear with the present participle (a hypothetical standard English example: They will be leaving). The Python script extracted only tokens of be and get that co-occur with a VP headed by what the parser tagged as a past participle.
Within this initial sample, be and get were by far the most frequent markers. Their extremely high frequencies made a full annotation of them infeasible. As such, we extracted a 10 per cent random sample of the be and get parses. A linguistics-trained research assistant checked these samples and identified tokens that were genuine verbal passives. This was necessary because the parser is not perfectly accurate and might have made mistakes with tagging or parsing. A second reason is that the parser is also not always able to differentiate verbal passives from adjectival passives, as in tired in They are/got tired, which we consider to be adjectives rather than verbs. We excluded tokens that were clearly adjectival, where we can felicitously insert a degree adverb like ‘very’ immediately before the word (e.g., They are/got very tired).
The Python script also extracted all tokens of give co-occurring with a VP or clause as potential give passive tokens. Manual inspection, however, showed these to be parser errors; we did not find any tokens of genuine give passives.
Because the set of kena and tio tokens extracted was relatively small (kena: 673 tokens; tio: 94 tokens), we did not do any random sampling. However, we note that kena and tio, not unlike be, get, and give, also have non-passive uses, in which case they do not occur with verbs. As mentioned earlier, CSE kena can be a verb, as in I kena COVID ‘I got COVID’. To exclude these non-passive uses, the research assistant reviewed the full set of tokens, sorting them based on whether they appeared with verbs, NPs, intransitive, or other frames.
Table 13 lists the count of tokens for be, get, kena, and tio passives with unambiguous verb frames in our final sample. With this, we ran a multinomial regression with age, gender, and race as predictors, and choice of passive marker as the dependent variable, setting be-passive as the reference ‘standard’ category. For thoroughness, we created a reweighted data set that synthetically increased the be and get tokens ten times, so that the number of be and get tokens in this reweighted sample more accurately represents the actual distribution of passive markers. For visualisation purposes, we used the reweighted sample to generate all figures. We also re-ran the regression model on this reweighted sample and obtained qualitatively similar results.
| Passive Marker | Tokens in sample (10% for be and get) | Tokens in reweighted sample |
|---|---|---|
| be | 415 (47.6%) | 4,150 (70.6%) |
| get | 141 (16.2%) | 1,410 (24.0%) |
| kena | 282 (32.3%) | 282 (4.8%) |
| tio | 34 (3.9%) | 34 (0.0%) |
| Total | 872 (100%) | 5,876 (100%) |
5.3.2 Coding for Sentiment
We coded this dataset for sentiment by referring to only the action or state described by the verb and ignoring all other contextual information. For example, we would consider all tokens of paid as positive, even in contexts like getting paid peanuts or didn’t get paid, which most might consider as describing negative outcomes (note that these are hypothetical examples to illustrate the point). We do so because we judge that kena can be used for a verb with negative sentiment, even when the broader context has a positive sentiment, as illustrated by disqualified in the hypothetical sentence My favourite team didn’t kena disqualified ‘My favourite team didn’t get disqualified’.
All tokens identified were coded as ‘negative’, ‘positive’, or ‘neutral’ by the same linguistics-trained student research assistant and one of the authors (either Mohamed Hafiz or Nick Huang); some examples for the be-passive are shown in (45). We chose to manually annotate for sentiment here, instead of using software (cf. Section 3 on jio). This is because we were interested in the sentiment expressed through the verb itself, and a number of verbs in our sample are of Malay or Chinese origin (e.g., tekan ‘to treat poorly, to bully’, from Malay; buah ‘to scrape’, from Southern Min) or are English words that have acquired novel uses (e.g., arrow ‘to nominate [someone] for an undesirable task’). To ensure accurate annotation, we decided against using software, which is usually targeted at standard English varieties. In order to keep the process of manual annotation straightforward, we decided on a three-way categorical scheme, instead of a finer-grained one. Results reported in Section 5.4 are based on the research assistant’s annotations, but we note that there was a relatively high degree of inter-annotator agreement (Cohen’s kappa of .77).
(a)
Pls slowly do carefully and check if we miss out anything or if it can be improved. (Positive because of improve) ‘Please do [the survey] slowly and carefully and check if we missed out anything or if it can be improved.’ <COSEM:17CM05−8172−23SGCHM00−2016> (b)
i am being abused now (Negative because of abuse) <COSEM:17CF12−65931−21SGCHM00−2016> (c)
I hope the stuff im writing can be absorbed in (Neutral because of absorb) <COSEM:17CF34−54907−21SGCHF00−2015>
5.4 Results and Discussion
5.4.1 Relative Frequencies of Passive Constructions
As shown in Table 13, no give passives were found in CoSEM, suggesting that the construction might have fallen out of use for younger CSE speakers. This supports Bao and Wee’s (Reference Bao and Wee1999) prediction. It is also not unexpected, given Bao and Wee’s original observation that the give passive was not as robust compared to the kena passive at the time of their study. Tio passives are the least frequent in CoSEM, which supports our intuition that the tio passive has only recently emerged in CSE.
Table 14 presents the estimates for predictors influencing the likelihood of using a particular passive construction relative to others, with the be-passive serving as the reference ‘standard’ category. We discuss each predictor in turn.
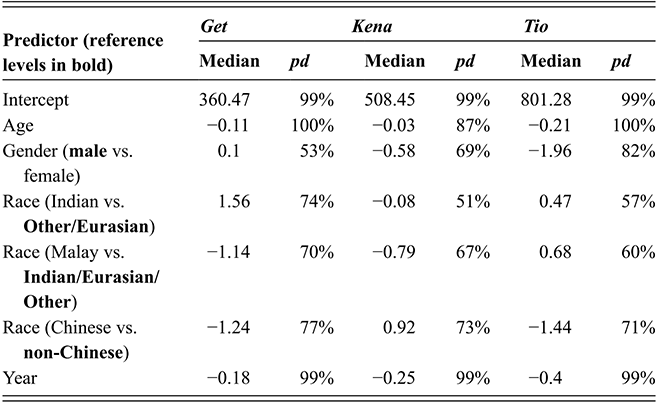
Table 14 Long description
The y-axis shows the intercept and six predictors with different reference levels for race indicated in bold: age, gender (reference: male), race (reference: Other/Eurasian), race (reference: Indian/Eurasian/Other), race (reference: non-Chinese), and year. The x-axis shows the median estimates and probabilities of direction (p d) of three passive C S E constructions (get, kena, and tio passives). The table shows: 1. negative coefficients with high p d values for age for all three passives, indicating that the use of all passives decreases with age. 2. low p d values (less than 90 percent) for gender for all three passives, indicating limited effects of gender. 3. low p d values (less than 90 percent) for race for all three passives, indicating limited effects of race. 4. negative coefficients with high pd values for year for all three passives, indicating that the use of all passives decreases over time.
Age. Table 14 indicates that there is strong evidence that as age increases, the likelihood of using get, kena, or tio decreases. First, this pattern aligns with trends reported for American English, where the get passive has been increasing at the expense of the be passive (Sneller & Fisher Reference Sneller and Fisher2015). This parallel may provide support for the influence of American English on the English of younger Singaporeans, although the data cannot establish a causal link. Second, the results indicate that the substrate-influenced passives are relatively more popular among younger speakers than older ones. For the kena passive, the finding that younger speakers continue to use it aligns with Bao and Wee’s (Reference Bao and Wee1999) prediction that the kena passive will remain robust in CSE. The tio passive shows a similar trend, which is expected given its relatively recent emergence, likely introduced by younger speakers.
The distribution of passive constructions across age groups, as shown in Figure 15, also reveals some generational patterns. The be passive is the most frequently used across all age groups, with older speakers notably displaying the highest usage, followed by younger speakers, and next, middle-aged speakers. The get passive shows a gradual decline in usage with age. The kena passive is most frequent among middle-aged speakers but is considerably lower among younger and older speakers. Finally, the tio passive appears only marginally in the data, with extremely low frequencies found among younger and middle-aged speakers. The patterns suggest that the use of standardised English be and get passives dominate the use of the substrate-derived kena and tio passives across different generations of CSE speakers.
Percentage of a given passive marker relative to all passives used by an age group
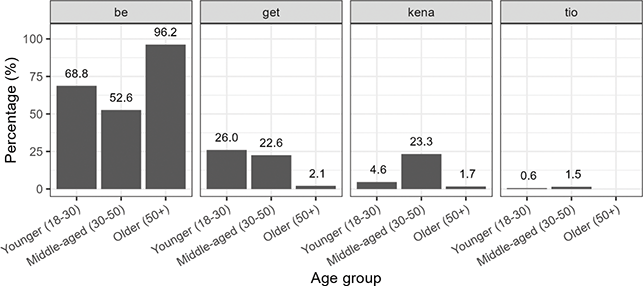
Figure 15 Long description
In all four graphs, the y-axis represents percentages, and the x-axis represents three age groups: younger (18 to 30 years of age), middle-aged (30 to 50 years of age), and older (over 50). The bars in the first graph are for the be-passive and stand at 68.8 for the younger group, 52.6 for the middle-aged group, and 96.2 for the older group. The bars in the second graph are for the get-passive and stand at 26.0 for the younger group, 22.6 for the middle-aged group, and 2.1 for the older group. The bars in the third graph are for the kena-passive and stand at 4.6 for the younger group, 23.3 for the middle-aged group, and 1.7 for the older group. The bars in the fourth graph are for the tio-passive and stand at 0.6 for the younger group, 1.5 for the middle-aged group, and 0 for the older group.
Although our Bayesian results indicate that kena and tio have declined over time relative to be, it is not the case that be has been growing steadily at the expense of kena or tio. Rather, as Figure 16 shows, there is much fluctuation in the use of be. In contrast, kena is used at a low, but comparatively stable, rate. We take this relative stability to support Bao and Wee’s (Reference Bao and Wee1999) prediction that the kena passive will continue to be used in CSE, which is especially notable given that their hypothesis was proposed over two decades ago. As for tio, Figure 16 shows that it is attested as early as 2013, but occurs even less frequently. While tio remains far less established than kena, our current data do not yet allow us to determine whether its usage will increase or decline.
Percentage of a given passive marker relative to all passives in messages from a particular year
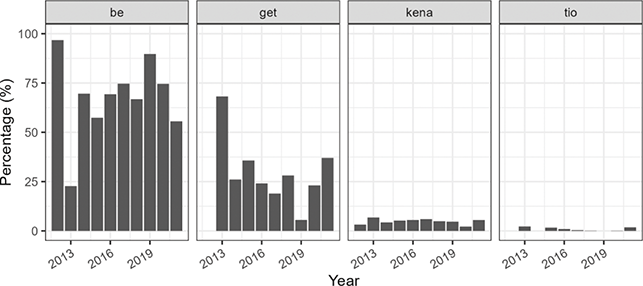
Figure 16 Long description
In all four graphs, the y-axis represents percentages and the x-axis represents the ten years from 2012 to 2021. The bars in the first graph are for the be-passive. Overall, be-passives are the most frequent passive construction.
The bars in the second graph are for the get-passive. Get-passives are generally the second-most frequent construction. The bars in the third graph are for the kena-passive. Kena-passives are the third-most frequent, around 10 percent or less, but are attested in all years. The bars in the fourth graph are for the tio-passive. Tio-passives are the least frequent and not attested in certain years.
Gender. Table 14 provides limited evidence for an effect of gender on the likelihood to use kena or tio (pd < 0.9). This is unsurprising, as these passives are relatively ‘neutral’ linguistic features compared to other features in CSE. For example, the SFP sia in CSE has a vulgar origin and may thus show gender-based distributional differences (Hiramoto et al. Reference Hiramoto, Gonzales, Leimgruber, Lim, Choo, Ngefac, Wolf and Hoffmann2022; Hafiz et al. Reference Hafiz, Hiramoto, Leimgruber, Gonzales and Lim2025: 202). The substrate-influenced passives kena and tio lack such connotations, which may explain their relatively balanced usage across genders, as shown in Figure 17.
Percentage of a given passive marker relative to all passives used by a particular gender
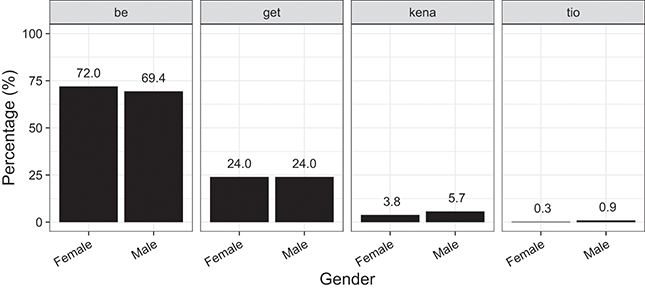
Figure 17 Long description
In all four graphs, the y-axis represents percentages and the x-axis represents two genders: Female and Male. The bars in the first graph are for the be-passive and stand at 72.0 for Female and 69.4 for Male. The bars in the second graph are for the get-passive and stand at 24.0 for Female and 24.0 for Male. The bars in the third graph are for the kena-passive and stand at 3.8 for Female and 5.7 for Male. The bars in the fourth graph are for the tio-passive and stand at 0.3 for Female and 0.9 for Male.
Race. Similarly, Table 14 shows that there is limited evidence of a racial effect on the use of kena (pd < 0.9). Figure 18 shows that Malay speakers use kena more frequently than the other ethnic groups, which is unsurprising given kena’s Malay origin. Notably, Chinese and Indian speakers also use kena, indicating that it has become a shared feature across ethnic groups. For tio, the data is too sparse to draw firm conclusions, though it is unsurprising that Chinese participants use it most frequently. Interestingly, Indian participants use tio about as often as Chinese participants, while Malay participants use it least – perhaps because they are more familiar with kena, the Malay-derived passive in CSE.
Percentage of a given passive marker relative to all passives used by members of an ethnic group
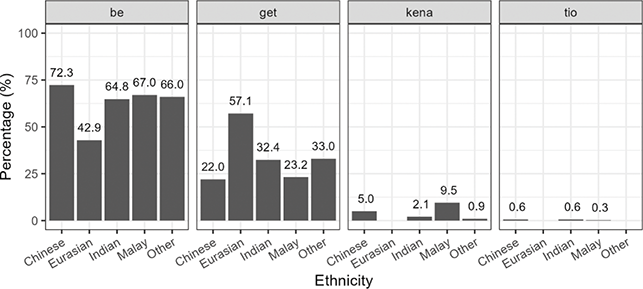
Figure 18 Long description
In all four graphs, the y-axis represents percentages and the x-axis represents five ethnic groups (Chinese, Eurasian, Indian, Malay, and Other). The bars in the first graph are for the be-passive and have the following values: Chinese 72.3, Eurasian 42.9, Indian 64.8, Malay 67.0, and Other 66.0. The bars in the second graph are for the get-passive and have the following values: Chinese 22.0, Eurasian 57.1, Indian 32.4, Malay 23.3, and Other 33.0. The bars in the third graph are for the kena-passive and have the following values: Chinese 5.0, Eurasian 0, Indian 2.1, Malay 9.5, and Other 0.9. The bars in the fourth graph are for the tio-passive and have the following values: Chinese 0.6, Eurasian 0, Indian 0.6, Malay 0.3, and Other 0.
5.4.2 Distribution of Sentiment
Table 15 shows the distribution of sentiment for each passive marker in our data set; this is represented visually in Figure 19. These patterns let us answer, given a passive marker, what kind of verb (bearing positive, neutral, or negative sentiment) is most strongly associated with it. Within kena passives, the most common verbs have a negative sentiment, compared with be and get passives (Fisher’s exact test for be: p < 0.01, for get: p < 0.01). Tio also has a stronger negative bias compared with be (Fisher’s exact test p < 0.01), but no more so than with get (p = 0.22). We found no evidence of a clear difference between kena and tio (p = 0.35).
| Marker | Negative | Neutral | Positive | Total |
|---|---|---|---|---|
| be | 46 (11.1%) | 354 (85.3%) | 15 (3.6%) | 415 (100%) |
| get | 50 (35.5%) | 85 (60.3%) | 6 (4.3%) | 141 (100%) |
| kena | 170 (60.3%) | 111 (39.4%) | 1 (0.0%) | 282 (100%) |
| tio | 17 (50.0%) | 17 (50.0%) | 0 (0.0%) | 34 (100%) |
Distribution of sentiment, by passive marker.
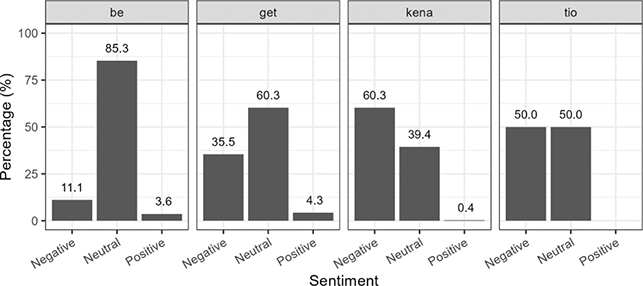
Figure 19 Long description
In all four graphs, the y-axis represents percentages and the x-axis represents three sentiment levels (Negative, Neutral, and Positive). The bars in the first graph are for the be-passive and have the following values: Negative 11.1, Neutral 85.3, and Positive 3.6. The bars in the second graph are for the get-passive and have the following values: Negative 35.5, Neutral 60.3, and Positive 4.3. The bars in the third graph are for the kena-passive and have the following values: Negative 60.3, Neutral 39.4, and Positive 0.4. The bars in the fourth graph are for the tio-passive and have the following values: Negative 50.0, Neutral 50.0, and Positive 0.
We may also flip the question around: given a verb with a positive (or neutral, or negative) sentiment, which passive marker is likely to be used? To answer this question, we analysed the reweighted data set, which better represents the high frequency of be and get passives (Table 16 and Figure 20). Given the general preference for be and get passives (Table 13), it is unsurprising that at the sentiment level, be and get are also the most common options, with kena and tio trailing in distant third and fourth positions respectively (for each sentiment, the proportions of be and get both exceed that of kena, all ps < 0.001; the same for tio which is even less frequent than kena). In other words, although both kena and tio have a distinctive adversative flavour, they do not have a monopoly over negative or even neutral sentiment verbs. One plausible reason is that in these situations, speakers might still avoid kena and tio for register and/or sociolinguistic reasons; for instance, speakers might avoid tio in conversations with other speakers who (they suspect) do not use it (see Section 5.4.1).
| Verb sentiment | Be (reweighted) | Get (reweighted) | Kena | Tio | Total |
|---|---|---|---|---|---|
| Positive | 150 (3.6%) | 60 (4.3%) | 1 (0.0%) | 0 (0.0%) | 211 (3.6%) |
| Neutral | 3,540 (85.3%) | 850 (60.3%) | 111 (39.4%) | 17 (50.0%) | 4,518 (76.9%) |
| Negative | 460 (11.1%) | 500 (35.5%) | 170 (35.5%) | 17 (50.0%) | 1,147 (19.5%) |
| Total | 4,150 (100%) | 1,410 (100%) | 282 (100%) | 34 (100%) | 5,876 (100%) |
Distribution of passive markers used to express a particular sentiment
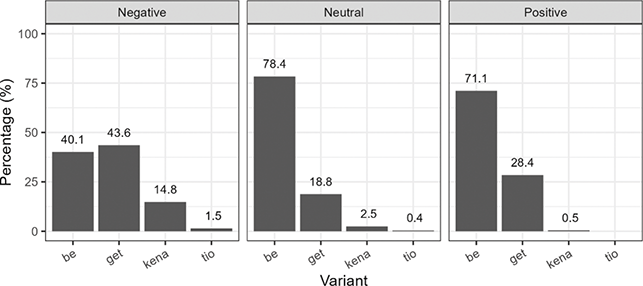
Figure 20 Long description
In all three graphs, the y-axis represents percentages and the x-axis four passive markers (be, get, kena, and tio). The bars in the first graph are for Negative sentiment and have the following values: be-passive 40.1, get-passive 43.6, kena-passive 14.8, and tio-passive 1.5. The bars in the second graph are for Neutral sentiment and have the following values: be-passive 78.4, get-passive 18.8, kena-passive 2.5, and tio-passive 0.4. The bars in the third graph are for Positive sentiment and have the following values: be-passive 71.1, get-passive 28.4, kena-passive 0.5, and tio-passive 0.
5.5 Summary
We have documented the use of the tio passive construction among younger CSE speakers. To conclude, we discuss factors that may have contributed to the emergence of the tio passive in CSE. First, we note that Singapore Southern Min (Hokkien and Teochew) tioh passives are structurally similar to standard English passives: both constructions share the structure patient passive.marker V and neither allows the overt expression of the agent of the verb before the verb. This similarity recalls Bao and Wee’s (Reference Bao and Wee1999) hypothesis that speakers will favour variants that are structurally similar to the dominant (standard) form.
However, we propose that non-structural similarities may also have facilitated the emergence of the tio passive in CSE. As we noted earlier, Southern Min tioh has other functions, including a verbal meaning of ‘obtain’ or ‘win’, and also a deontic modal use like English must or have to. In these respects, Southern Min tioh resembles English get, which also carries the meaning of ‘obtain’ and has a deontic modal use (e.g., I’ve got to go home). Therefore, we propose a generalised version of Bao and Wee’s hypothesis: in contact situations where there are competing options of realising a given construction (e.g., several passive markers), speakers may favour forms that are not only structurally but also semantically similar to the standard variant. This proposal aligns with and extends Baptista’s (Reference Baptista2020) observation that morphosyntactic and semantic features are more likely to be incorporated into a contact variety if they preexist and are shared across some of the input varieties in the linguistic ecology.
A further factor may involve similarities between Southern Min tioh passives with CSE/Malay kena passives. Both types of passives share a similar structure and an adversative interpretation, and Malay kena additionally exhibits deontic modal uses. In an earlier discussion of CSE passives, Ansaldo (Reference Ansaldo and Lim2004: 139) suggests that the influence of Malay kena on CSE might have been ‘reinforced’ by Southern Min tioh passives, which are structurally similar. Here, we suggest that the structural and semantic similarities between Malay kena and Southern Min tioh may have encouraged speakers to use tioh and kena interchangeably in CSE, thereby contributing to the emergence of the tio passive in CSE (see also discussion by Hing (Reference Hing2019, Reference Hing2023) on how Malay kena might have influenced tioh in Penang Hokkien).
Overall, both kena and tio are used relatively infrequently in our dataset compared to the be and get passives. We believe that this does not undermine our claim about the emergence of the tio passive or the robustness of the kena passive in CSE. Rather, there are independent factors that constrain their use. Both kena and tio are more informal and may thus be avoided in more formal contexts. For tio, its low frequency may also reflect its recent emergence and association with specific demographic groups (Section 5.4.1). Moreover, kena and tio passives tend to convey an adversative reading, which further limits their use to contexts with a negative or neutral sentiment (Section 5.4.2). As a result, there is a relatively small subset of situations when speakers use kena and tio: in informal contexts when the main verb has a negative or (to a smaller extent) neutral sentiment. Finally, even within these contexts, kena and tio must compete not only with each other but also with the be and get passive constructions. These factors collectively drive down the use of kena and tio, making them seem less productive than be and get passives.
6 Conclusion
This Element has examined CSE as it continues to evolve among younger generations of speakers across digital domains, drawing on complementary sources of evidence such as corpora and an online survey of how Singaporeans perceive their own language use. Across the sections, we have observed a linguistic ecology shaped by intense, ongoing multilingual contact, youth identity, and the evolving landscape of digital communication. Altogether, these findings highlight the continued dynamism of CSE as a contact variety and illustrate how corpus-based and survey findings contribute to our understanding of ongoing change in CSE. In this concluding section, we summarise the main findings in Sections 3 to 5, pull together several thematic insights from these sections, identify broader implications for research on contact-induced change and CSE, and outline promising avenues for further research.
In Section 3, we reported on the online survey we conducted with native CSE-speaking participants to explore both the contexts in which CSE is used and perceptions of its use. Our focus was on three innovations in CSE that were the subject of recent investigations – clause-initial is it, adverbial confirm, and SFP sia – to see whether the patterns in CoSEM align with CSE speakers’ self-reported use. Our findings showed that younger speakers consistently report higher usage of these features than older speakers, reinforcing their role as linguistic trendsetters (e.g., Labov Reference Labov1972; Eckert Reference Eckert2000). Age thus emerged as a reliable measure of comparability between self-reported use and actual use of morphosyntactic features in CSE, while gender and ethnicity appear less reliable.
Section 4 examined the Hokkien-influenced CSE construction bojio ‘neg invite’, originally used as an interjection to mean literally ‘[you] didn’t invite [me]’ but pragmatically as a complaint: ‘Why didn’t you invite me?’. The CoSEM data, supplemented by corpus evidence from X (formerly Twitter), showed that while Singaporeans more commonly use invite overall, distributional patterns (frequency only results) indicate that jio clusters in negated constructions, whereas model-based predictions reveal a higher and more stable likelihood of jio in non-negated contexts. In addition, jio is strongly associated with negative sentiment and is likely to be used more by younger and Chinese speakers. The results indicate that while jio clustering in negated constructions reflects its origins in complaint-related usage, its model-predicted stability in non-negated contexts and its association with negative sentiment, younger speakers, and Chinese users point to a broader pattern of affective and social conditioning beyond structural factors alone. Stylistically, we found that jio is preferred in more informational and informal settings, highlighting its growing presence in CSE since its reported entry around 2015–2016 (Wong Reference Wong, Bromhead and Ye2020: 103).
Section 5 investigated substrate-influenced passive constructions in CSE. We found that use of the Malay-influenced kena passive remains robust in CSE, confirming Bao and Wee’s (Reference Bao and Wee1999) prediction, while the give passive appears to have fallen out of favour. We also documented the innovative tio passive in CSE – an emerging construction due to influence from Southern Min. Both kena and tio passives map closely onto standardised English be and get passives and may optionally indicate an oblique argument using a by-phrase. Our analysis showed that younger speakers are more likely to use kena and tio passives than older speakers. There is limited evidence that gender and ethnicity have an effect on the use of the kena passive. We also showed that kena and tio passives are strongly associated with negative sentiment. Finally, we suggested that the infrequency of tio passives in CoSEM likely reflects their restriction to colloquial, adversative contexts and competition from the more established kena passive.
6.1 Dynamic Contact and Continual Substrate Influence in CSE
A key thread running through this Element is the ongoing role of substrate influence in shaping morphosyntactic development in CSE. Traditional models of language contact, particularly those rooted in creole formation, typically assume that substrate influence is most potent during the early stages of contact (e.g., Mufwene Reference Mufwene1996; Lefebvre Reference Lefebvre1998; Siegel Reference Siegel1999; Siegel Reference Siegel2000; Mufwene Reference Mufwene2001). However, the empirical evidence presented in recent research on CSE and in this Element challenges this assumption in the context of Singapore.
The linguistic ecology of Singapore remains one in which Sinitic varieties (including Mandarin), Malay, Tamil, and English continue to be used side-by-side, creating conditions that favour ongoing substrate influence. This is reflected in recent research and in this Element’s discussion of innovative morphosyntactic features of CSE: clause-initial is it, adverbial confirm, SFP sia, the verb (bo)jio, and the passive marker tio. Accordingly, the development of CSE cannot be understood solely in diachronic, founder-driven terms, but as a dynamic process shaped by youth identity and sustained multilingual contact in Singapore.
While globalising influences, such as Americanisation (e.g., Tan Reference Tan2012; Starr Reference Starr2019; Lincoln et al. Reference Lincoln, Starr, Fernández-Mallat and Nycz2024; Venkatachalam & Starr Reference Venkatachalam and Starr2024), certainly play a role in the ongoing development of CSE, the evidence here supports a more complex picture in which new features also arise from continual influence from locally present languages in Singapore’s linguistic ecology. From this perspective, CSE is best understood as a complex dynamic system (cf. Schneider Reference Schneider2025) in which local and global forces interact to shape ongoing developments.
6.2 The Role of Corpora and Surveys in CSE Research
A second major contribution of this Element concerns the methodological merits of corpus-based analysis complemented with insights from survey responses. In previous work, CoSEM has not only allowed us to identify notable age-, gender-, and ethnicity-based variation in the use of CSE morphosyntactic features (e.g., Leimgruber et al. Reference Leimgruber, Lim, Gonzales and Hiramoto2021; Hiramoto et al. Reference Hiramoto, Gonzales, Leimgruber, Lim, Choo, Ngefac, Wolf and Hoffmann2022), but also to examine patterns shaped by morphosyntactic factors, pragmatics, and competition among grammatically similar variants (e.g., Gonzales et al. Reference Gonzales, Hiramoto, Leimgruber and Lim2023b; Lim, Hafiz, et al. Reference Lim, Hafiz, Gonzales, Leimgruber and Hiramoto2024; Hafiz et al. Reference Hafiz, Hiramoto, Leimgruber, Gonzales and Lim2025). Building on this tradition, Sections 4 and 5 leverage data from CoSEM to explore how structural, social, stylistic, and discourse-pragmatic factors shape the use of jio and passive constructions in CSE. Section 5 also demonstrates how corpus data can reveal features that have fallen out of use (e.g., the give passive) as well as features that are newly emerging in CSE (e.g., the tio passive).
Additionally, Section 3 brought previous findings from CoSEM into dialogue with self-reported and perception data gathered through an online survey. While CoSEM data allows us to establish actual usage patterns of CSE in naturally occurring contexts, the survey data provides insights into how speakers themselves conceptualise both their own and others’ use of CSE, much like previous research has done in Singapore and elsewhere (Leimgruber Reference Leimgruber2014; Leimgruber, Siemund, & Terassa Reference Leimgruber, Siemund and Terassa2018; Leimgruber Reference Leimgruber2019; Leimgruber et al. Reference Leimgruber, Al-Issa, Lorenz and Siemund2022). By pairing these two perspectives, we were able to contribute a novel methodological angle on the relationship between observed and self-reported data in CSE. Specifically, our findings suggest that age, though not gender or ethnicity, emerges as a reliable predictor of alignment between self-reports and actual usage patterns.
This methodological pairing underscores the value of combining corpus-based and survey-based approaches to understanding ongoing developments in CSE. Corpus data capture ecologically valid, naturally occurring linguistic practices of Singaporeans in informal digital contexts, enabling us to observe and predict how CSE features are used across individuals and across time. On the other hand, survey data reveal speakers’ awareness, attitudes, and metalinguistic intuitions. All in all, these complementary sources of evidence provide a more holistic understanding of contemporary CSE than either method could achieve alone.
6.3 Towards an Understanding of Sentiment in CSE
Another key contribution of this Element lies in its ability to empirically verify the evaluative tendencies borne by two innovative CSE features – verbal jio and the tio passive – which, up until now, have largely been discussed through ethnographic observation and informal description (see e.g., Gonzales et al. Reference Gonzales, Hiramoto, Leimgruber and Lim2023a on (bo)jio). Importantly, however, the two features pattern differently with respect to evaluation, and should not be treated as instantiating a single sentiment-negation profile. For jio, existing descriptions have often suggested an association with unfavourable or problematic situations, but also note occasional positive or neutral uses, leaving its evaluative profile somewhat underspecified. By contrast, tio has received far less focussed attention in the literature, and it would be overstated to claim that prior accounts consistently portray it as tied to ‘negative contexts’ in a general sense.
Our analysis in Section 4 shows that jio’s relationship with negation is stratified: although raw frequency patterns indicate clustering in negated constructions, model-based predictions reveal a higher and more stable likelihood of jio in non-negated contexts, with negated environments exhibiting greater variability. Importantly, the relevant notion of sentiment for jio operates at the level of the utterance as a whole: across both negated and non-negated environments, jio is strongly associated with negative overall message-level sentiment, indicating that speakers tend to deploy jio when adopting a broadly negative evaluative stance towards an event or situation.
Section 5 demonstrates that the tio passive displays a different evaluative alignment. Rather than tracking sentence-level sentiment, tio is sensitive to the evaluative polarity of the main predicate itself. That is, tio preferentially occurs with verbs denoting adverse, undesirable, or negatively valued outcomes, even when the speaker’s overall stance towards the situation is positive. For example, a Liverpool supporter could plausibly say ‘Very good, Man U tio disqualified’, where the global message is positive for the speaker, but the predicate disqualified encodes a negatively evaluated event. In this respect, tio patterns less like a discourse-level stance marker and more like a construction whose semantics encode adversative or negatively valued eventualities, comparable to related passives such as kena or English get passives.
Viewed in conjunction, these patterns suggest that it is not negation as a formal grammatical property that unifies jio and tio, but evaluativity operating at different structural levels. For jio, sentiment is a property of the utterance-level stance; for tio, it is anchored in the lexical semantics of the main verb. Negation is therefore best understood as one possible, but non-determinative, resource through which negative stances may be expressed in the case of jio.
More broadly, these results underscore the utility of corpus data in clarifying the evaluative profiles of emerging CSE features, especially in cases where speaker intuitions and informal descriptions remain partial, underspecified, or internally inconsistent. Instead of presupposing that such features necessarily carry stable, explicit ‘social meanings’, our findings show that corpus evidence is particularly well-suited to isolating where evaluative tendencies reside in the grammar – whether at the level of discourse stance, predicate semantics, or constructional meaning. In the case of jio, this opens the door to understanding how evaluative stance may feed into broader identity-related practices; in the case of tio, the contribution is more modest but no less important, refining our understanding of how adversative meanings are grammatically encoded in CSE without requiring strong claims about social indexing.
Finally, these findings can be situated within a complex dynamic systems perspective on contact-induced change (Schneider Reference Schneider2025), in which emerging CSE features are understood to stabilise through recurrent usage patterns rather than entering the system with fixed meanings. For jio, repeated association with negatively evaluated utterances appears to yield a relatively stable discourse-level evaluative tendency that may become available for stance-taking and social interpretation. For tio, by contrast, stabilisation occurs at a lower level of abstraction, with negative evaluativity functioning primarily as a semantic constraint on predicate selection rather than as a discourse- or identity-linked stance marker. Negative evaluativity thus acts as an ‘attractor’ in the evolving CSE system, but one that operates at different structural levels for different constructions, underscoring that not all emergent features develop comparable social meanings.
6.4 Future Directions
By examining the text messages of predominantly young Singaporeans, this Element has shown that CSE is evolving in ways that are entirely in line with what we know about language change more generally. As a number of variationist scholars have argued (e.g., Labov Reference Labov1972; Eckert Reference Eckert2000), youth styles are often at the forefront of linguistic innovation, and our analyses of is it, adverbial confirm, sia, (bo)jio, and the emerging tio passive support this: younger CSE speakers are consistently the ones leading in the use, extension, and refunctionalisation of new morphosyntactic and lexical resources. At the same time, our findings underline the continued value of older corpora of Singapore English such as ICE-SIN. These earlier datasets remain indispensable for establishing historical baselines and tracing change over the longer term. What CoSEM adds is a more recent, youth-centric snapshot of CSE in digital interaction, allowing us to identify current trends and incipient changes that are not visible in 1990s data. Bringing legacy corpora such as ICE-SIN into dialogue with newer resources like CoSEM, therefore, promises a richer account of how CSE has shifted across roughly a quarter of a century, both structurally and socially, and how it might continue to evolve (see e.g., Schneider Reference Schneider2025 for the use of finish as a completive marker in CSE). We also hope that the case studies in Sections 3–5 have made this point tangible. Each section has used concrete empirical evidence to illustrate how innovations circulate through the system: from the diffusion of youth-indexical items (is it, confirm, and sia), to the morphosyntactic integration of jio and its competition with English invite, to the reorganisation of the passive system with the decline of older contact forms and the emergence of the tio passive. Altogether, these examples show not only that CSE is changing, but that change is unevenly distributed across age groups, interactional contexts, and linguistic subsystems.
Looking ahead, one key direction concerns broadening the empirical base beyond CoSEM. As discussed in Section 3, the corpus is heavily skewed towards younger, digitally active speakers, and to particular social networks anchored around university students. This profile has been extremely productive for identifying innovative features such as toh, dei, and double SFPs, but it also limits the generalisations we can make about CSE in the wider community. Some of the future work will benefit from collecting additional data from speakers outside the CoSEM cohorts – especially older Singaporeans, non-tertiary-educated speakers, and a wider range of occupational and ethnic backgrounds – to test whether the innovative forms described here have diffused more broadly or remain confined to particular youth-centric niches. A second avenue involves extending our combined corpus–survey framework. The present survey provided an initial sense of how CSE users outside CoSEM report their own usage patterns and evaluate specific forms. Some of the future studies could develop this approach by incorporating follow-up interviews, experiments (e.g., perception or acceptability-judgement tasks), and platform-specific analyses (e.g., TikTok, Instagram, and Discord) that capture multimodal and cross-platform variation in greater detail. This would allow us to refine our understanding of when self-reports align with observed usage and when they diverge, and how changing media ecologies shape the visibility and circulation of new CSE features. Third, the features investigated so far represent only a subset of the innovations attested in CoSEM. The corpus contains many other promising candidates for future work, including lesser-studied particles, multi-particle sequences, and further instances of grammatical replication or semantic shift. Systematic analyses of items such as toh, dei, double SFPs, and additional emergent forms will help clarify how contact-induced change, indexicality, and youth style interact in shaping contemporary CSE. Comparing these developments with related processes in other high-contact Englishes and urban youth varieties could also contribute to refining models of contact and variation that were largely developed on the basis of earlier, less digitally mediated data. Finally, we envisage future collaborative work that builds directly on CoSEM as an open resource. The corpus has been made publicly available to researchers (https://github.com/wdwgonzales/CoSEM), and we hope that colleagues will use it for a wide range of purposes – testing theoretical claims about contact and change, developing NLP tools sensitive to CSE, exploring stance and affect in digital communication, or designing teaching materials that better reflect the linguistic realities of Singaporean youth. As CoSEM is enriched with additional annotation and potentially extended with new data, it can serve as a long-term monitoring tool for tracking how CSE continues to develop in a rapidly changing sociolinguistic landscape.
Returning to the claim in the beginning of this Element that CSE is difficult to fully capture with existing models of variation, our findings allow us to be more precise about where these models fall short and how they might be refined. Traditional, stage-based accounts of contact varieties and postcolonial Englishes, such as those in, for example, Mufwene (Reference Mufwene1990), Siegel (Reference Siegel1999), and, to some extent, Schneider (Reference Schneider2007), typically treat substrate influence as largely completed once endonormative stabilisation has been reached, and pay relatively little attention to how contact-driven innovations are taken up, reallocated, and reinterpreted by subsequent generations. By tracing the trajectories of features such as clause-initial is it, adverbial confirm, sia, (bo)jio, and the tio passive across apparent time, platforms, and interactional contexts, we show that contact effects in CSE are ongoing, multi-sourced, and tightly bound up with youth style and affective stance-taking in our case studies. This combination of corpus, survey, and sentiment-based evidence suggests the need for models that foreground continuous, bi/multi-directional contact and socially embedded speaker agency, rather than linear founder-driven scenarios alone. In this sense, the CSE documented here offers a useful test case for rethinking how we conceptualise morphosyntactic change in high-contact L1 Englishes more generally.
In sum, the main contribution of this Element lies not only in documenting a set of specific innovations but in demonstrating how combining corpus data, survey findings, and targeted case studies can shed light on youth-led change in a contact variety that remains in motion. Our hope is that the work presented in Sections 3–5 will encourage further research that both deepens and widens the empirical coverage of CSE, while also contributing to broader theoretical discussions about language variation and change in the digital age.
Glossing Conventions
Listed here are the glossing abbreviations used in this Element, which follow the Leipzig glossing conventions (Bickel, Comrie, & Haspelmath Reference Bickel, Comrie and Haspelmath2008).
- 1sg
First person singular
- 3sg
Third person singular
- deo
Deontic
- exist
Existential marker
- pass
Passive marker
- poss
Possessive marker
- neg
Negation
- perf
Perfective aspect
Acknowledgements
This Element and the larger research project on which it is based would not have been possible without the generous support of many individuals and institutions over the years. We gratefully acknowledge funding from the Singapore Ministry of Education (MOE) Academic Research Fund Tier 1, Singapore Colloquial Singapore English in Social Media and Other Forms of Messaging (R-103–000–167–115, 2019–2022), awarded to Mie Hiramoto as Principal Investigator. We also thank the National University of Singapore for its continued support, including the UROP scheme, which enabled sustained student involvement in the project. Nick Huang and Mohamed Hafiz are also supported in part by the MOE, Singapore, under the Social Science and Humanities Research Fellowship (SSRC2024-SSHR-002, 2026–2031), awarded to Nick Huang as Principal Investigator.
Our heartfelt thanks go to the research assistants who worked on various stages of the CoSEM project, in alphabetical order of their family names: Latané Bullock, Athena Choo, Choo Xue Ming Jessica, Sydelle D Souza, Aura Valentine Eden, Nadine Ng Hui Ning, Pak Yongkang Vincent, Luqman Aqil Bin Rozman, and Yeo Rei-Chi Lauren. We also thank Sara Blieninger and Nele Heaslip for their help in finalising this manuscript.
We are equally indebted to the UROP students, whose energy and curiosity helped shape many of the ideas and analyses in this Element, again in alphabetical order of their family names: Boey Yui Keat Ryan-Ashleigh, Chang Wei Xing, Athena Choo, Chloe Kwek Wing Yen, Lavonne Yew Yu Xuan, Lin Taohai, Mak Kai Feng Darren, Magdalene Ong Wenli, Megan Eleanor Wee Jia Xin, Pek Wee Kit Terence, Reno Sam Wei Jie, Ten Ting Kai, Francisca Ann Vincent, and Yeo Ming Wen, Megan Maria.
We would also like to thank our colleagues Susan Ang, Michael Yoshitaka Erlewine, Leslie Lee, Nala Lee, Edgar W. Schneider, and Rebecca Lurie Starr for their insightful comments, encouragement, and collegial support at various stages of this work. We are especially grateful to Edgar, in his role as Elements series editor, for his support and guidance throughout the development of this volume. Our deep gratitude extends to all survey participants and distributors, whose time and generosity made the empirical aspects of this Element possible.
There are far more people than we can properly name here – students, colleagues, friends, and family members who have offered feedback, ideas, and moral support over the years. Any omissions are entirely our own, and we hope that everyone who has contributed, in ways large and small, knows how sincerely grateful we are.
University of Regensburg
Edgar W. Schneider is Professor Emeritus of English Linguistics at the University of Regensburg, Germany. His many books include Postcolonial English (Cambridge, 2007), English around the World, 2e (Cambridge, 2020) and The Cambridge Handbook of World Englishes (Cambridge, 2020).
Editorial Board
Alexandra D’Arcy, University of Victoria
Kate Burridge, Monash University
Paul Kerswill, University of York
Christian Mair, University of Freiburg
Christiane Meierkord, Ruhr University
Raj Mesthrie, University of Cape Town
Miriam Meyerhoff, University of Oxford
Daniel Schreier, University of Zurich
Devyani Sharma, University of Oxford
Sali Tagliamonte, University of Toronto
Bertus van Rooy, University of Amsterdam
Lionel Wee, National University of Singapore
About the Series
Over the last centuries, the English language has spread all over the globe due to a multitude of factors including colonization and globalization. In investigating these phenomena, the vibrant linguistic sub-discipline of “World Englishes” has grown substantially, developing appropriate theoretical frameworks and considering applied issues. This Elements series will cover all the topics of the discipline in an accessible fashion and will be supplemented by on-line material.
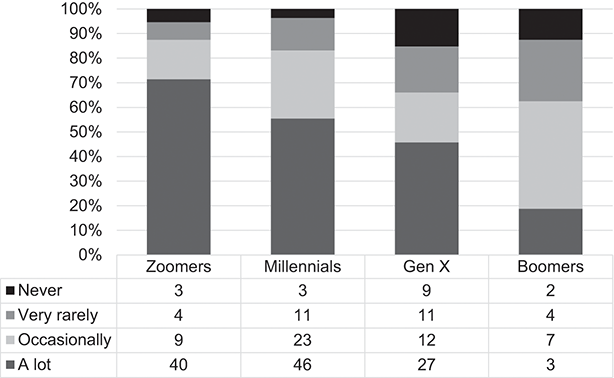
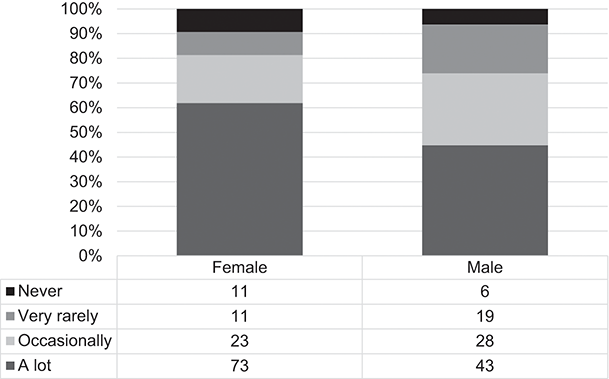
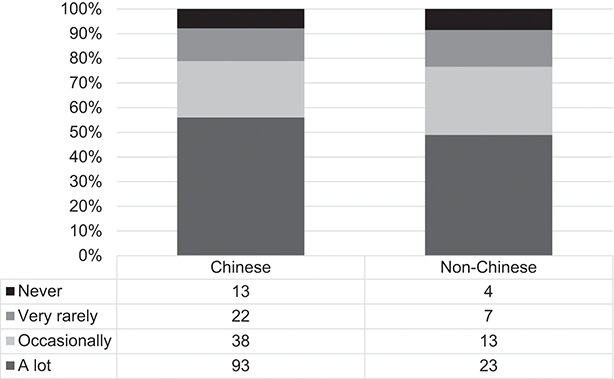
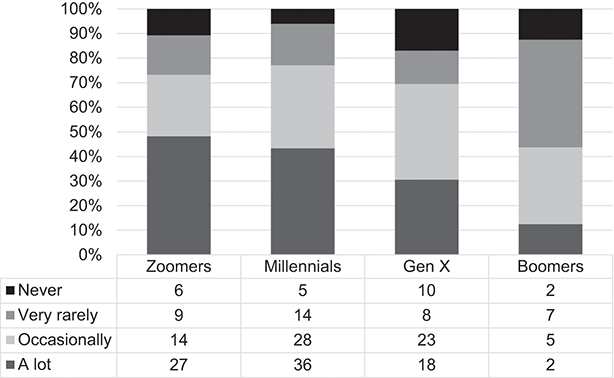
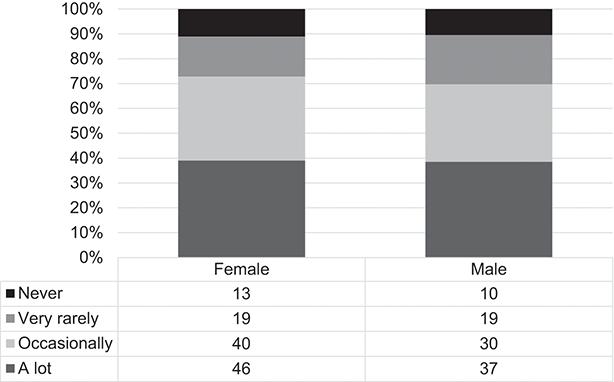
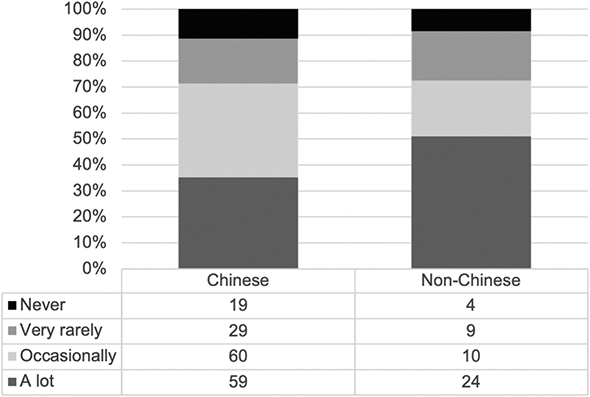
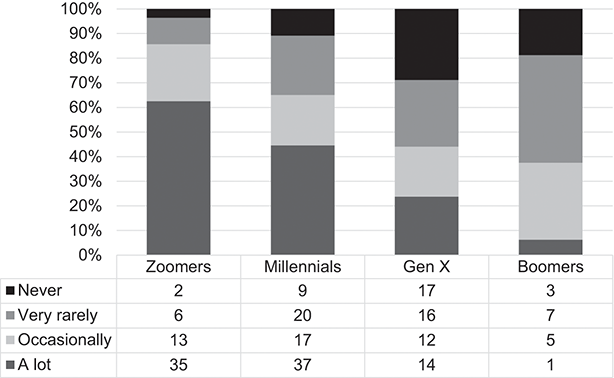
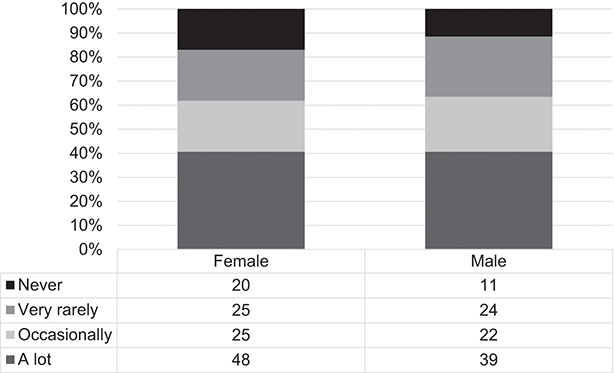
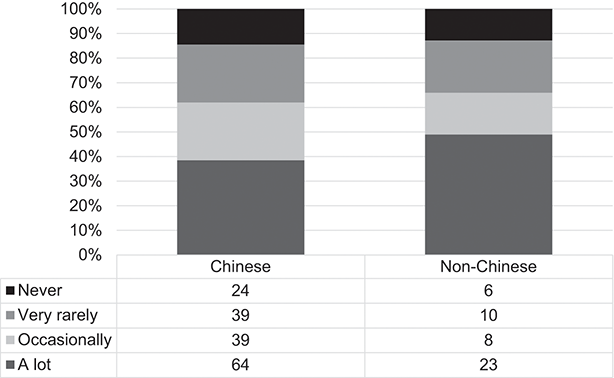
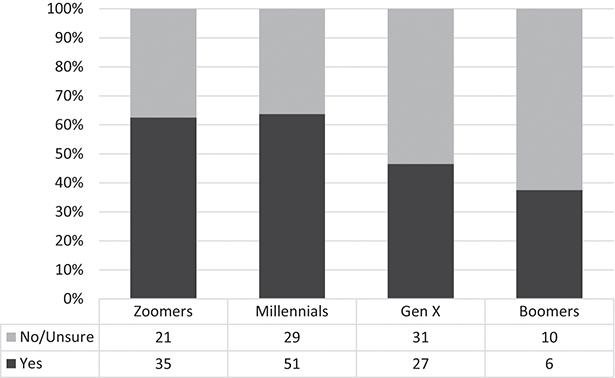
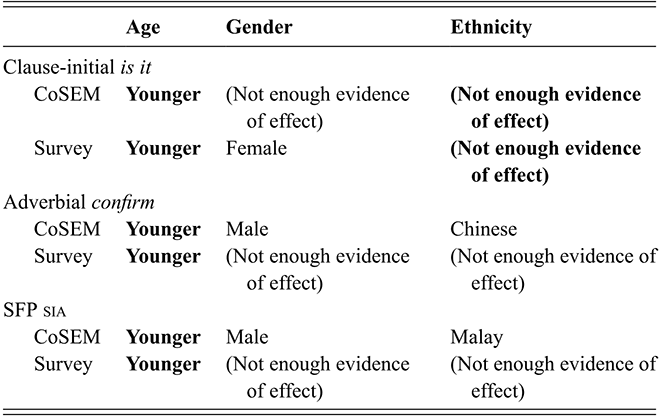
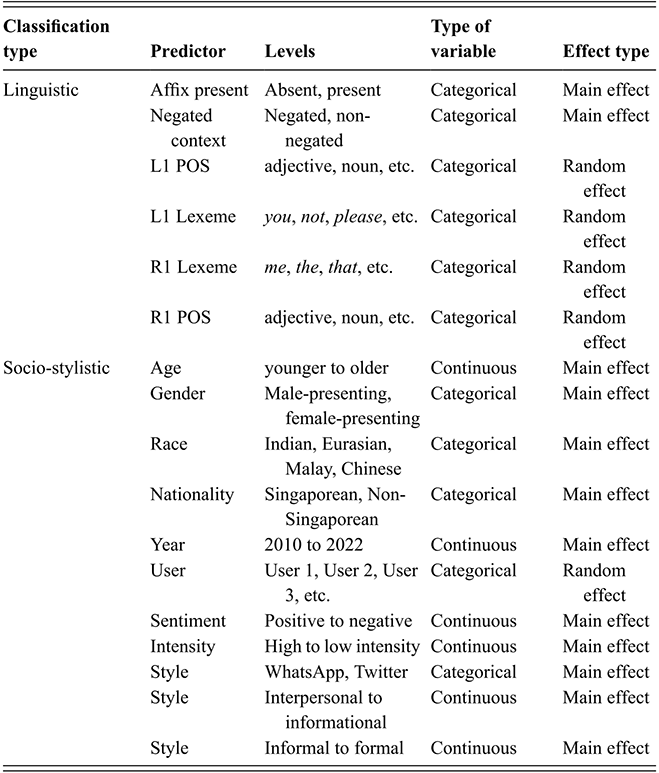
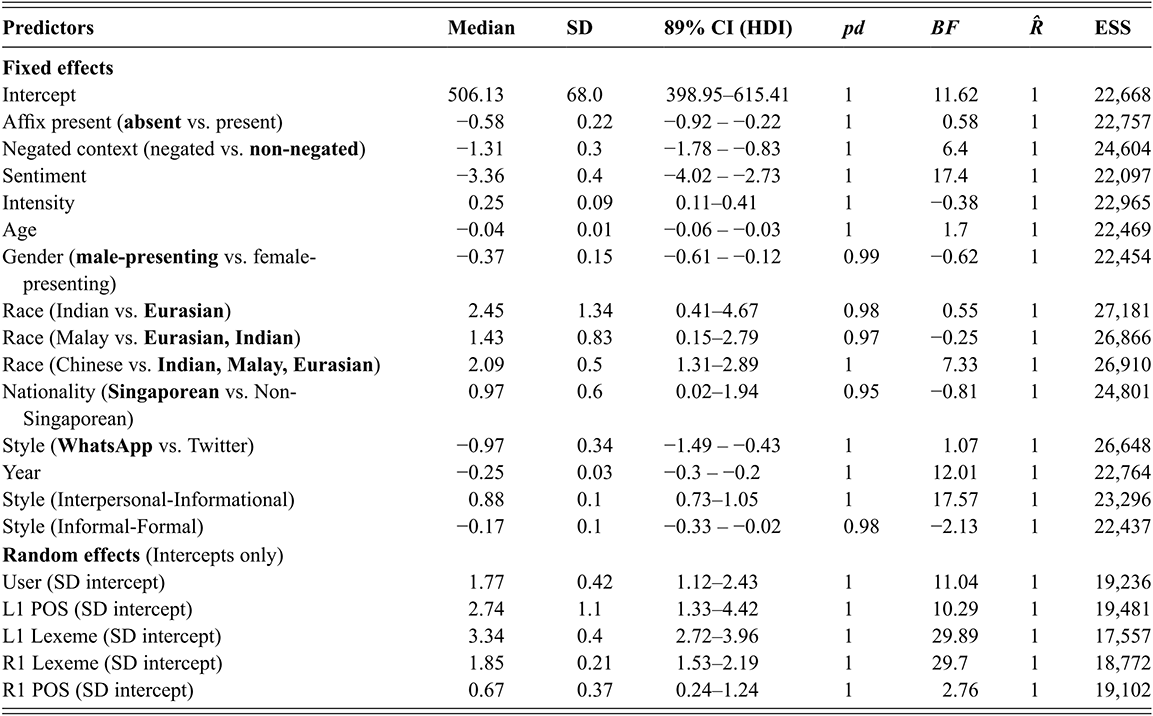
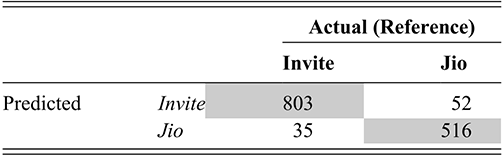
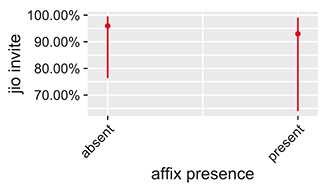
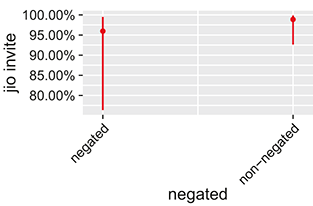
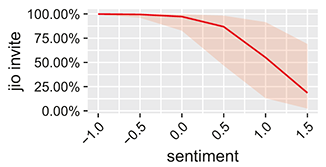
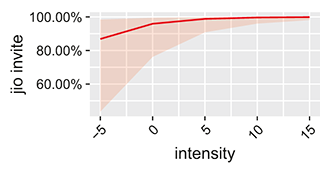
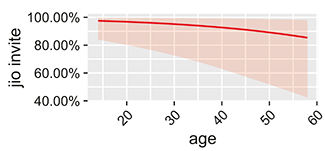
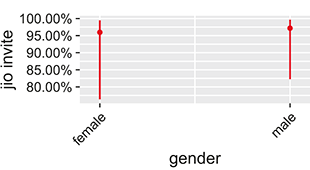
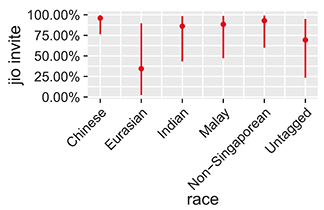
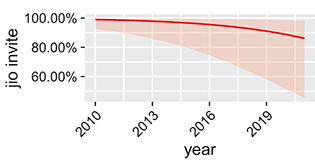
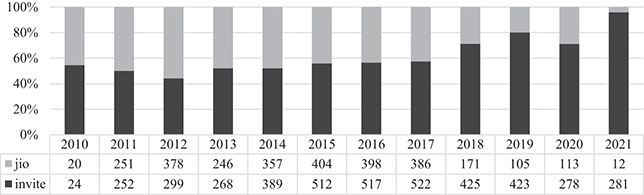
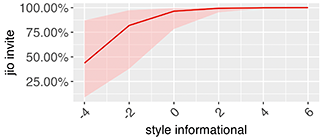
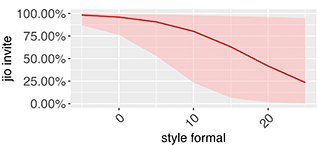
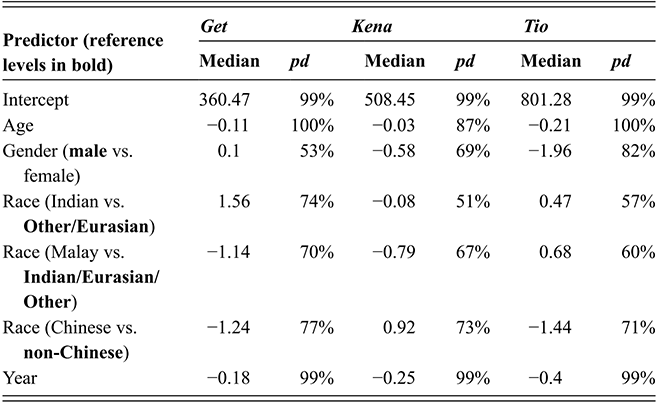
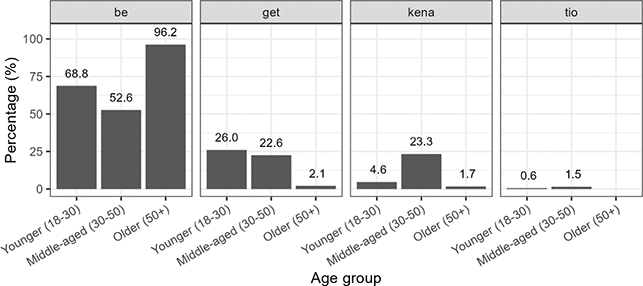
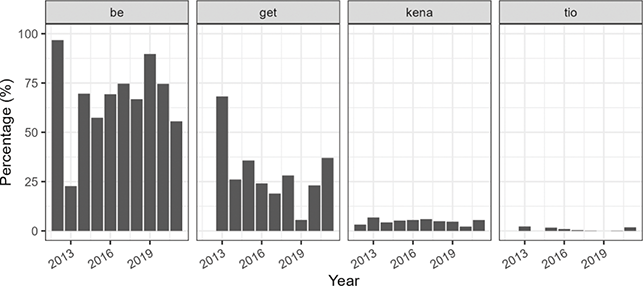
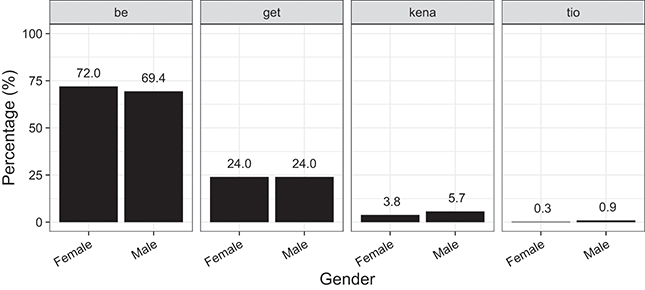
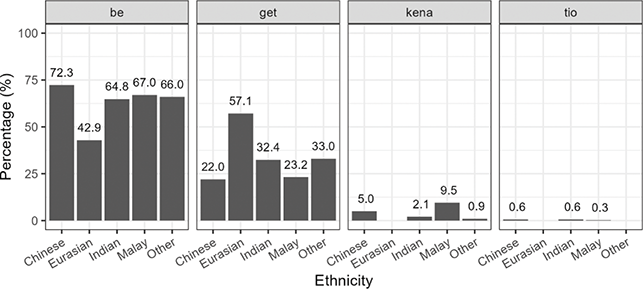
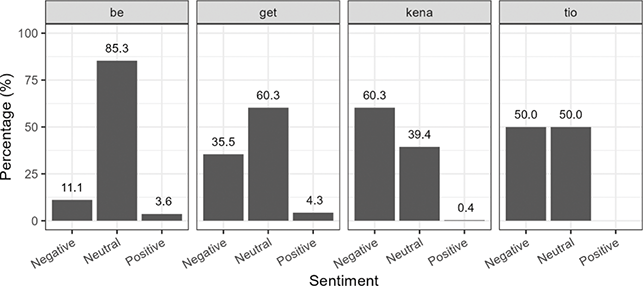
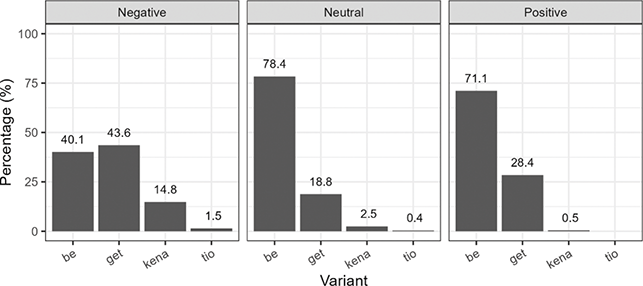

 Open access