Introduction
Müller cells are the dominating macroglial cells of the vertebrate retina. These cells have contacts to all types of retinal neurons and fulfill a variety of functions (Reichenbach and Bringmann, Reference Reichenbach and Bringmann2010, Reference Reichenbach and Bringmann2013). For example, Müller cells play an important role in the homeostasis of the extracellular space. To this end, they express a variety of ion channels, transmitter receptors, and transporters in their membrane. Among them, the glial inwardly rectifying potassium (Kir) channels, particularly of the Kir4.1 type, are involved in the process of spatial buffering of K+ ions and in the retinal osmoregulation (Kofuji and Connors, Reference Kofuji and Connors2003). During pathophysiological changes in the retina, Müller cells undergo a process referred to as reactive gliosis (Bringmann et al., Reference Bringmann, Pannicke, Grosche, Francke, Wiedemann, Skatchkov, Osborne and Reichenbach2006, Reference Bringmann, Iandiev, Pannicke, Wurm, Hollborn, Wiedemann, Osborne and Reichenbach2009). Reactive Müller cells are characterized by an increased expression of the intermediate filament protein glial fibrillary acidic protein (GFAP; Lewis and Fisher, Reference Lewis and Fisher2003). Moreover, a role for glial K+ channels during gliosis has been hypothesized by Bringmann et al. (Reference Bringmann, Francke, Pannicke, Biedermann, Kodal, Faude, Reichelt and Reichenbach2000). We found specific alterations of electrophysiological properties in many, but not all cases of retinal degeneration. A decrease of currents through Kir channels was observed in human eyes with different pathologies (Francke et al., Reference Francke, Pannicke, Biedermann, Faude, Wiedemann, Reichenbach and Reichelt1997) and in several animal species after retinal detachment, proliferative vitreoretinopathy, retinal ischemia, retinal vein occlusion, ocular inflammation, and diabetic retinopathy (Francke et al., Reference Francke, Faude, Pannicke, Bringmann, Eckstein, Reichelt, Wiedemann and Reichenbach2001; Pannicke et al., Reference Pannicke, Uckermann, Iandiev, Biedermann, Wiedemann, Perlman, Reichenbach and Bringmann2005a, Reference Pannicke, Uckermann, Iandiev, Wiedemann, Reichenbach and Bringmannb, Reference Pannicke, Iandiev, Wurm, Uckermann, Vom Hagen, Reichenbach, Wiedemann, Hammes and Bringmann2006; Iandiev et al., Reference Iandiev, Uckermann, Pannicke, Wurm, Pietsch, Reichenbach, Wiedemann, Bringmann and Uhlmann2006a; Rehak et al., Reference Rehak, Hollborn, Iandiev, Pannicke, Karl, Wurm, Kohen, Reichenbach, Wiedemann and Bringmann2009; Hirrlinger et al., Reference Hirrlinger, Ulbricht, Iandiev, Reichenbach and Pannicke2010; Wurm et al., Reference Wurm, Iandiev, Uhlmann, Wiedemann, Reichenbach, Bringmann and Pannicke2011). However, in some other animal models of retinal degeneration, the Kir current amplitude of Müller cells remained largely unaltered, e.g., during Borna disease virus (BDV)-induced degeneration or in the slowly degenerating retina of the rds mutant mouse (Pannicke et al., Reference Pannicke, Weick, Uckermann, Wheeler-Schilling, Fries, Reichel, Mohr, Stahl, Fluess, Kacza, Seeger, Richt and Reichenbach2001; Iandiev et al., Reference Iandiev, Biedermann, Bringmann, Reichel, Reichenbach and Pannicke2006b). The reason for the variability of the gliotic Müller cell response is currently unknown. It has been hypothesized that downregulation of Kir currents is typical for proliferating Müller cells (Bringmann et al., Reference Bringmann, Francke, Pannicke, Biedermann, Kodal, Faude, Reichelt and Reichenbach2000) and that slow retinal degenerations induce a type of Müller cell gliosis that is characterized by cellular hypertrophy but lacks downregulation of inward currents (Iandiev et al., Reference Iandiev, Biedermann, Bringmann, Reichel, Reichenbach and Pannicke2006b).
The tumorigenic substance N-methyl-N-nitrosourea (MNU) is well known to induce retinal degeneration in a variety of species via DNA damage. Thereby, it evokes photoreceptor cell death within seven days after administration (Tsubura, Reference Tsubura, Yoshizawa, Kiuch and Moriguchi2003). MNU causes guanine methylation of the DNA (Jobst, Reference Jobst1967) and triggers caspase-dependent as well as caspase-independent cell death pathways (Yoshizawa et al., Reference Yoshizawa, Nambu, Yang, Oishi, Senzaki, Shikata, Miki and Tsubura1999; Zulliger et al., Reference Zulliger, Lecaude, Eigeldinger-Berthou, Wolf-Schnurrbusch and Enzmann2011; Reisenhofer et al., Reference Reisenhofer, Balmer, Zulliger and Enzmann2015). Still, the exact mechanisms of photoreceptor degeneration remain uncertain. Since the human retinal disease retinitis pigmentosa (RP) is in general characterized by the irreversible loss of photoreceptors, the MNU-model could be used to investigate photoreceptor cell death and subsequent cellular responses in vivo (Yuge et al., Reference Yuge, Nambu, Senzaki, Nakao, Miki, Uyama and Tsubura1996). As seen in many retinal degenerations, Müller cells displayed also enhanced GFAP expression in response to the MNU-induced loss of photoreceptor cells (Wan et al., Reference Wan, Zheng, Chen, Xiao, Shen and Zhou2008; Chen et al., Reference Chen, Liu, Hu, Xing and Shen2014). Furthermore, in MNU-treated rats, Müller cells re-entered the cell cycle which was indicated by the expression of cyclin D1 and D3 (Wan et al., Reference Wan, Zheng, Xiao, She and Zhou2007). However, Müller cell responses were shown to vary under different pathophysiological conditions and little is known about Müller cells in MNU-induced retinal degeneration in mice. In this study, we investigated changes in Müller cell physiology and employed the patch clamp technique to elucidate alterations in Müller cell membrane properties in the MNU model.
Materials and methods
Animals
All animals were treated according to principles regarding care and use of animals adopted by the American Physiological Society and the Society for Neuroscience and after governmental approval. Six weeks-old male C57/BL6 mice received a single intraperitoneal (i.p.) injection of freshly prepared 1% MNU (Sigma-Aldrich, Taufkirchen, Germany) in 0.9% saline containing 0.05% acetic acid and were euthanized after 1, 3, 5, or 7 days post injection (PI), respectively. Final concentration of MNU was 60 mg/kg bodyweight. Control animals received a similar volume of 0.9% saline containing 0.05% acetic acid.
Histology
Eyes were fixed in 4% paraformaldehyde (PFA; Merck, Darmstadt, Germany) at 4°C overnight (o/n), and embedded in paraffin. Sections (5 µm) were collected at the level of the optic nerve head (ONH). Slides were rehydrated in a graded alcohol series and stained with Mayer’s hemalum (Merck, Zug, Switzerland) and eosin (H&E; Carl Roth, Arlesheim, Switzerland). After dehydration, slides were mounted with EUKITT® (O. Kindler, Freiburg, Germany) and visualized with a Nikon Eclipse upright microscope (Nikon, Egg, Switzerland).
Immunohistochemistry
Eyes were fixed in 4% PFA at 4°C o/n, then retinae were dissected and embedded in 3% agarose (Bio&SELL, Feucht, Germany) in phosphate buffered saline (PBS; Merck). Subsequent, 40 µm sections were cut with a vibratome (Leica, Solms, Germany). Sections were incubated in blocking solution [PBS with 0.3% Triton X-100 and 1% DMSO (all from Roth, Karlsruhe, Germany) and 5% normal goat serum (NGS; Jackson ImmunoResearch, Newmarket, UK)] for 1 h at room temperature (RT). Primary antibodies (CRALBP, 1:300, Santa Cruz, Heidelberg, Germany; GFAP, 1:500, Dako, Eching, Germany; Glutamine synthetase, 1:500, Merck; Kir4.1, 1:400, Alomone Labs, Jerusalem, Israel; SOX9, 1:500, Merck) were incubated in blocking solution at 4°C o/n. After washing with PBS at RT for 3 h, secondary antibodies (Cy2- or Cy3-coupled goat anti-mouse, Cy2- or Cy3-coupled goat anti-rabbit, 1:400, Dianova, Hamburg, Germany) were incubated in blocking solution at RT for 2 h. Sections were washed in PBS at RT for 1 h. Nuclei were counterstained with TO-PRO®-3 iodide (1:1000 in PBS, Life Technologies, Darmstadt, Germany) at RT for 30 min. After washing at RT in PBS for 30 min, sections were mounted with Immu-Mount™ (Life Technologies). Immunohistochemical stainings were visualized using a Zeiss LSM 510 Meta (Zeiss, Oberkochen, Germany).
Quantitative real-time PCR
For quantitative real time polymerase chain reaction (qRT-PCR), six retinae were pooled and total RNA was extracted using the RNeasy Micro Kit (Qiagen, Hombrechtikon, Switzerland) according to the manufacturer’s instructions. RNA quantity and quality were assessed with the Experion Automated Electrophoresis System (Bio-Rad, Cressier, Switzerland). For cDNA synthesis and subsequent qRT-PCR, only RNA samples with an RNA quality indicator (RQI) > 7.0 were used. cDNA was synthesized from 1 µg total RNA using the iScript cDNA Synthesis Kit (Bio-Rad, Cressier, Switzerland) according to the manufacturer’s instructions. qRT-PCR was performed using an iQ5 real-time PCR Detection System (Bio-Rad). The 25 µl PCR reaction mix included 1× iQ SYBR Green Supermix (Bio-Rad), 1 µl of cDNA (125 ng), and 1 µl of forward and reverse primer (400 nM, Gapdh [NM_008084] forward 3′ AACTTTGGCATTGTGGAAGG 5′, reverse 3′ ACACATTGGGGGTAGGAACA 5′ (Takahashi, Reference Takahashi, Rochford and Neumann2005); Kcnj10[NM_001039484] forward 3′ TCACCGTTAGCCTCCAACTC 5′, reverse 3′ CCTTGCACACTGGACACATC 5′). Relative quantification of mRNA expression was calculated using GenEx software (MultiD, Göteborg, Sweden). Cycle thresholds were normalized to the reference gene Gapdh and partly to control samples using the ΔΔC t method.
Cell isolation
Retinal tissue was incubated in Ca2+/Mg2+ free PBS containing papain (0.2 mg/ml; Roche, Mannheim, Germany) at 37°C for 30 min, followed by three washing steps with PBS. After incubation in DNase I (200 U/ml, Sigma-Aldrich) at RT for 2 min, tissue was triturated with a wide-bore pipette in serum-free Minimum Essential Medium (MEM; Sigma-Aldrich) containing 10 mM HEPES, to obtain a single cell suspension. Cells were stored at 4°C and analyzed within 4 h.
Whole cell patch clamp recordings of isolated Müller cells
Experiments were performed at RT. Patch pipettes were pulled from borosilicate glass (GB150-8P, Science Products, Hofheim, Germany) and had a resistance of 5–7 MΩ when filled with intracellular solution (ICS) containing (in mM) 10 NaCl (Roth, Karlsruhe, Germany), 130 KCl (Roth), 2 MgCl2 (Sigma), 1 CaCl2 (Merck), 10 EGTA (SERVA, Heidelberg, Germany), 10 HEPES (Roth), pH 7.1. The recording chamber was perfused with extracellular solution (ECS) containing (in mM) 135 NaCl, 3 KCl, 2 CaCl2, 1 MgCl2, 10 HEPES, 11 glucose, 1 Na2HPO4 (all from Roth), pH 7.4. Cells were visualized with an upright microscope (Axioskop, Zeiss) and Müller cells were identified by their morphology. Membrane currents of isolated Müller cells were recorded in the voltage clamp mode, using the Axopatch 200A amplifier (Axon Instruments, Foster City, CA, USA) and the ISO-2 software (MFK, Niedernhausen, Germany). Signals were low-pass filtered at 1, 2, or 6 kHz (Bessel filter, Frequency Devices, Haverhill, USA). Membrane currents were evoked by applying depolarizing and hyperpolarizing voltage steps of 10 mV increment and 250 ms duration from a holding potential of −80 mV. The series resistance was compensated by 30–40%. BaCl2 (1 mM) was used to block Kir channels. The resting membrane potential was measured in the current clamp mode. The membrane capacitance of the cells was measured by the integral of the uncompensated capacitive artifact (filtered at 6 kHz) evoked by a 10 mV voltage step in the presence of extracellular BaCl2 (1 mM). Current densities were calculated by dividing the current amplitudes recorded at a 60 mV hyperpolarizing step by the membrane capacitance.
Statistical analysis
All results were replicated in at least three independent experiments. Values were presented as the mean ± SD. Statistical analysis was performed using SigmaPlot Software (Systat Software Inc, Erkrath, Germany). Statistical difference between two groups was determined by one way analysis of variance (ANOVA) followed by Tukey or Holm-Sidak post hoc comparison test. Differences in means with P < 0.05 were considered statistically significant.
Results
Retinal degeneration
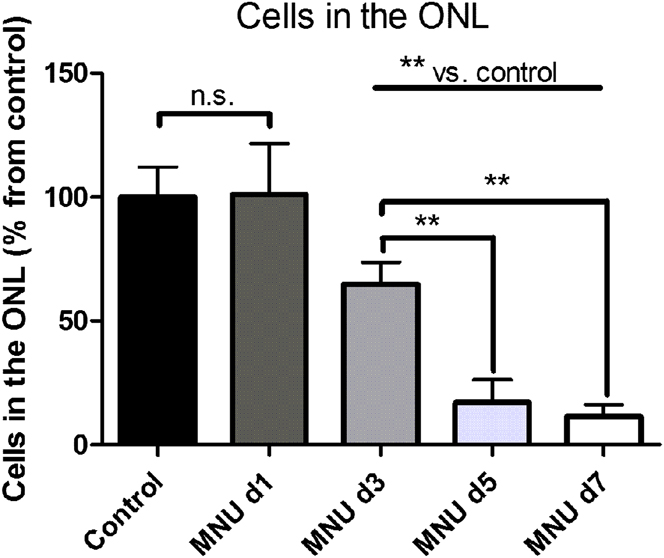
To quantify the loss of photoreceptor cells induced by the MNU treatment, nuclei were counted in H&E-stained paraffin cross sections (Fig. 1). In mice treated with MNU the number of cells in the outer nuclear layer (ONL) was not significantly changed after one day (101.00 ± 20.60%). After three days, the number was however significantly decreased to 64.95 ± 8.82% (P < 0.01) of the number of photoreceptor nuclei in untreated animals. After five days, the number decreased further to 17.07 ± 9.08% (P < 0.01), and after seven days only 11.43 ± 4.74% (P < 0.01) of the original number of photoreceptor nuclei were detectable. Three mice were used for each time point. Nuclei were counted in a defined area in nine different slices per animal.
Quantification of photoreceptor nuclei in the ONL. Numbers of photoreceptor nuclei in the ONL were significantly decreased at d3, d5, and d7 when compared to numbers obtained from control samples (**; P < 0.01). A significant decrease was also evident between d3 and d5–d7 (**; P < 0.01). Data are presented as mean ± SD (n = 3 animals per time point).

Müller cell reactivity
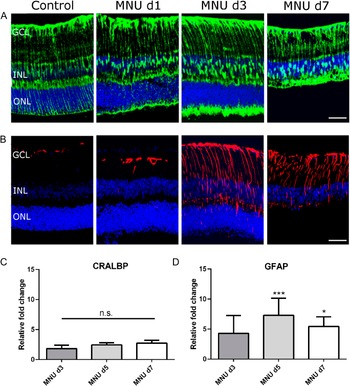
To assess whether the MNU-treatment has an effect on Müller cells, immunohistochemistry was performed on retinal sections. Under control conditions, Müller cells expressed the cell-specific marker cellular retinaldehyde-binding protein (CRALBP, Fig. 2A), whereas GFAP was only expressed in astrocytes localized in the nerve fiber layer and to a limited extent in Müller cell end feet (Fig. 2B). In retinas obtained from MNU-treated animals, CRALBP expression did not show prominent changes (Fig. 2A). In contrast, GFAP expression, indicating reactive Müller cells, was introduced in a number of Müller cell processes starting from d1 PI and could be observed at all time points analyzed (Fig. 2B). Three animals were used for immunostainings at each time point.
Analysis of Müller cell marker expression. (A) CRALBP expression (green) did not change after the MNU-treatment. (B) GFAP expression (red) was only detectable in astrocytes and Müller cell endfeet in control retinas and 1 day PI, but was strongly increased 3 and 7 days PI. Nuclei were counterstained with TO-PRO3. Scale bars indicate 20 µm. GCL: ganglion cell layer, INL: inner nuclear layer, ONL: outer nuclear layer. (C) Cralbp mRNA expression did not significantly change after the MNU-treatment. (D) Gfap mRNA expression was significantly upregulated 5 (***; P < 0.001) and 7 (*; P < 0.05) days PI. The mRNA expression was normalized to the expression of the reference gene Gapdh and control samples. Data are presented as mean ± SD (n = 3 animals per time point, repeated in three independent experiments).

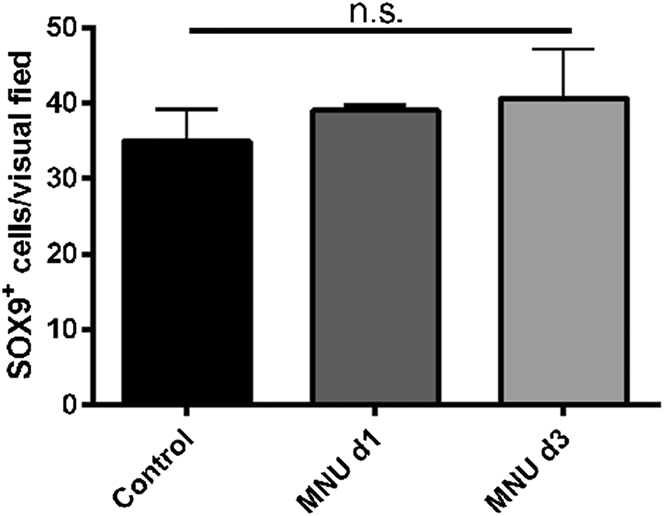
The increase of Gfap mRNA expression was confirmed by qPCR analysis (three mice per time point and three independent experiments). Fold changes of Cralbp were not significantly altered (d3: 1.82 ± 0.57, d5: 2.45 ± 0.36, d7: 2.75 ± 0.48) relative to mRNA expression in control samples (Fig. 2C). In contrast, fold changes of Gfap were 4.31 ± 2.96 (d3), 7.30 ± 2.86 (d5, P < 0.001), and 5.46 ± 1.59 (d7, P < 0.05) relative to mRNA expression in control samples (Fig. 2D). SOX9 is a marker for Müller cells in the adult retina (Poché et al., Reference Poché, Furuta, Chaboissier, Schedl and Behringer2008). Immunohistochemical staining for SOX9 was performed one and three days PI. SOX9-positive nuclei were counted in a defined area in three different slices per animal. Quantification (Fig. 3) revealed that there was no statistically significant alteration of the Müller cell number (n = 3 mice per time point).
Quantification of SOX9-positive cells. Nuclei located in the INL and immunopositive for the Müller cell marker SOX9 were quantified in control retinas and 1 and 3 days PI. No significant changes in the number of SOX9-positive cells were observed. Data are presented as mean ± SD (n = 3 animals per time point).

Electrophysiology
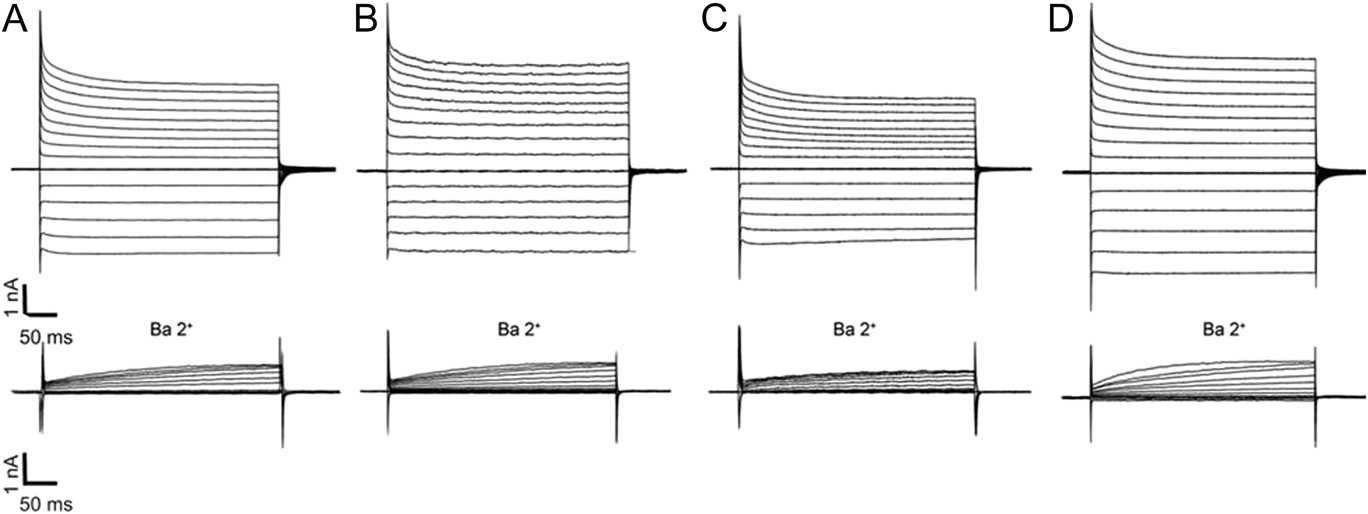
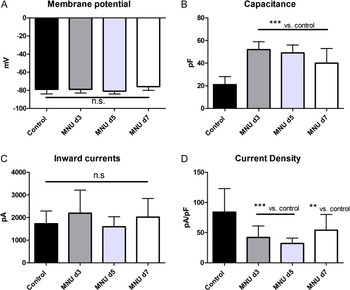
Müller cells are known to show altered membrane properties under certain pathological conditions. Therefore, we employed the patch clamp technique to investigate possible changes in Müller cells from MNU-treated animals. Thereby, three mice and ≥15 cells per time point were used. Fig. 4 depicts representative outward (upward) and inward (downward) currents of control cells and cells obtained from MNU-treated animals. Cells (n = 16) from three control animals displayed a membrane potential of −79 ± 5 mV (Fig. 5A), a membrane capacitance of 21 ± 7 pF (Fig. 5B), and an amplitude of inward membrane currents of 1727 ± 463 pA at 60 mV hyperpolarization (Fig. 5C). Those currents constitute to a large amount of K+ currents which are mediated by Kir channels. Conductance of Kir channels can be blocked by barium, inward currents are absent under the presence of Ba2+ ions (Fig. 4). The fact that outward currents were also decreased by Ba2+ ions, indicating a weak rectification of blocked currents, leads to the conclusion that the weak inwardly rectifying channel subunit Kir4.1 is the most predominant one. The current density (84 ± 39 pA/pF for control cells, Fig. 5D) was calculated since whole cell currents were measured in this experiment and amplitude of these currents did not allow concluding how many channels were located on a defined membrane area. After the treatment with MNU, the membrane potential was not significantly altered (Fig. 5A), whereas the membrane capacitance was significantly increased at all time points analyzed (Fig. 5B). Furthermore, the amplitude of inward membrane currents at 60 mV hyperpolarization was not significantly altered after application of MNU (Fig. 5C). The current density was significantly decreased at all time points analyzed after MNU treatment (Fig. 5D).
Patch clamp whole cell records of Müller cells from MNU-treated mice. (A) Representative examples of membrane currents of a control cell, (B) 3 days PI, (C) 5 days PI, and (D) 7 days PI. Depolarizing and hyperpolarizing voltage steps were applied in increments of 20 mV from a holding potential of −80 mV. Inward currents were absent in the presence of Ba2+ ions (n ≥ 15 cells and three animals per time point).

Müller cell membrane properties after MNU-treatment. (A) The membrane potential was not significantly altered after MNU-treatment. (B) Membrane capacitance was significantly increased at all time points analyzed. (C) K+ currents at −60 mV hyperpolarization were not significantly altered. (D) Current density was significantly decreased at d3, d5 and d7 PI. Data are presented as mean ± SD and significance was reached with P < 0.005 (**) or P < 0.001 (***) vs. control (n ≥ 15 cells and three animals per time point).

Kir4.1 expression and distribution
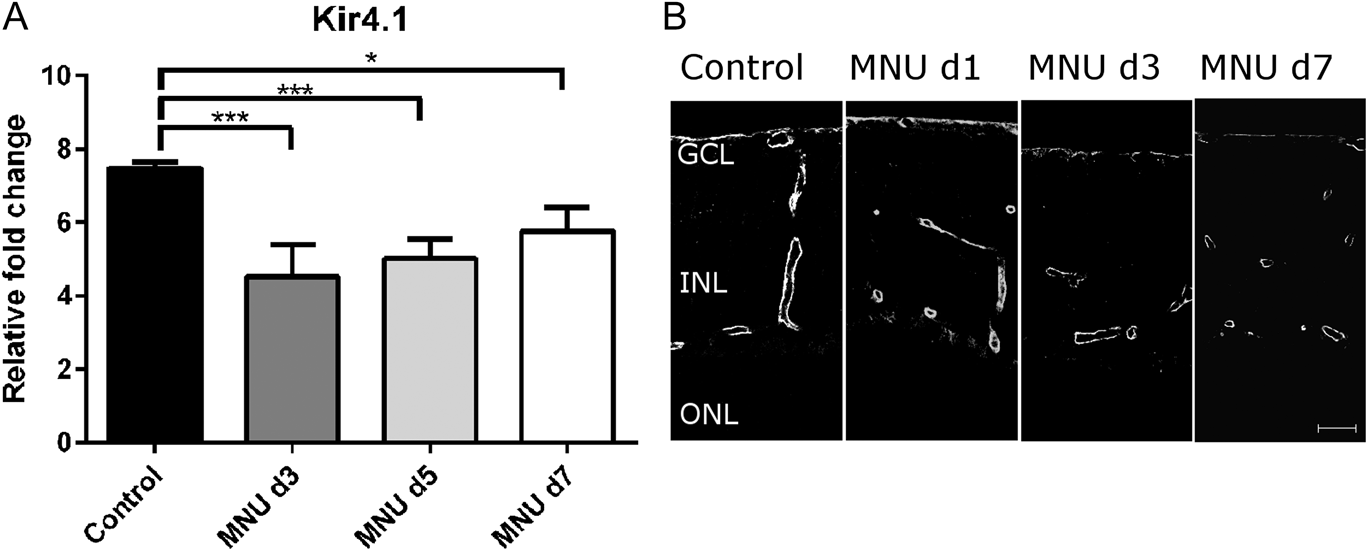
On the mRNA level, expression of Kir4.1 was significantly reduced compared to control samples at all time points analyzed (n = 3 mice per time point and 3 independent experiments). In control samples, relative gene expression was 7.49 ± 0.16 and this was significantly downregulated at d3 PI (4.53 ± 0.87, P < 0.001), d5 PI (5.01 ± 0.53, P < 0.001), and d7 (5.78 ± 0.64, P < 0.05) (Fig. 6A). Immunohistochemical stainings were used to analyze the distribution of Kir4.1 immunoreactivity. In control samples, Kir4.1 is expressed around blood vessels and at the inner limiting membranes. This expression pattern does not markedly change after MNU-treatment (Fig. 6B).
(A) Analysis of Kir4.1 mRNA expression. Relative gene expression was significantly downregulated at d3, d5, and d7 PI. The mRNA levels were normalized against Gapdh. Data are presented as mean ± SD and significance was reached with P < 0.05 (*) or P < 0.001 (***). (B) Immunohistochemical analysis of Kir4.1 expression. In control retinas, Kir4.1 was expressed around blood vessels and at the inner limiting membrane. The same expression pattern was maintained after the MNU-treatment. GCL: ganglion cell layer, INL: inner nuclear layer, ONL: outer nuclear layer. Scale bar indicates 20 µm (n = 3 animals per time point, repeated in 3 independent experiments).

Discussion
Müller cell function is inevitable for retinal homeostasis. It has been shown in many cases of retinal diseases and animal models of retinal degeneration that Müller cells respond to damage with activation characterized by increased filament protein expression (Bringmann et al., Reference Bringmann, Pannicke, Grosche, Francke, Wiedemann, Skatchkov, Osborne and Reichenbach2006). In this study, we could show that in response to MNU-induced photoreceptor loss Müller cells increased GFAP expression on the transcript and protein level (Fig. 2). We did not find any evidence that the number of SOX9-positive Müller cells was affected either by the treatment or by the photoreceptor loss (Fig. 3). We cannot draw a direct conclusion about the occurrence of proliferation from our data. Wan and colleagues (Reference Wan, Zheng, Xiao, She and Zhou2007) demonstrated that Müller cells re-entered the cell cycle and started to proliferate during MNU-induced retinal degeneration. They used rats and did not perform a SOX9-staining, which might explain the differences to our study. Another study performed in mice after light-induced photoreceptor injury showed that Müller cell activation was followed by the expression of cell cycle markers, but not by proliferation. These findings suggest that mature murine Müller cells can re-enter the cell cycle but that the transition to the S-phase and subsequent mitosis are blocked (Joly et al., Reference Joly, Pernet, Samardzija and Grimm2011).
To further investigate the murine Müller cell response we analyzed electrophysiological properties of freshly isolated cells. In our study, Müller cells displayed a typical negative membrane potential that was not altered after the MNU-treatment (Fig. 5A). Furthermore, we found that the membrane capacitance was notably increased (Fig. 5B). Recording of the membrane capacitance by the patch clamp technique allows calculation of the cell surface area (Neher and Marty, Reference Neher and Marty1982). An enhanced capacitance indicates an increased cell surface area and, thus, cell hypertrophy. This is often seen in reactive Müller cells in retinal degenerations (Bringmann et al., Reference Bringmann, Pannicke, Uhlmann, Kohen, Wiedemann and Reichenbach2002; Rehak et al., Reference Rehak, Hollborn, Iandiev, Pannicke, Karl, Wurm, Kohen, Reichenbach, Wiedemann and Bringmann2009). The amplitude of K+ inward currents was not significantly changed (Fig. 5C) suggesting that the number of Kir4.1 channels remained nearly the same in MNU-treated animals. Therefore, the calculated current density (current amplitude divided by membrane capacitance) was significantly decreased (Fig. 5D). Obviously, the gliotic Müller cells contained newly built membrane areas with less or no Kir4.1 channels. On the mRNA level, Kir4.1 expression was decreased (Fig. 6A) and the fact that the inward current amplitudes did not change significantly indicates that the amount of functional Kir4.1 protein did not alter.
Similar changes in Müller cell electrophysiology have been observed in other models of retinal degeneration. Iandiev and colleagues (Reference Iandiev, Biedermann, Bringmann, Reichel, Reichenbach and Pannicke2006b) found decreased current densities in 3- and 5-weeks old rds mice, whereas current amplitudes were not affected. Furthermore, DBA/2J mice, a model for ocular hypertension, displayed increased membrane capacitances but no significant changes in membrane potentials or currents in Müller cells (Bolz et al., Reference Bolz, Schuettauf, Fries, Thaler, Reichenbach and Pannicke2008). As these models are characterized by a rather slow retinal degeneration, it was speculated that reactive gliosis with proliferation and reduced K+ conductance is caused by fast retinal degenerations whereas slow degenerations, such as rds, cause another form of gliosis that is not characterized by decreased Kir currents. In contrast, Sene and colleagues (Reference Sene, Tadayoni, Pannicke, Wurm, El Mathari, Benard, Roux, Yaffe, Mornet, Reichenbach, Sahel and Rendon2009) did not find remarkable changes in the K+ current amplitude but could show increased membrane capacitance and subsequent decreased current densities in mice after retinal detachment. Furthermore, Hirrlinger and colleagues (Reference Hirrlinger, Ulbricht, Iandiev, Reichenbach and Pannicke2010) showed that Müller cells had an increased membrane capacitance after high intraocular pressure-induced transient retinal ischemia whereas current amplitudes were only slightly decreased. These findings, together with our data obtained from MNU-treated animals, contradict the hypothesis that gliosis without severe changes in K+ current amplitudes is only observed in slow retinal degenerations. MNU has been shown to rapidly induce photoreceptor cell death within seven days. In this model, we did not observe a decrease of inward current amplitudes, whereas current densities were decreased. Thus, the velocity of degeneration is obviously not the key factor which determines the Müller cell reaction. It might be that Müller cells respond differently depending on which retinal cell types were injured. This is in agreement with data from a light-induced model of retinal degeneration in mice, where degradation of photoreceptors did not cause alterations in Müller cell K+ currents (Iandiev et al., Reference Iandiev, Pannicke, Hollborn, Wiedemann, Reichenbach, Grimm, Remè and Bringmann2008a). Kir4.1 channels are mainly located in the vitread endfeet of Müller cells and in the glial membranes abutting the blood vessels. There is no Kir4.1 labeling in the ONL (Fig. 6B). Thus, it can be assumed that photoreceptors in the ONL do not provide signals for production or insertion of Kir4.1 channels in the Müller cell membrane and, in turn, the loss of photoreceptors does not influence Kir4.1 channels. When light damage was induced in rats and inner retinal neurons also degenerated, Müller cells displayed decreased K+ currents (Iandiev et al., Reference Iandiev, Wurm, Hollborn, Wiedemann, Grimm, Reme, Reichenbach, Pannicke and Bringmann2008b). Therefore, it might be speculated that the severity of the retinal degeneration regulates the reaction of Müller cells. However, in BDV-infected rats, where most retinal neurons were lost, Müller cells showed no changes in K+ current amplitudes but only decreased K+ current densities (Pannicke et al., Reference Pannicke, Weick, Uckermann, Wheeler-Schilling, Fries, Reichel, Mohr, Stahl, Fluess, Kacza, Seeger, Richt and Reichenbach2001). Moreover, variations in the type or extent of gliosis may result from species differences. Currently, there seems to be no general rule that determines the degree of Müller cell reactivity in response to retinal degeneration.
Taken together, our findings and those from others indicate, that Müller cells respond in different ways to different forms of retinal degenerations. However, it remains unanswered which kind of degeneration triggers which kind of response. Therefore, future work should aim at investigating Müller cell responses in further detail and possibly link these responses to the potential neuroprotective or detrimental effects that Müller cells can have in retinal degenerations.
Acknowledgment
We thank Agathe Duda for excellent technical assistance and Heidrun Kuhrt for valuable scientific contributions. M.R. acknowledges support from the Fritz Tobler Foundation and the Peter Mayor Gedächtnisstiftung, A.R. and T.P. were supported by the Deutsche Forschungsgemeinschaft (RE 849/16-1, SPP1757).