
I. INTRODUCTION
Nowadays, as the automobile outputs continue to increase, lightweight concept is paid more and more attention to cope with the environment pollution and energy shortage problems. Reference Kuziak, Kawalla and Waengler1,Reference Kastensson2 The related research results showed that about 75% of vehicle fuel consumption directly depends on the vehicle weight. For every 10% of vehicle weight decrease, the fuel consumption will decrease from 6 to 8% and the emissions will reduce from 5 to 6%. Reference Keeler and Kimchi3 Therefore, high strength low alloy steels are used in automotive applications driven by needs for vehicle weight reduction to improve fuel economy and crash performance and passenger safety. Reference Matlock, Speer, Moor and Gibbs4 Wheel rims are important components of automobile driving system, affecting both the stability and safety during operation process. As the 490CL, S500CL, 540CL, S550CL, 590CL steels successfully developed, high strength low alloy steels were widely used in rim manufacturing process to fulfill the lightweight purpose. Reference Yin, Meng, Li, Cui and Zhou5–Reference Li, Lin, Jiang and Chen7 The main manufacturing method is flash butt welding (FBW) for its high welding speed, good weld formability and without additional filler metal. Reference Baptista, Versuto, de Oliveira, Torres and Costa8,Reference Ichiyama and Saito9 The characteristics of FBW joints are different from fusion welding joints and some research work have been done in this area.
Arabaci U. et al. researched the X40CrMoV5 1 and C1030 steels FBW joints, and found that the highest hardness was in the coarse grained zone in HAZ in hot-work tool steel and the tensile strength had not been affected greatly by upsetting pressure. Reference Arabaci, Çetînkaya and Akay10 Wang W. et al. found that the microstructures coarsen in weld interface and hardness in the outside edge is higher than that in the inside of the welded bar. Reference Wang, Shi, Lei and Tian11 Zhang F. et al. successfully joined the high manganese steel crossing and the carbon steel rail via austenite-ferrite stainless steel insert by FBW, and the results indicated that the bend-fatigue and bend strengths increased with the increase of the annealing time when the annealing time was less than 10 min due to the high residual stress released via the plastic deformation. Reference Zhang, Lv, Hu and Li12 Min K.B. et al. evaluated the flash weldability and formability of tailor welded blank and concluded that the FBW joints were equipped with enough strength and little rupture occurred in V-bending test by employing the base metals with SPCC and S35C. Reference Min and Kang13 Ziemian C.W. et al. systematically studied the effects of flashing and upset sequence on FBW joints performance. Test results showed that hardness was increased in the weld zone for all specimens due to the extensive deformation. And the tensile strength and the presence of weld zone inclusions and interfacial defects were sensitive to upset current, flashing time duration, and upset dimension. Reference Ziemian, Sharma and Whaley14
The researches regarding the characteristics of FBW joints were relatively limited. In this article, to improve the FBW joints performance and provide necessary theoretical basis and experimental data, the effects of flash allowance and upset allowance on microstructures and mechanical properties of flash butt welded RS590CL steel joints were systematically studied.
II. EXPERIMENTAL MATERIALS AND METHODS
A. Materials
In this paper, newly developed by CITIC Metal Co., Ltd for wheel rim manufacturing, RS590CL high-strength low-alloy steel, with compositions of Fe–0.072C–0.491Si–1.537Mn–0.277Cr–0.022Nb (wt%) was chosen as base metal. The RS590CL is hot rolled steel and the microstructure was elongated along the rolling direction. The main microstructure of RS590CL steel was ferrite and pearlite, shown by Fig. 1(a). Some amounts of curved dislocations were seen in transmission electron microscopy (TEM) image [Fig. 1(b)].
The microstructure of RS590CL steel (a) microstructures (b) TEM image with dislocations.

B. Experimental methods
Before welding, oxide films and grease in surfaces were removed. The UNB-800 FBW machine (Yineng Technology Co. Ltd., Jinan, China) was used to carry out all the welding experiments in the form of plates butt configuration with the plates of same sizes (280 × 100 × 4.5 mm). At the completion of FBW, metallographic examination and mechanical performance tests samples were cut down from welded plates perpendicular to the welding direction and the welding zone was located in the middle of all the specimens. The metallographic samples were prepared according to standard metallographic procedures and researched by means of optical microscope (PMG3, Keyence Co. Ltd., Beijing, China), scanning electron microscope (SEM; EVO18, Carl Zeiss AG, Oberkochen, Germany) equipped with energy dispersive x-ray spectroscopy (Link-ISIS, Oxford Instruments, Oxford, United Kingdom), and transmission electron microscopy (JEM-2100F, JEOL Ltd., Tokyo, Japan). The microstructures were revealed by 4% nitric acid ethanol solution for about 4 s at room temperature and the macromorphology including upset bending curves of joints were revealed by saturated picric acid solution for 10 min at 40–50 °C.
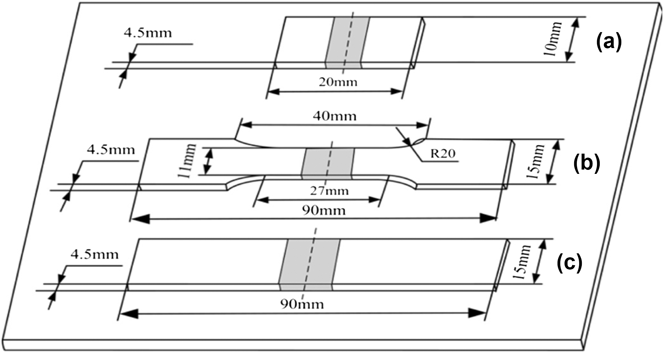
Vickers hardness was measured using MH-3 microhardness tester (Beijing Mattel Instrument Detection Co. Ltd., Beijing, China) across FBW joints with a load of 200 g and a duration time of 10 s on the metallographic samples. Tensile tests were carried out using WE-200 universal testing machine at a speed of 5 mm/min in room temperature. The bending tests were also conducted by WE-200 universal testing machine with a bending angle of 180° and clamps spaces of 25 mm and roller diameter of 8 mm. The dimensions of mechanical properties tests samples are shown by Fig. 2. The results of tensile test and bending test were evaluated by the average of three samples under the same welding condition.
Dimensions of mechanical properties tests samples: (a) Vickers hardness sample, (b) tensile test samples, and (c) bending test samples.

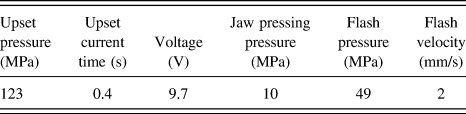
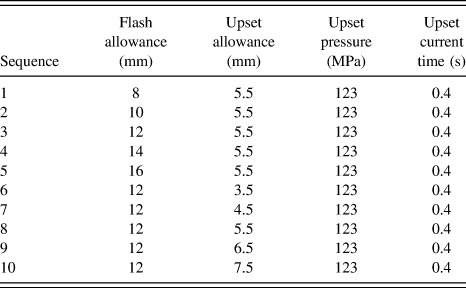
Effects of flash allowance and upset allowance on the microstructures and mechanical properties of FBW joints were researched while other basic welding parameters stayed constant as listed in Table I and the experiment scheme is listed in Table II.
Basic welding parameters used in FBW process.

The FBW welding experiments scheme.

III. RESULTS AND DISCUSSION
A. Joint macromorphology and microstructures
1. Joint macromorphology
FBW consisted of two stages: flash process and upset process, and FBW joints were formed under high temperature and large plastic deformation. Reference Feng, Li, Ding and Jin15,Reference Kim, So and Kang16 After trimming process, surfaces of welded plates were smooth and flat, free of macro defects. The macroimages (Fig. 3) showed that upset bending curves existed in welding zone and can reflect the ductile deformation process experienced by joints in some extent.
Upset bending curves in FBW joints.

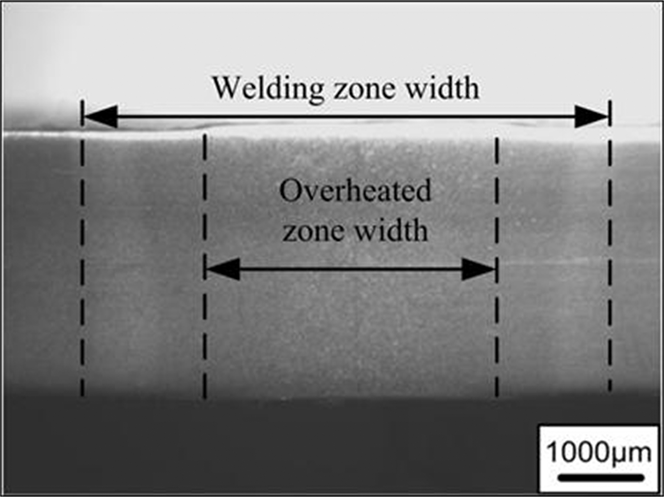
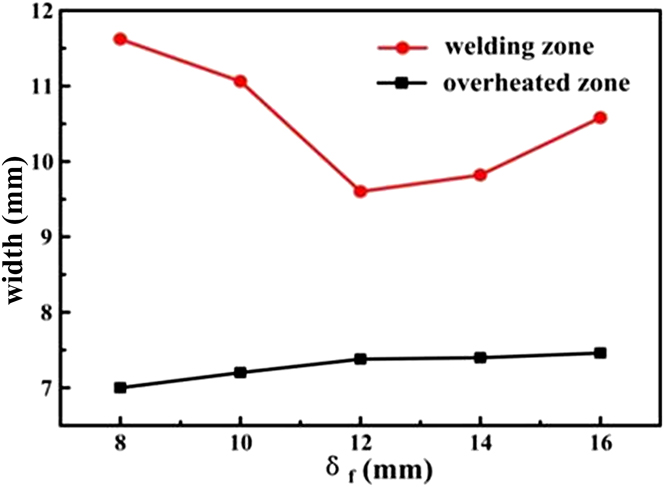
Figure 4 shows the cross-sectional morphology of welded joints at different flash allowances. The joints formed well without cracks, pores, or other welding defects, their macromorphology was symmetrically and the crystal grain bending feature could be easily seen within a short distance toward weld center. When the flash allowance (δf) changed from 8 to 16 mm, joints showed interface characteristics and it became less obviously as δf increased. According to Fig. 5, the overheated zone (OZ) widths and welding zone widths of FBW joints at different δf were measured, shown by Fig. 6. As the Fig. 6 shows, with δf increasing, OZ widths increased from 7 to 7.5 mm, while the welding zone widths decreased at first and then increased changing in the range of 9.6–11.62 mm.
The cross-sectional morphology of welded joints at different flash allowances (a) δf = 8 mm, (b) δf = 12 mm, and (c) δf = 16 mm.

Schematic diagram of welding zone widths and OZ widths for FBW joints.

OZ widths and welding zone widths of FBW joints with different δf.

Flash allowance (δf) refers to the shortened length of welding plates during the flash process and has significant effects on heat inputs. Under the appropriate δf, at the end of flash process, a certain depth of liquid metal layer was formed behind faying surfaces, the metal near the joint interface equipped enough ability to perform plastic deformation and facilitate the followed upset process. Reference Connor17,Reference Callister18 The OZ widths increased with increasing δf mainly related to larger heat inputs and grain coarsening. As for welding zone widths, when δf value was small (8 mm), so as to the heat inputs, the joint can only undergo limited plastic deformation without grains coarsening. As δf increased to 16 mm, the heat inputs increased and the grains coarsen greatly leading to the welding width increasing. When the δf was 12 mm, joints experienced reasonable plastic deformation without grains coarsening significantly under appropriate heat inputs, resulting in the minimum welding zone width.
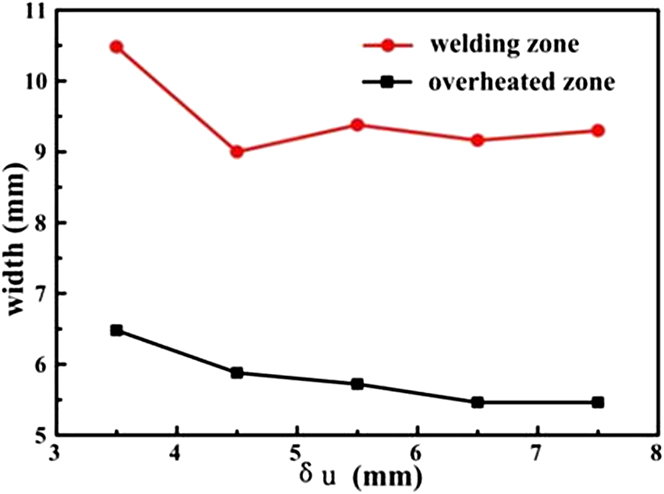
Figure 7 shows the cross-sectional morphology of welded joints at different upset allowances (δu). The joints formed well and distributed symmetrically. A certain degree of interface characteristics was seen and became less obviously as δu increased. Figure 8 shows the OZ widths and welding zone widths of FBW joints at different δu. Both the OZ widths and welding zone widths were decreased as δu increased. With δu increasing from 3.5 to 7.5 mm, OZ widths decreased from 6.48 to 5.46 mm and the welding zone widths decreased from 10.48 to 9 mm.
The cross-sectional morphology of welded joints at different upset allowances (a) δu = 3.5 mm, (b) δu = 5.5 mm, and (c) δu = 7.5 mm.

OZ widths and welding zone widths of FBW joints with different δu.

Upset allowance (δu) is defined as the shortened length of welding plates during upset process and affects the extrusion of liquid metal and other oxides inclusions, and the plastic deformation experienced by FBW joints. As δu increased from 3.5 to 7.5 mm, the extrusion of liquid metal as well as oxides inclusions was more complete and meanwhile large plastic deformation took place in interface zone (IZ), prompting the dynamic recrystallization and recrystallization process in upset process leading to OZ widths and welding zone widths decreased.
2. Joint microstructure
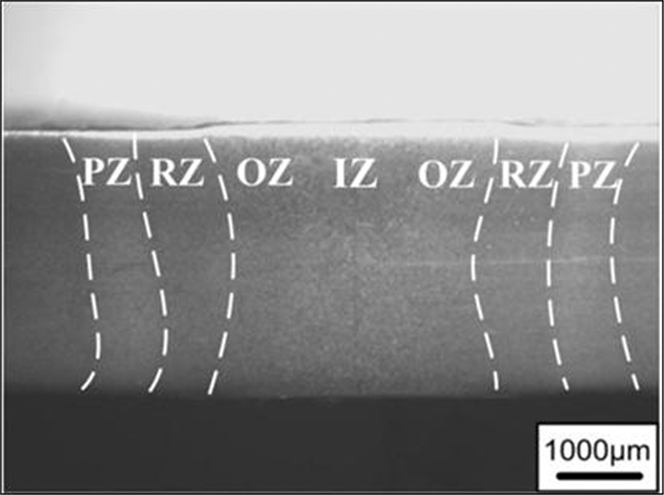
According to peak temperature experienced during the welding thermal cycle and the microstructure characteristics, the FBW joint can be divided into IZ with the peak temperature of solidus–liquidus, OZ with the peak temperature of 1100 °C-solidus, recrystallized zone (RZ) with the peak temperature of Ac3-1100 °C, and partially RZ (PZ) with the peak temperature of Ac1–Ac3 as illustrated by Fig. 9. The detailed information has been discussed in paper. Reference Xi, Sun, Xuan, Wang and Song19
The four different zones in FBW joints.

The microstructures of IZ and OZ of FBW joints with different flash allowances are shown in Fig. 10. The IZ mainly consisted of upper bainite, ferrite, and a small amount of pearlite and the main microstructures of OZ were upper bainite and a small part of pearlite. The IZ width became larger and the microstructures in IZ and OZ changed as flash allowance (δf) increased. The heat inputs, peak temperature, and the high temperature (≥900 °C) that retained time in weld thermal cycle all increased while heating and cooling rates decreased leading to austenite grains coarsening increasingly. When cooled to room temperature, coarsened austenite grains changed into upper bainite and IZ boundary became invisible from OZ meaning that the formability of FBW joints had improved. Reference Callister and Rethwisch20,Reference Easterling21
Microstructures of IZ and OZ of FBW joints with different flash allowances. (a) δf = 8 mm, (b) δf = 12 mm, and (c) δf = 16 mm.

Figure 11 shows the microstructures of welding IZ and OZ of FBW joints with different upset allowances (δu). The IZ mainly consisted of upper bainite, ferrite, and a small amount of pearlite and the main microstructures of OZ were upper bainite and a small part of pearlite. As Fig. 11(a), when δu value was low (3.5 mm), IZ was dominated by bulk ferrite, and among the ferrite, a small amount of bainite exited the boundaries between the IZ and OZ, these can be explained that the formation of IZ was not through the complete dynamic recrystallization process and recrystallization process was due to the deficient plastic deformation and some extent of interface characteristic remained. When δu increased (5.5, 7.5 mm), interface formability improved and the interface boundaries became unclear, as Figs. 11(b) and 11(c) shows. The large plastic deformation occurred in the IZ and OZ, and the clean plastic metal contacted closely promoting dynamic recrystallization process and recrystallization process resulting in high quality FBW joints.
Microstructures of welding interface zone and OZ of FBW joints with different upset allowances (a) δu = 3.5 mm, (b) δu = 5.5 mm, and (c) δu = 7.5 mm.

Further investigate the microstructures in IZ of FBW joints with TEM analysis. The Fe3C phase was found in IZ confirmed by corresponding selected-area electron diffraction pattern, as Figs. 12(a) and 12(b) shows. A large number of small sized grains (about 1 μm) existed in IZ, shown by Fig. 12(c), and these small grains were formed by dynamic recrystallization process and recrystallization process during FBW. A large amount of dislocations [Fig. 12(d)] was produced in this zone due to large plastic deformation experienced. During the cooling process, the recrystallized grains grew into the reasonable size, and the common grains were formed in interface and high quality FBW joints were obtained.
TEM images of IZ (a) Fe3C phase, (b) electron diffraction pattern of Fe3C, (c) the small grains in interface, and (d) dislocations.

The OZ was characterized by coarsened grains. Formed under the large plastic deformation and high peak temperature, a large amount of tangled dislocations were produced in OZ of welded joints, as Fig. 13 shows.
TEM images of dislocations in OZ in FBW joints.

The macromorphology and microstructures of IZ, OZ in FBW joints were influenced by flash allowance and upset allowance greatly, while the characteristics of RZ and PZ were nearly unaffected by changing parameters.
The RZ consisted of fine ferrite and pearlite, as Fig. 14(a) shows. From the TEM images of RZ, the small NbC particle with the size of 100–300 nm precipitated in the ferrite matrix, as shown in Figs. 14(b) and 14(c). The curved dislocations were also found in this zone with amounts less than that in IZ and OZ, shown by Fig. 14(d). These had been related to the recrystallization effect experienced in this zone. The basic microstructures in PZ was ferrite of uneven size and pearlite of small size, in the microlevel, tangled dislocations were still observed in this zone, as Figs. 14(e) and 14(f) shows.
(a) The microstructures of RZ, (b) the TEM image of NbC particle, (c) the electron diffraction pattern of NbC, (d) the TEM image of curved dislocations in RZ, (e) the microstructures of PZ, and (f) the TEM image of tangled dislocations in PZ.

B. Joint mechanical properties
The heat source of FBW was the resistance heat produced by two faying surfaces and the FBW comprised heat, electricity, force and many welding parameters were involved in the welding process. To clarify the effects of welding parameters on welding joints quality and mechanical properties, the two welding parameters, flash allowance (δf) and upset allowance (δu), were changed individually to carry out welding, and mechanical tests (microhardness, tensile test, and bending test) were conducted on the welded joints to reveal the effecting laws.
1. Joint microhardness
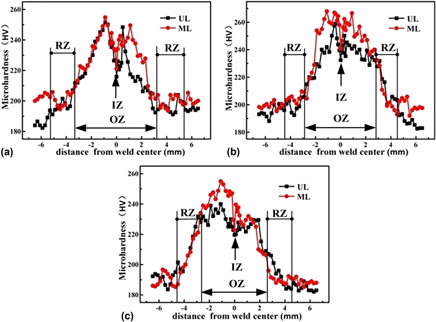
The macrohardness was measured along middle line (marked by ML) and along the line with the distance of 1 mm from joint upper surface (marked by ML) of FBW joints with different flash allowances (δf). To improve precision, the distance between the two hardness points was 0.1 mm within the range of 1 mm from weld center and then enlarged to 0.2 mm.
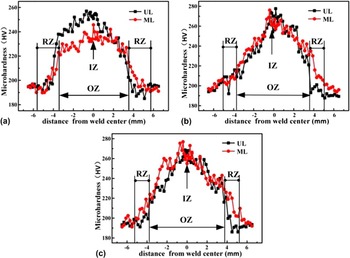
Figure 15 shows the microhardness curves of FBW joints at different flash allowances. The hardness distributed symmetrically about weld center approximately and unevenly across whole joints. As the results showed, the microhardness distributed law was similar at different flash allowances while the hardness value varied a lot: the average hardness in IZ and OZ was in the range of 250–270 HV, which was much higher than that of the recrystallization zone (RZ) and base metal (190 HV). The hardness value reached maximum at the OZ near IZ, and then decreased toward the base metal. The high hardness of IZ and OZ can be related to the coarsened upper bainite and large amount of dislocations formed during the upset process. The lower hardness in RZ and base metal mainly related to the main microstructures of ferrite and pearlite. The hardness in IZ was a little lower than its vicinity OZ was resulted from some ferrite in IZ and the amount of dislocations in IZ was less than OZ by recrystallization process and dynamic recrystallization process. The average hardness in IZ and OZ at δf = 8 mm was 235 HV in ML, which was lower than 270 HV at δf = 12, 16 mm. These may be related to the difference of cooling rate and plastic deformation amount in different locations.
Hardness distribution curves of FBW joints at different flash allowances (δf) (a) δf = 8 mm, (b) δf = 12 mm, and (c) δf = 16 mm.

Figure 16 shows the microhardness curves of FBW joints at different upset allowances. The average hardness in IZ and OZ was on the level of 240–260 HV, which was much larger than the hardness value of RZ and base metal on the level of 190 HV. The highest hardness appeared in the OZ next to the IZ, and then decreased toward the base metal. The average hardness of IZ and OZ was 260 HV at δu = 5.5 mm and higher than that of 240 HV on the condition of δu = 3.5, 7.5 mm. With δu increasing from 3.5 to 5.5 mm, the degree of plastic deformation and dislocations amount increased as well as lattice distortion intensified resulting in high hardness value. Further increasing δu from 5.5 to 7.5 mm, the plastic deformation amount was large enough to promote recrystallization process and dynamic recrystallization process leading to the formation of undistorted equiaxed grains in IZ and OZ, and decreasing dislocation amounts, which all decreased the hardness value.
Hardness distribution curves of FBW joints at different upset allowances (δu) (a) δu = 3.5 mm, (b) δu = 5.5 mm, and (c) δu = 7.5 mm.

2. Joint tensile properties
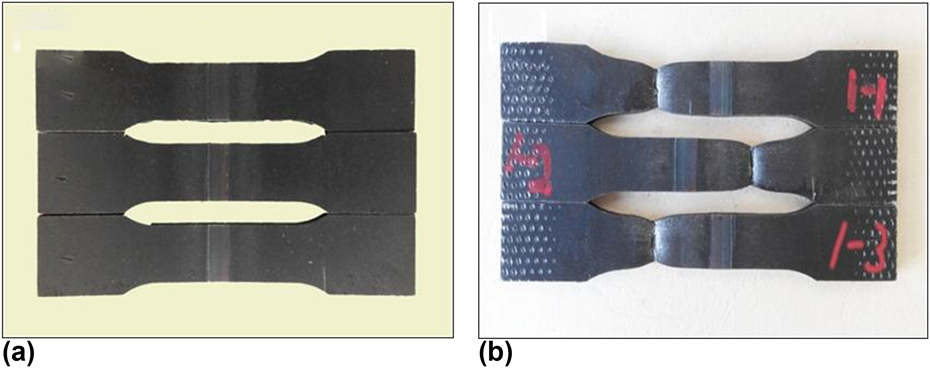
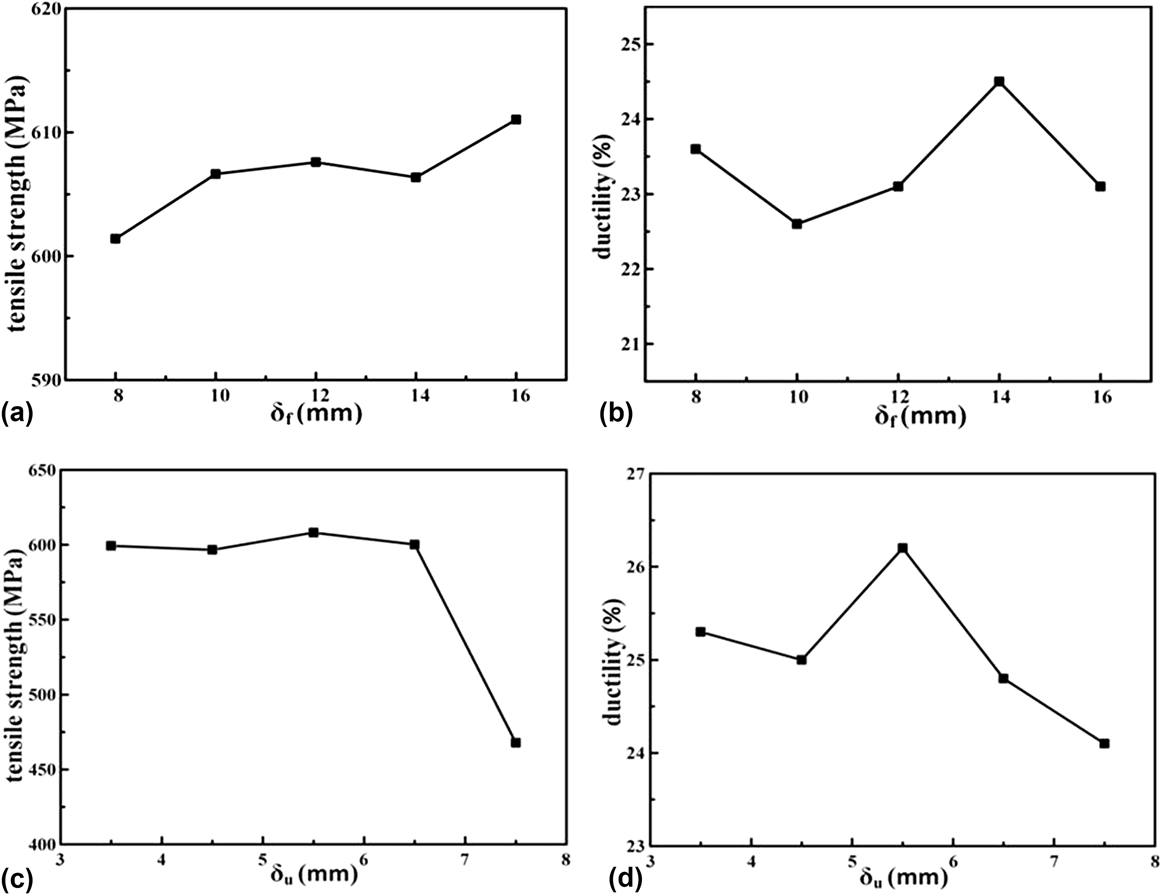
Figure 17 shows the appearance of tensile specimens before and after tensile tests. During the tensile test, a greater extent of necking took place by welded joints and all the FBW joints fractured in base metal. The tensile strengths and ductilities of FBW joints at different flash allowances are shown by Figs. 18(a) and 18(b). The tensile strengths of FBW joints at different δf were within a short range of 601.41–611.02 MPa without large variation and the tensile strength of welded joints were in good match with that of base metal (with the tensile strength of 590 MPa). The joints ductility had the tendency of increasing and then decreasing, and the lowest value was 22.6% at δf = 10 mm, and the highest value was 24.5% at δf = 14 mm. The joint input was small at low δf (8–10 mm) and the joints only performed limited plastic deformation. With δf increasing, both the heat inputs and the plastic deformation amount increased leading to ductility increase. The decrease of joint ductility may be caused by grains coarsened at δf = 16 mm.
The appearance of tensile specimens for FBW joints (a) prior to tensile test and (b) after tensile test.

The tensile strengths and ductilities of FBW joints (a) tensile strengths at different flash allowances (b) ductilities at different flash allowances (c) tensile strengths at different upset allowances (d) ductilities at different upset allowances.

The tensile strengths and ductilities of FBW joints at different upset allowances are shown in Figs. 18(c) and 18(d), the tensile strengths of FBW joints were relatively high in the range of 596.7–608.1 MPa when δu was changed from 3.5 to 6.5 mm, and then the strength dropped greatly to 467.8 MPa at δu = 7.5 mm. Considering the joints broken at base metal, it was a great possibility that the strength decrease had relationship with base metal quality. The ductilities of FBW joints reached the highest 26.2% at δu = 5.5 mm and gained the lowest value 24.1% at δu = 7.5 mm, and exhibited the tendency of increasing and then decreasing. When δu was within the range of 3.5–5.5 mm, as δu increased, large plastic deformation was experienced promoting dynamic recrystallization process and recrystallization process leading to the improvement of joints performance and the ductility increased as well. At larger δu (3.5–5.5 mm), the plastic deformation amount and dislocation amount further improved and tangled dislocations hindered further deformation processes occurrence resulting in ductility decrease.
Analyzing the tensile fracture by SEM at δu = 5.5 mm, the fracture morphology of the FBW joint was shown by Fig. 19. From the figure, we can see dimples with different sizes located on the fracture and some extent of tear mark was seen on the boundaries of dimples. These showed that large extent of plastic deformation took place by FBW joints before fracture indicating that the fracture mode was ductile fracture and the tensile properties of FBW joints was great.
The fracture morphology of FBW joint.

In tensile tests, all the samples fractured in base metal can be explained in two aspects: (i) the basic microstructures of base metal are ferrite and pearlite while the welding zone mainly consists of bainite, and the strength of bainite is better than ferrite and pearlite. (ii) The welding zone was formed under the large plastic deformation and through recrystallization process, therefore the deformation ability of welding zone is superior to base metal.
3. Joint bending properties
The bending test was conducted to FBW joints at different welding parameters. During the bending test, the bending force was applied to the weld center and the bending property was evaluated by bending crack length. The bending crack lengths at different flash allowances are listed in Table III. The test results showed that the bending properties of FBW joints were great, and that can meet the required standard (bending crack length less than 3 mm) and the bending crack only occurred at δf = 14 mm. This may be related to the grain coarsening at IZ and OZ under large δf (large heat inputs).
Bending test results of FBW joints at difference flash allowances.

The bending crack lengths at different upset allowances are listed in Table IV. Under this experiment, the bending properties of FBW joints were good as δu changed in the range of 3.5–7.5 mm. The bending crack length was 0.23 and 0.2 mm at δu = 4.5 mm and δu = 5.5 mm, respectively. When δu increased from 4.5 to 7.5 mm, the decrease of bending crack length can be explained as the increased δu improved the FBW joints formability by promoting recrystallization and dynamic recrystallization process.
Bending test results of FBW joints at difference upset allowances.

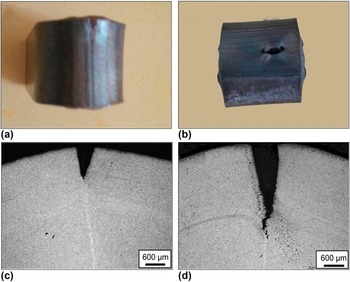
FBW joints 4 and 7 with bending crack were prepared in standard metallographic procedures for metallographic analysis, and the micromorphology of bending cracks is shown in Fig. 20. From the picture, bending cracks originated from the outer surfaces of joints and propagated along joint OZ and IZ due to coarsened upper bainite microstructures. Therefore, the IZ and OZ were weak parts in the whole joints. Considering that the oversize of bending crack lengths were small at different welding parameters, the FBW joints had great bending properties.
The appearance of bending microcracks for FBW joints (a and b) macromorphology, (c and d) micromorphology.

The flash allowance (δf) and upset allowance (δu) had significant effects on the microstructures and mechanical properties of FBW joints. Under this experimental condition, relatively large δf (10–12 mm) was recommended for providing appropriate heat inputs to improve FBW joints quality. At the mean time, too much δf should be avoided, which may harm the mechanical properties by grains coarsening. The upset allowance (δu) should be carefully controlled, low δu was not beneficial for liquid metal and oxide impurities extruding while high δu would cause large grains curves leading to low ductility. When the δu was in the range of 5.5–6.5 mm, the appropriate amount plastic deformation was performed and sound FBW joints were obtained by promoting recrystallization and dynamic recrystallization process.
IV. CONCLUSIONS
The RS590CL steels were welded by FBW method, and the effects of flash allowance and upset allowance on microstructures and mechanical properties of FBW joints were studied.
-
(1) The FBW joints formed well and the macromorphology was symmetrically, and crystal grain bending feature was easily seen. With δf increasing from 8 to 16 mm, OZ widths increased from 7 to 7.5 mm, while the welding zone widths decreased at first and then increased in the range of 9.6–11.62 mm. With δu increasing from 3.5 to 7.5 mm, the OZ widths and welding zone widths all had the tendency of decreasing, changing from 6.48 mm to 5.46 mm and 10.48 mm to 9 mm, respectively.
-
(2) The IZ mainly consisted of upper bainite, ferrite, and a small amount of pearlite, and the microstructures of OZ were upper bainite and a small part of pearlite. As flash allowance (δf) increased, the IZ width became larger and coarsened upper bainite was formed in IZ and OZ. With δu increasing, the large plastic deformation occurred and interface formability was improved.
-
(3) The average hardness in IZ and OZ was much higher than that in the recrystallization zone (RZ) and base metal. The hardness value reached maximum in OZ near IZ, and then decreased toward the base metal. The average hardness in IZ and OZ at δf = 8 mm was 235 HV, which was lower than that of 270 HV at δf = 12, 16 mm. At δu = 5.5 mm, the average hardness of IZ and OZ was 260 HV, the value was higher than 240 HV on the condition of δu = 3.5, 7.5 mm. All the tensile fractures occurred in base metal with some degree of necking and the tensile strength of joints was in good match with base metal and the ductility was a little lower than that of base metal. The bending properties of FBW joints were good and the bending crack length reached the highest 0.68 mm at δf = 14 mm.
-
(4) Under this experiment, the strength of FBW joints is relatively high and in the range of 590–610 MPa. On the welding condition of δf = 12 mm and δu = 5.5 mm, the properties of FBW joints reached the optimum of strength of 602 MPa and ductility of 26.2%.
ACKNOWLEDGMENTS
The authors would like to thank CITIC Metal Co., Ltd of China for the financial support (No. 2013-D067). They would also like to thank Mr. Quanzhi Sun from Jilin University for his assistance in the welding experiment.