Introduction
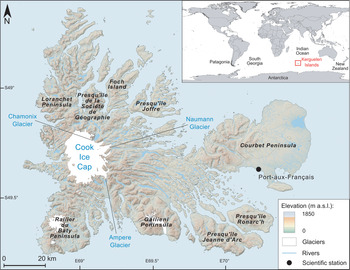
The Kerguelen Islands, discovered on 12 February 1772 by the French navigator Yves Joseph Kerguelen de Tremarec, covers an area of ~7200 km2 in the southern Indian Ocean in the sub-Antarctic zone (Fig. 1). This archipelago constitutes one of the five districts of the French Austral and Antarctic Territories (Terres Australes et Antarctiques Françaises, TAAF). It consists of a main island called Grande Terre, surrounded by > 300 islets, most of which are very close to the main island. The scientific station of Port-aux-Français (PAF), built in the 1950s, is located on the eastern part of Grande Terre.
Map of the Kerguelen Islands and the locations of the glaciers investigated and mentioned in this study. Inset shows the location of the archipelago in the sub-Antarctic region (digital elevation model from https://lpdaac.usgs.gov/products/srtmgl1v003, glacier outlines from the Global Land Ice Measurement from Space (GLIMS) database; Raup et al. Reference Raup, Racoviteanu, Khalsa, Helm, Armstrong and Arnaud2007). m a.s.l. = metres above sea level.

The Kerguelen Islands feature many glaciers in different parts of the archipelago. Small glaciers are present in the north on the Presqu'île de la Société de Géographie (Fig. 1). To the west, the Cook Ice Cap (CIC) culminates at 1049 m above sea level (a.s.l.) and in 2020 covered ~400 km2. It has ~15 outlet glaciers, including the largest French glacier, Ampere Glacier, on its south-eastern slope. It was glaciologically monitored in the 1970s (e.g. Poggi Reference Poggi1977, Vallon Reference Vallon1977a, Reference Vallon1977b) and again between 2010 and 2013 using stake measurements to determine its mass balance (Verfaillie et al. Reference Verfaillie, Favier, Dumont, Jomelli, Gilbert and Brunstein2015, Favier et al. Reference Favier, Verfaillie, Berthier, Menegoz, Jomelli and Kay2016). Further south, ~20 small glaciers cover the summits of the Rallier du Baty Peninsula and the slopes of Mount Ross, the highest peak in the archipelago (1850 m a.s.l.).
Moreover, the Kerguelen Islands are known to be home to various endemic plants, such as the Kerguelen cabbage (Pringlea antiscorbutica), as well as a world-renowned wealth of fauna. Kerguelen is home to the largest population of king penguins (Aptenodytes patagonicus) in the world (> 100,000 pairs), one of the largest colonies of wandering albatross (Diomedea exulans) and other birds across the austral region, as well as a very large number of fur seals and elephant seals (https://taaf.fr/en/presentation-of-the-territories). These populations of extraordinary plants and animals have motivated the creation of strict and semi-strict nature reserves and, on a larger scale, the creation in the near future of a national park for the conservation of these endemic species. Unfortunately, the archipelago has been invaded by a large number of rapidly developing invasive species (rabbits, rats, reindeer, dandelion, etc.), most of which were introduced during the last century (e.g. Lesel Reference Lesel1967, Chapui et al. Reference Chapui, Frenot and Lebouvier2004, Frenot et al. Reference Frenot, Chown, Whinam, Selkirk, Convey, Skotnicki and Bergstrom2005). Glaciers are the last ‘barrier’ against the colonization of almost the entire archipelago by these invasive species. However, glacier mass balance has been extremely negative in recent years, primarily due to atmospheric drying on the Kerguelen Islands caused by a shift of the storm tracks to more southerly latitudes (Favier et al. Reference Favier, Verfaillie, Berthier, Menegoz, Jomelli and Kay2016). The latter was induced by an intensification of the Southern Annular Mode (SAM), one of the most important climate features of the Southern Hemisphere high latitudes (e.g. Abram et al. Reference Abram, Mulvaney, Vimeux, Phipps, Turner and England2014). Mass balance values measured for the whole CIC between 2000 and 2010 are −1.59 ± 0.19 m water equivalent per year (w.e. year-1; Favier et al. Reference Favier, Verfaillie, Berthier, Menegoz, Jomelli and Kay2016). Taken individually, Ampere Glacier experienced even more negative values of −2.60 ± 0.30 m w.e. year-1 (Favier et al. Reference Favier, Verfaillie, Berthier, Menegoz, Jomelli and Kay2016). These extreme surface mass balance values, amongst the most negative worldwide documented over this period of time, are causing significant thinning of the ice cap. Thinning values during the 2000s of ~0.4 ± 0.1 m year-1 were measured right up to the summit of the ice cap (Favier et al. Reference Favier, Verfaillie, Berthier, Menegoz, Jomelli and Kay2016), while thinning close to the front of Ampere Glacier was in the order of 10 m year-1. The glacier front retreated 2.8 km between 1963 and 2003 (Berthier et al. Reference Berthier, Le Bris, Mabileau, Testut and Rémy2009) and an extra ~1.5 km from 2003 to the present. This recent glacier retreat implies the opening up of new sub-aerially exposed areas for endemic and invasive species to colonize. But will endemic species be able to compete with invasive species during this colonization phase? If we want to understand and predict the effects of the ice-cap wastage on the current and future (by the end of the twenty-first century) colonization of the archipelago by invasive species, we first need to contextualize the ice-cap evolution over a period in the past that was characterized by significant climate and glacier fluctuations. The last millennium is particularly suited for this experiment, due to the occurrence of the so-called Little Ice Age (LIA) between ca. 1400 and 1870 ce (Perren et al. Reference Perren, Hodgson, Roberts, Sime, van Nieuwenhuyze, Verleyen and Vyverman2020). The LIA corresponds to a period of Earth's history that was globally ~0.5°C colder than the end of the twentieth century (Solomina et al. Reference Solomina, Bradley, Hodgson, Ivy-Ochs, Jomelli and Mackintosh2015). This cooling was recorded through pronounced re-advances of mountain glaciers in many parts of the Northern Hemisphere; glacial evidence of the LIA in the Southern Hemisphere is, however, more seldom and less clear (e.g. Mann Reference Mann, MacCracken and Perry2002, Neukom et al. Reference Neukom, Gergis, Karoly, Wanner, Curran and Elbert2014, Solomina et al. Reference Solomina, Bradley, Hodgson, Ivy-Ochs, Jomelli and Mackintosh2015).
Downstream of the current front of Ampere Glacier, several moraines have been preserved and mapped (Frenot et al. Reference Frenot, Gloaguen, van de Vijver and Beyens1997, Jomelli et al. Reference Jomelli, Mokadem, Schimmelpfennig, Chapron, Rinterknecht and Favier2017). The outermost moraine was dated using the chlorine-36 (36Cl) cosmic ray exposure (CRE) method (Jomelli et al. Reference Jomelli, Mokadem, Schimmelpfennig, Chapron, Rinterknecht and Favier2017), in situ-produced 36Cl being the most suitable cosmogenic nuclide given Kerguelen's widespread volcanic lithologies. Although the uncertainties associated with the mean age of this moraine are too large to robustly assign its emplacement during the LIA, this mean age attests to a significant extension over the last millennium. To put the observed evolution of Ampere Glacier and the CIC over recent decades into a multi-centennial-scale context, the objective of this paper is to refine the evolution of the CIC and Ampere Glacier over the last millennium, investigate the associated climate conditions during this time and explore the potential evolution of CIC up to the end of the twenty-first century based on available future climatic scenarios. To this end, a glaciological model, constrained by CRE moraine dating, historical documents and recent direct mass balance observations, is used here to propose a mapping of different phases of extension between the last millennium and 2100 ce.
Study area
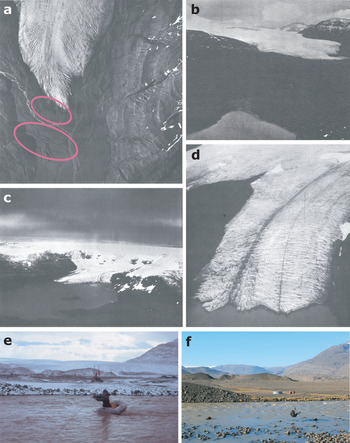
The Kerguelen Islands (Fig. 1) represent the emerged part of the Kerguelen submarine volcanic plateau, which appeared ca. 40 million years ago. At the beginning of the twentieth century, aboard the Charcot, Raymond Rallier du Baty explored the archipelago. A few years later, the French geologist Edgar Aubert de la Rüe and his wife Andrée began research on the geology and geography of the Kerguelen Islands. The geologist probably made the first description of the glacial forms and deposits observed on the archipelago. He described the presence of numerous erratic boulders and identified two morainic belts, one located in the southern part of the archipelago on the Rallier du Baty Peninsula near Baie de la Mouche and the other in the eastern part of the archipelago north of the Jeanne d'Arc Peninsula, both of which he attributed to the Last Glacial Maximum (Aubert de la Rüe Reference Aubert de la Rüe1932). Later in the 1960s, Jacques Nougier conducted a detailed geological and geomorphological survey of the Kerguelen Islands, with the editing of a 1:200,000-scale geological reconnaissance map (Nougier Reference Nougier1970). As a volcanic archipelago related to a hotspot beneath the Antarctic plate (Kerguelen hotspot), the islands are geologically dominated by Tertiary flood basalts ('Basalte des Plateaux') that occupy > 80% of the area. Other types of volcanic rocks are locally present, such as trachytes, basanites and phonolites (e.g. around the Mount Ross strato-volcano; Gallieni Peninsula), together with granitoids in the volcano-plutonic complex of Rallier du Baty. Although no eruptive activity has been recorded in historic times, active fumaroles can be observed in the south-west part of Grande Terre island in relation to youthful subglacial eruptive centres and Holocene trachytic lava flows (Ballestracci & Nougier Reference Ballestracci and Nougier1984). Beyond the detailed geological descriptions he made in his thesis, Nougier (Reference Nougier1970) also provided some geomorphological and glaciological observations, which were consistent with Aubert de la Rüe's observations in the previous decades. He described and mapped many systems of lateral and frontal moraines that he attributed to the LIA, and he calculated simple surface indices showing the extent of glacier recession between the 1930s and 1960s. Other historical sources attest to larger glacier extents in the last century (e.g. Aubert de la Rüe Reference Aubert de la Rüe1967, Durand de Corbiac Reference Durand de Corbiac1970), especially on the eastern slope of the ice cap (Fig. 2).
Old and recent photographs of outlet glaciers of the Cook Ice Cap (CIC) from Nougier (Reference Nougier1970), Durand de Corbiac (Reference Durand de Corbiac1970) and this study. a. Vertical photograph (1/24,000 scale) of Ampere Glacier taken by Bauer in the summer of 1962–1963, with several morainic belts (circled in pink) visible below the glacier front. b. Ground photograph of Ampere Glacier taken by Nougier from the location of Lac Jaune between 1961 and 1965. c. & d. Aerial photographs of Chamonix (c.) and Naumann (d.) glaciers, located on the eastern slope of the CIC, taken by Frölich in the summer of 1965–1966. e. & f. Ground photographs taken from the same spot in front of Ampere Glacier in 1975 by P. Bois (e.) and in 2013 by V. Rinterknecht (f.), showing moraines closest to the current front of Ampere Glacier. Comparing these two photographs also highlights the dramatic shrinkage of the glacier during this 40-year period.

The PAF weather station, set up in the 1950s (Fig. 1), provides one of the longest meteorological time series at this latitude of the Southern Hemisphere. The climate on the Kerguelen Islands is oceanic. The average annual temperature is 4.5°C with a low amplitude of ~6°C. In summer, the average temperature is ~8°C, while it is ~2°C in winter. The maxima rarely exceed 20°C, while minima rarely reach values below −10°C. Precipitation, mainly from western lows, is ~800 mm year-1 at PAF, but exceeds 3000 mm year-1 in the west near the CIC due to the marked föhn effect (Verfaillie et al. Reference Verfaillie, Favier, Dumont, Jomelli, Gilbert and Brunstein2015, Reference Verfaillie, Favier, Gallée, Fettweis, Agosta and Jomelli2019, Favier et al. Reference Favier, Verfaillie, Berthier, Menegoz, Jomelli and Kay2016).
Methods
A set of field-based and laboratory analyses combined with a glaciological model was performed in order to characterize the different phases of CIC extensions between the last millennium and 2100 ce. The methods are presented below into four subsections, describing the glacier extent modelling (for past extents and for future extents), how the past extents are constrained chronologically and spatially, the past climate scenarios derived from the modelling and the future climate scenarios.
Glacier extent modelling
The extension of the CIC and the outlet glaciers was simulated using a positive degree-day glaciological model combined with a cellular automaton applied to a digital elevation model (DEM), which allows for the 3D simulation of the advance or retreat of a glacier as a function of altitude. This glaciological model has been successfully applied several times under different geomorphological and climatic conditions (Blard et al. Reference Blard, Lave, Pik, Wagnon and Bourles2007, Jomelli et al. Reference Jomelli, Khodri, Favier, Brunstein, Ledru and Wagnon2011, Biette et al. Reference Biette, Jomelli, Favier, Chenet, Agosta and Fettweiss2018, Protin et al. Reference Protin, Schimmelpfennig, Mugnier, Ravanel, le Roy and Deline2019).
The model works by estimating accumulation and ablation on the glacier surface under set climatic conditions. Accumulation is calculated as a function of daily precipitation, a rain/snow limit temperature (here 1°C) and daily temperatures. Ablation is calculated as a function of two melting parameters (or degree-day factors, which represent the daily volume of snow and ice melted when the temperature is positive) and monthly temperatures. Glacier melting occurs when air temperature 1–2 m above the glacier surface is above the melting point (0°C). The total melt over a period of time at some point on the glacier is therefore proportional to the sum of daily average positive temperatures at the same point (i.e. the positive degree-day total). The difference between accumulation and ablation generates an annual surface or climatic mass balance associated with an equilibrium line. The cellular automaton applied to the 2009 DEM (125 m resolution) from Berthier et al. (Reference Berthier, Le Bris, Mabileau, Testut and Rémy2009) then simulates the past and future extension of the CIC.
The rain/snow limit temperature, the air temperature gradient and the melting parameters were calibrated from meteorological and mass and energy balance measurements carried out on the surface of Ampere Glacier between 2010 and 2014 (Verfaillie et al. Reference Verfaillie, Favier, Dumont, Jomelli, Gilbert and Brunstein2015, Favier et al. Reference Favier, Verfaillie, Berthier, Menegoz, Jomelli and Kay2016) and were considered time-invariant. Eight different temperature gradients were computed for eight sectors corresponding to the glacier azimuth (every 45°) and considered constant with elevation, following Favier et al. (Reference Favier, Verfaillie, Berthier, Menegoz, Jomelli and Kay2016). Precipitation was also calibrated depending on elevation, following the relationship from Favier et al. (Reference Favier, Verfaillie, Berthier, Menegoz, Jomelli and Kay2016). Palaeo-extents documented from moraine records and old documents were used to validate the glaciological model in order to better constrain the future extents. Simulation of past glacier extents (early LIA, 1963 and 2009) follows the methods described in Favier et al. (Reference Favier, Verfaillie, Berthier, Menegoz, Jomelli and Kay2016). One should note that this model was not designed to simulate transient glacial states but rather pseudo-equilibrium states on decadal to centennial timescales.
Chronological and spatial constraints to simulate past extents
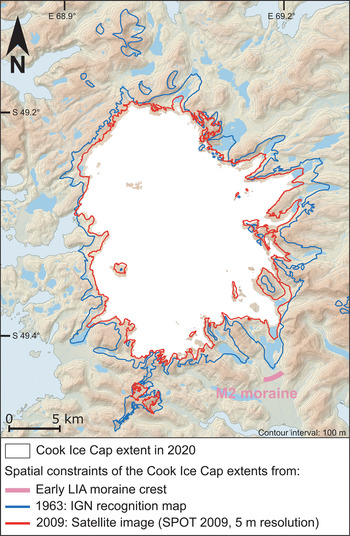
There are few sources available to map the past glacial extents of the Kerguelen Islands. For the CIC, Berthier et al. (Reference Berthier, Le Bris, Mabileau, Testut and Rémy2009) used the 1:200,000 topographic reconnaissance map drawn up in 1967 by the National Geographic Institute (Institut Géographique National, IGN) and a Landsat satellite image from 2001. The IGN initial 1:200,000 cartographic product, the first modern topographic map of the Kerguelen Islands, is based on an aerial survey carried out from 1963 to 1966 during various IGN/TAAF campaigns on board Alouette II helicopters provided by the French Air Force. The two inventories from 1963–1966 and 2001 are available in the Global Land Ice Measurements from Space database (http://www.glims.org, Raup et al. Reference Raup, Racoviteanu, Khalsa, Helm, Armstrong and Arnaud2007). Glacial extents in 1963 and 2009 were then vectorized from two other sources to provide more data. Firstly, we used a 1:100,000 version (three sheets) of the IGN topographic reconnaissance map, enriched with toponymy (Durand de Corbiac Reference Durand de Corbiac1970). Compared to this earlier map, the 1:100,000 document has an improved resolution allowing for the display of smaller topographic features. For example, the nunatak of Dulong, in the southern part of the CIC, which does not appear on the 1:200,000 sheet, appears on the 1:100,000 version. Geo-referencing of these three sheets involved adding more control points to make it consistent with the 1:200,000 sheet. For this purpose, we used the high-resolution coastline produced by the Hydrographic and Oceanographic Service of the French Navy as a reference. Secondly, we vectorized an additional glacial extension using a Satellite Pour l'Observation de la Terre (SPOT) 2009 image of 5 m resolution acquired in good weather conditions. A complementary moderate-resolution imaging spectroradiometer (MODIS) image at 250 m resolution is also available for 2009 from Verfaillie et al. (Reference Verfaillie, Favier, Dumont, Jomelli, Gilbert and Brunstein2015). These various cartographic and satellite sources therefore provide a map of the glacial extensions of the CIC in 1963 (between 1963 and 1966 depending on the area photographed), 2001 and 2009 (Fig. 3).
Chronological and spatial constraints for the extents of the Cook Ice Cap (CIC) for the early Little Ice Age (LIA), 1963 and 2009. The CIC extent in 2020 was derived from Pléiades satellite images acquired through the Pléiades Glacier Observatory (PGO) programme. The digital elevation model is from http://lpdaac.usgs.gov/products/srtmgl1v003. IGN = Institut Géographique National; SPOT = Satellite Pour l'Observation de la Terre.

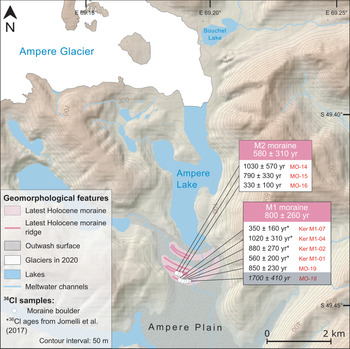
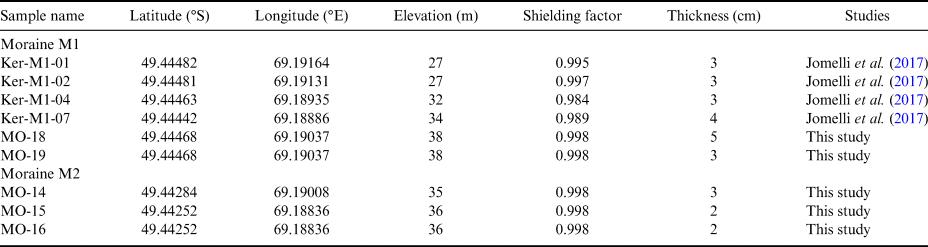
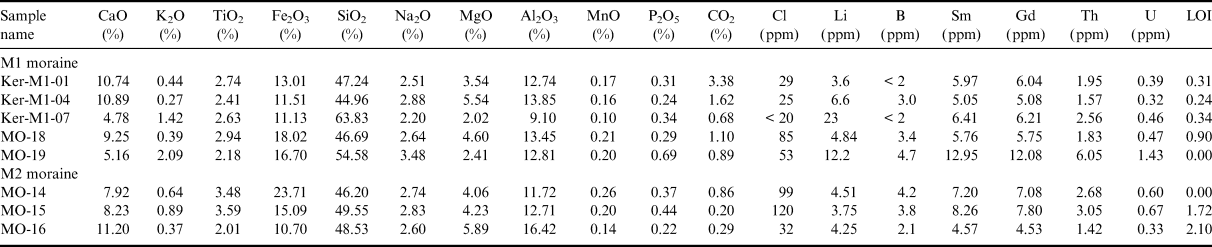
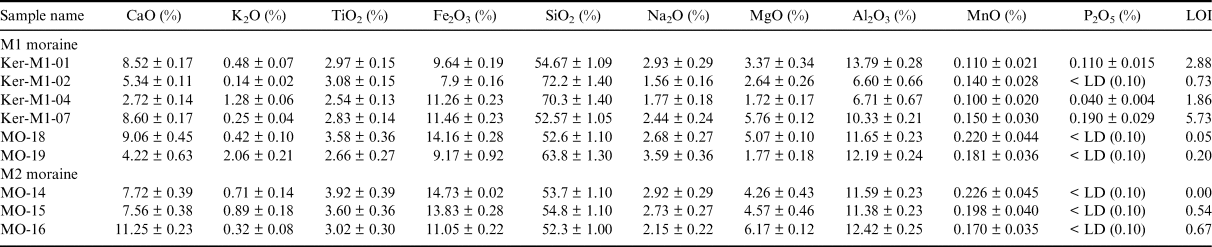
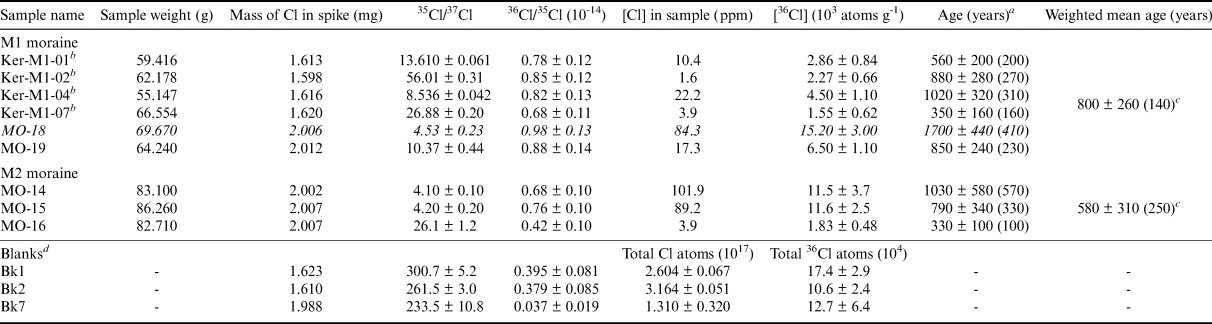
For glacial extents that predate the instrumental records, the glaciological model and the cellular automaton were constrained with glacial landforms, which are ice-marginal moraines. The IGN map shows moraines east of the ice cap, most of them located between a few hundred metres or a few kilometres from the current glacier front. Similar sequences of glacial deposits are also present on the proglacial margins of other glaciated massifs of the archipelago, such as on Rallier du Baty Peninsula, on the Presqu'île de la Société de Géographie and on Gallieni Peninsula (Fig. 1). The Ampere valley, located south-east of the ice cap (Fig. 1), with its six large moraines mapped on the IGN map, is probably the best site in the Kerguelen Islands to investigate glacier evolution during the last millennium. Almost 30 years ago, Frenot et al. (Reference Frenot, Gloaguen, Picot, Bougère and Benjamin1993) proposed the first chronological estimation of their deposition during the LIA based on the radial growth of Azorella selago dating technique. In addition, this set of ice-marginal moraines, which are not a common feature at the base of CIC outlet glaciers mostly due to off-shore deposition, are well preserved and relatively easy to access. The furthest downstream M1 moraine, located at ~7 km from the current ice front of Ampere Glacier, was dated by Jomelli et al. (Reference Jomelli, Mokadem, Schimmelpfennig, Chapron, Rinterknecht and Favier2017) using 36Cl CRE dating. Five rock surface samples collected from boulders on the M1 moraine had an arithmetic mean age and standard deviation of 700 ± 320 years (corresponding to 1310 ± 320 ce; Jomelli et al. Reference Jomelli, Mokadem, Schimmelpfennig, Chapron, Rinterknecht and Favier2017). To corroborate this age, potentially reduce its uncertainty and add further constraints to the glacier fluctuations within the last millennium, we collected five new samples during a field campaign in 2017–2018. Using a hammer and chisel, two new samples (MO-18 and −19) were extracted from the uppermost ~3–4 cm surface of flat boulders embedded in the M1 moraine (Fig. 4). Three other samples (MO-14, −15 and −16) were taken from the M2 moraine, located 200 m upstream of the M1 moraine (Fig. 4). The geographical coordinates were measured using a handheld Garmin GPS device, while the geometry of the surrounding horizon was determined using a compass and a clinometer for the calculation of the topographic shielding factor. All detailed sample information is shown in Table I. The five new samples collected on the archipelago were shipped to the Centre de Recherche et d'Enseignement de Géosciences de l'Environnement (CEREGE) laboratory in Aix-en-Provence, France, where the basaltic whole-rock samples were prepared for in situ-produced 36Cl CRE dating, following the same methods as those described in the online supplemental material of Charton et al. (Reference Charton, Jomelli, Schimmelpfennig, Verfaillie, Favier and Mokadem2020). The chemical compositions of the bulk rocks and the chemically treated sample fractions, which are needed to compute the exposure ages, are listed in Tables II and III. The resulting individual 36Cl ages are presented in Table IV with their 1σ uncertainties and their analytical uncertainties in parentheses. In the main text and in the figures, the individual ages are indicated with their analytical uncertainties to allow internal comparison between the calculated ages. Statistical populations were determined in accordance with glacial landforms and checked using a χ2 test in order to identify outliers. For each moraine sample population, we present here mean ages weighted by their relative uncertainties instead of arithmetic mean ages, as is done in Jomelli et al. (Reference Jomelli, Mokadem, Schimmelpfennig, Chapron, Rinterknecht and Favier2017), thus increasing the significance of the analytically most precise results. The weighted means are reported with their full uncertainties in Table IV, with results for each age population from the calculation of the weighted error (given in parentheses in Table IV) added to the analytical and production rate uncertainties by quadrature propagation. This allows for the comparison of the results with other palaeo-climatic records.
Glacio-geomorphological map of Ampere Glacier on a 40-m resolution digital elevation model (from http://lpdaac.usgs.gov/products/srtmgl1v003, glacier outlines were derived from Pléiades satellite images acquired through the Pléiades Glacier Observatory (PGO) programme). White boxes show chlorine-36 (36Cl) ages of individual moraine boulders with their inferred analytical uncertainties. The weighted mean ages of both moraines are shown in coloured boxes with their full uncertainties (i.e. weighted errors, analytical and production rate uncertainties). The sample highlighted in grey is rejected as an outlier (based on a χ2 test) and therefore excluded from the moraine mean age and the discussion.

Geographical sample locations, topographical shielding factors and sample thicknesses.

Chemical compositions of the bulk rock samples before chemical treatment. Analysis performed at the SARM-CRPG (Nancy, France) by inductively coupled plasma optical emission spectrometry (major elements), inductively coupled plasma mass spectrometry (trace elements), atomic absorption (Li), colorimetry (B) and spectrophotometry (Cl).

LOI = loss on ignition.
Concentrations of the major element oxides, including the target elements for chlorine-36 production, Ca, K, Ti and Fe, determined in splits taken from the samples after the chemical pre-treatment (acid etching). Analysis performed at the SARM-CRPG (Nancy, France) by inductively coupled plasma optical emission spectrometry.

LD = limit of detection; LOI = loss on ignition.
Chlorine-36 (36Cl) dating results. Spike is enriched in 35Cl (~99.9%). 36Cl/35Cl and 35Cl/37Cl ratios were inferred from measurements at the accelerator mass spectrometry facility of Accélérateur pour les Sciences de la Terre, Environnement, Risques (ASTER) after normalization to the in-house standard SM-CL-12, using an assigned value of 1.428 (± 0.021) × 10-12 for the 36Cl/35Cl ratio (Merchel et al. Reference Merchel, Bremser, Alfimov, Arnold, Aumaître and Benedetti2011) and assuming a natural ratio of 3.127 for the stable ratio 35Cl/37Cl. Samples in italics were rejected as outliers and excluded from mean age calculations.

a Age uncertainties are reported at 1σ level and were calculated through full propagation of analytical and production rate errors. Numbers in parentheses are analytical uncertainties only.
b Samples from Jomelli et al. (Reference Jomelli, Mokadem, Schimmelpfennig, Chapron, Rinterknecht and Favier2017).
c Weighted errors.
d Bk1 was processed with the samples Ker-M1-01, −04 and −07. Bk2 was processed with the sample Ker-M1-02. All of the other samples were prepared with Bk7.
Past climate scenarios
For the oldest past extent considered here, the glaciological mass balance model combined with the simple ice-flow dynamic model was then used to invert the palaeo-climate conditions (considering several temperature and precipitation scenarios) responsible for the stillstand or advance documented from the second outermost CRE-dated preserved moraine, associated with an estimate of the equilibrium-line altitude (ELA) and mass balance changes for the palaeo-glacial extent. To select the best temperature and precipitation scenario amongst the different available temperature-precipitation couples, we performed a comparison with the oldest temperature reconstruction in the region, the Extended Reconstructed Sea Surface Temperature version 2 (ERSSTv2; Smith & Reynolds Reference Smith and Reynolds2004) data, over the nineteenth century. Although the CIC extent in the nineteenth century is unknown, the LIA is known to have terminated in many parts of the world in the nineteenth century, sometimes with maximum glacier extents (e.g. Mann Reference Mann, MacCracken and Perry2002, Neukom et al. Reference Neukom, Gergis, Karoly, Wanner, Curran and Elbert2014, Solomina et al. Reference Solomina, Bradley, Hodgson, Ivy-Ochs, Jomelli and Mackintosh2015). Therefore, it is very probable that one of the nearby inner (undated) moraines was deposited during the nineteenth century, and the ERSSTv2 dataset is thus a good approximation of the temperature conditions that prevailed during the LIA. Once temperature was set, we determined the corresponding precipitation scenario from the temperature-precipitation couple that allowed us to reconstruct the early LIA extent of CIC.
Climatic conditions for 1963 were considered the same as those observed over the period 1935–1962, which is the reference period in this study, corresponding to a period of relative glacier stability according to Favier et al. (Reference Favier, Verfaillie, Berthier, Menegoz, Jomelli and Kay2016). For 2009, the observed mean climate conditions of temperature and precipitation prevailing from 2000 to 2010 were considered.
Future climate scenarios
Previous studies have shown that most climate models have deficiencies in the Kerguelen region over the recent period (Favier et al. Reference Favier, Verfaillie, Berthier, Menegoz, Jomelli and Kay2016, Verfaillie et al. Reference Verfaillie, Favier, Gallée, Fettweis, Agosta and Jomelli2019). More specifically, they are unable to accurately represent the amounts and intensity of precipitation in the region because of an incorrect representation of atmospheric circulation changes (e.g. those related to the SAM). In this study, we have selected the model that best simulates the observations in terms of precipitation amounts and temperature as inputs to the glaciological model, thereby giving the best surface mass balance estimates over the recent period (Verfaillie et al. Reference Verfaillie, Favier, Gallée, Fettweis, Agosta and Jomelli2019). The model is ACCESS1-3 (Commonwealth Scientific and Industrial Research Organisation and Bureau of Meteorology, Australia) from the Coupled Model Intercomparison Project phase 5 (CMIP5; Taylor et al. Reference Taylor, Stouffer and Meehl2012), forced here by the two available Representative Concentration Pathway (RCP) climate change scenarios, RCP4.5 and RCP8.5 (Moss et al. Reference Moss, Edmonds, Hibbard, Manning, Rose and van Vuuren2010), over 2006–2100. We simulate the projected CIC extent in 2100 using 10 year mean-corrected temperature and precipitation outputs for the 2090–2100 period from this model, fed into the glaciological model. Indeed, in spite of a good agreement of ACCESS1-3 model outputs with reanalysis of mean summer temperature and annual specific humidity at 850 hPa over the Southern Ocean (Verfaillie et al. Reference Verfaillie, Favier, Gallée, Fettweis, Agosta and Jomelli2019), the modelled temperature and precipitation at PAF still present large biases over the period 1950–2005. Therefore, the mean and the standard deviation of temperature and the mean of precipitation were corrected. Corrected temperature ( $T_{ACCESS}^{corr} $) for the present situation was calculated as in Eq. (1):
 $$T_{ACCESS}^{corr} = \displaystyle{{T_{ACCESS}\;-\;\overline {T_{ACCESS}( {2000} ) } } \over {\sigma ( {T_{ACCESS}( {2000} ) } ) }} \times \sigma ( {T_{obs}} ) + \overline {T_{obs}} , \;$$
where T ACCESS is the original daily temperature given by ACCESS1-3, 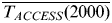 $\overline {T_{ACCESS}( {2000} ) } \;$and σ(T ACCESS(2000)) are the mean and standard deviation of T ACCESS over 1995–2005 and
 $\overline {T_{obs}} $ and σ(T obs) are the mean and standard deviation of observed temperature over 2000–2010. The temperature biases were removed by comparing observations from 2000 to 2010 and modelled data from 1995 to 2005 because the model already displayed significant warming over the end of the twentieth century. Precipitation biases were removed by applying the ratio between the mean modelled precipitation over 1950–2005 and the mean observed precipitation over 2000–2010 to the daily modelled precipitation. This correction reproduces the precipitation amount observed over the period of 2000–2010. Mean modelled precipitation over 1950–2005 was chosen because ACCESS1-3 did not display any significant trend over this period.
For future simulations, the correction ratio for precipitation was kept constant, so that future precipitation changes only reflect the increase related to Clausius-Clapeyron processes already included in the ACCESS1-3 modelling results (not the increase due to circulation changes, usually a weak contribution in the CMIP5 models). Future temperature biases were removed by assuming that the correction of the standard deviation of ACCESS1-3 temperature remains constant with time. As temperature increases with time, the correction needs to account for the difference between T ACCESS and the mean temperature in the future, T ACCESS(2100), as in Eq. (2):
 $$T_{ACCESS}^{corr} = \left({\displaystyle{{T_{ACCESS}\;-\;\overline {T_{ACCESS}( {2100} ) } } \over {\sigma ( {T_{ACCESS}( {2000} ) } ) }} \times \sigma ( {T_{obs}} ) + \overline {T_{obs}} } \right) + ( {\;\overline {T_{ACCESS}( {2100} ) } -\;\overline {T_{ACCESS}( {2000} ) } } ) , \;$$
where  $\overline {T_{ACCESS}( {2100} ) } $ is the mean temperature over 2090–2100. In Eq. (2), the first term allows T ACCESS to conserve the standard deviation of observations in the 2000s, whereas the second term accounts for T ACCESS warming between 2000 and 2100.
The climatic trends given for the twenty-first century by ACCESS1-3 for the RCP8.5 scenario (warming of 0.026°C year-1 and precipitation increase of 2.13 mm year-1, before bias correction of precipitation) are close to those given by the ‘mean model', defined as the average output of the 36 different models from CMIP5 (mean warming of 0.029°C year-1, with a standard deviation of 0.009°C year-1, and precipitation increase of 1.92 mm year-1, with a standard deviation of 0.76 mm year-1). The mean model is expected to exhibit weaker large-scale biases than most of the models taken individually. Assuming the consistent stationarity of large-scale biases from CMIP5 models (Krinner & Flanner Reference Krinner and Flanner2018), ACCESS1-3 will remain within the best models for Kerguelen in the future.
Results
36Cl ages from Ampere Glacier's moraines
The 36Cl ages at the base of Ampere Glacier span from 330 ± 100 to 1700 ± 410 years (Fig. 4 & Table IV). The previously determined boulder ages on the outermost M1 moraine of 560 ± 200 years (Ker M1-01), 880 ± 270 years (M1-02), 1020 ± 310 years (M1-04) and 350 ± 160 years (M1-07) are complemented with ages from the two samples MO-18 and −19, which are 1700 ± 410 and 850 ± 230 years, respectively. MO-18 was rejected as an outlier, probably because of prior exposure to cosmic rays. The remaining ages yield a weighted mean age and full uncertainty of 800 ± 260 years (n = 5), corresponding to the year 1220 ± 260 ce. 36Cl ages of MO-14, −15 and −16, collected on the M2 moraine, are 1030 ± 570, 790 ± 330 and 330 ± 100 years, respectively. M2 moraine weighted mean age and full uncertainty are 580 ± 310 years (n = 3), corresponding to the year 1440 ± 310 ce.
Extent of the ice cap during the last millennium and associated climate scenario
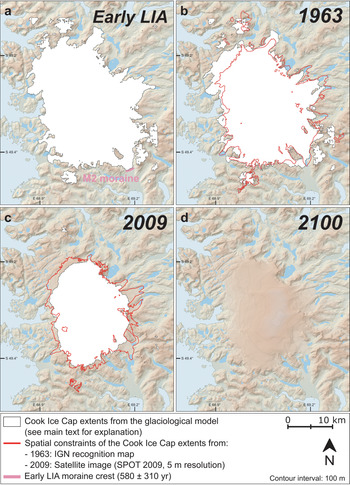
During the beginning and middle of the last millennium, the CIC had a relatively large extent, as indicated by the mean 36Cl ages of the dated M1 and M2 moraines: 1220 ± 260 ce and 1440 ± 310 ce, respectively. The glacier re-advance that led to the formation of the M2 moraine could be considered as representative of the early LIA in the islands, while the M1 moraine was probably deposited at the beginning of the last millennium. As is shown in Fig. 5a, we used the position of the M2 moraine to constrain the simulated extent of the CIC during the early LIA advance using the glaciological model.
Modelled extents of the Cook Ice Cap (CIC) for a. the early Little Ice Age (LIA), b. 1963, c. 2009 and d. 2100 under the RCP8.5 scenario from the glaciological model (see main text for explanation). The early LIA M2 moraine crest is represented in pink and spatial constraints for the CIC extents in 1963 and 2009 are represented by red contours. The digital elevation model is from http://lpdaac.usgs.gov/products/srtmgl1v003. IGN = Institut Géographique National; SPOT = Satellite Pour l'Observation de la Terre.

Figure 5b and c and Table V show the simulated extents of the CIC in 1963 and 2009, respectively, in comparison with the spatial extents mapped from the IGN topographic reconnaissance map and the SPOT 2009 satellite image, as well as the modelled ELAs. It can be noted that, in 1963, the glaciological model overestimates the extent of the CIC, while in 2009, it underestimates it, especially at the location of Ampere Glacier and more generally for outlet glaciers on the eastern slope of the CIC. Between the early LIA and 1963, the CIC surface area loss based on the IGN map is estimated at ~20%, while the glaciological modelling indicates a CIC surface area loss of only ~11%. The modelled ELA slightly increased between the early LIA and 1963, evolving from 614 to 638 m a.s.l. Since the 1970s, the ice cap has retreated dramatically, losing ~22% of its surface area between 1963 and 2009 according to the IGN map and the 2009 satellite image, while the glaciological modelling suggests 41% of area loss, assuming the modelled extent in 2009 represents a permanent regime (equilibrium state of the CIC). The modelled ELA increased markedly between 1963 and 2009, by ~170 m (from 638 to 807 m a.s.l.). The differences between the ice extents derived from the historical documents and the glaciological modelling are analysed in the ‘Discussion’ section.
Comparison of modelled and observed glacial extents (in km2) of the Cook Ice Cap for the different periods analysed in this study. The modelled equilibrium-line altitudes (ELAs) are also given.

Palaeo-climatic conditions of temperature and precipitation that best represent the location of the early LIA M2 moraine according to the glaciological modelling were selected (Table VI). Based on a comparison with the ERSSTv2 sea surface temperature reconstruction for the nineteenth century, a temperature 0.17°C cooler on average compared to the reference period 1935–1962 (period of glacier stability; see the ‘Methods’ section) was selected among the available potential scenarios. Once temperature was set, mean precipitation amounts similar to those measured over this reference period were needed to reproduce the extent of Ampere Glacier during the early LIA, corresponding to the M2 moraine. From 1963 to 2009, temperature increased slightly (by 0.47°C), but the main contributor to the ice-cap retreat was precipitation decrease. Observed precipitation decreased by 49% between 1963 and 2009 (Table VI).
Summary of the climatic scenarios of temperature and precipitation evolution between the early Little Ice Age (LIA; 1440 ± 310 ce) and 1963 (corresponding to the reference period 1935–1962), 1963 and 2009 (corresponding to the period 2000–2010) and 2009 and 2100 (corresponding to the period 2090–2100) for the two Representative Concentration Pathway (RCP) scenarios. See the ‘Methods’ section for details about the periods considered.

Estimation of CIC extent in 2100 based on future climate scenarios
The simulated CIC extent for 2100 based on the glaciological model driven by the Australian ACCESS1-3 climate model is displayed in Fig. 5d and Table V. In this model, under the RCP4.5 (respectively, RCP8.5) scenario, future temperature in 2100 is expected to increase by 1.0°C (2.3°C) compared to 2009, while precipitation is predicted to increase by ~11% (~23%), as shown in Table VI. Based on the glaciological modelling, if the RCP4.5 scenario is considered, the CIC would be reduced to ~137 km2 and the ELA would rise by 131 m (from 807 to 938 m a.s.l.). Under the RCP8.5 scenario, the ice cap would completely disappear by 2100. The modelled ELA would increase by ~270 m (from 807 to 1077 m a.s.l.), with an ELA above the summit of the CIC (1049 m a.s.l.) in 2100. Roughly, the results indicate that the mass balance values and ELA simulated for 2100 using RCP4.5 are comparable to the ones for 2050 using RCP8.5 (not shown).
As a sensitivity test, alternative hypotheses were tested, such as using precipitation values similar to those observed over the 2010s (i.e. 50% higher than during the 2000s) or over the 1950s (i.e. 100% higher than during the 2000s). This allows for the analysis of the behaviour of the CIC if precipitation would increase strongly or very strongly in the future, respectively. Under RCP8.5, a strong increase in precipitation would lead to a decrease of ~83% in CIC extent between 2009 and 2100 (85% if the observed extent in 2009 is considered), while a very strong increase in precipitation would lead to a 51% decrease (59%, respectively) in glacial extent (not shown).
Discussion
The early LIA in the Kerguelen Islands
36Cl CRE ages from moraine boulders collected on Ampere Glacier's proglacial margin provide evidence of several glacial advances that occurred during the last millennium. The first (oldest) advance is recorded by the outermost M1 moraine, dated at 800 ± 260 years ago (1220 ± 260 ce), and a subsequent advance or stillstand led to the formation of the M2 moraine, dated at 580 ± 310 years ago (1440 ± 310 ce) (Fig. 4). At least four other younger moraines located upstream remain undated. Considering uncertainties (± 310 years for the M2 moraine), it is probable that the M2 glacial advance is linked with the global cold event of the early LIA. However, we do not rule out the possibility that the M2 moraine was deposited prior to the onset of the LIA, at the beginning of the last millennium (ca. 1100 ce), as observed in the Northern Hemisphere (Solomina et al. Reference Solomina, Bradley, Hodgson, Ivy-Ochs, Jomelli and Mackintosh2015). Similarly, the M1 moraine was probably deposited at the beginning of the last millennium, but, considering uncertainties (± 260 years for the M1 moraine), it may also have been deposited at the onset of the LIA.
Thus, in situ-produced 36Cl CRE-dated moraines suggest a significant extension of the CIC beyond its present-day size during the early LIA (Figs 4 & 5a). This is consistent with the general glacial advances (Solomina et al. Reference Solomina, Bradley, Hodgson, Ivy-Ochs, Jomelli and Mackintosh2015) widely observed in the Northern Hemisphere (e.g. Mann Reference Mann, MacCracken and Perry2002, Ivy-Ochs et al. Reference Ivy-Ochs, Kerschner, Maisch, Christl, Kubik and Schlüchter2009), but also in the Southern Hemisphere. In particular, larger-than-today glacial extensions have been identified in Patagonia (e.g., Reynhout et al. Reference Reynhout, Sagredo, Kaplan, Aravena, Martini and Moreno2019) and New Zealand (Schaefer et al. Reference Schaefer, Denton, Kaplan, Putnam, Finkel and Barrell2009, Putnam et al. Reference Putnam, Schaefer, Denton, Barrell, Finkel and Andersen2012) in the second half of the past millennium. However, geomorphological observations of these LIA glacial advances are scarce on the sub-Antarctic islands (e.g. Oppedal et al. Reference Oppedal, Bakke, Paasche, Werner and van der Bilt2018) because most glaciers were calving into the ocean at that time, leaving few datable terrestrial moraines.
Contrary to the present day, for which the SAM index is positive, a negative SAM index has been proposed for the period from ca. 1400 to ca. 1600 ce (Abram et al. Reference Abram, Mulvaney, Vimeux, Phipps, Turner and England2014, Perren et al. Reference Perren, Hodgson, Roberts, Sime, van Nieuwenhuyze, Verleyen and Vyverman2020). A negative phase is expected to imply larger precipitation amounts and colder temperatures than during the reference period of 1961–1990 ce in Abram et al. (Reference Abram, Mulvaney, Vimeux, Phipps, Turner and England2014). This is also confirmed by a recent study by Perren et al. (Reference Perren, Hodgson, Roberts, Sime, van Nieuwenhuyze, Verleyen and Vyverman2020). Recent reconstructions of precipitation since the mid-nineteenth century (Favier et al. Reference Favier, Verfaillie, Berthier, Menegoz, Jomelli and Kay2016) also suggest that precipitation remained relatively stable before the recent increase in the SAM since the 1970s. Assuming that the SAM largely controls precipitation amounts on the Kerguelen Islands (as shown by Favier et al. Reference Favier, Verfaillie, Berthier, Menegoz, Jomelli and Kay2016, Pohl et al. unpublished data 2021), negative SAM phases during the early LIA glacial advance recorded on the Kerguelen Islands probably induced precipitation amounts similar to those measured in the 1950s and 1960s, as inferred from the glaciological modelling. Palaeo-climatic conditions of glacial advances during the early LIA on the archipelago were also slightly colder during this period (~-0.17°C) compared to conditions that prevailed in 1963 (corresponding to the reference period 1935–1962). This provides complementary information to the only existing palaeo-climatic reconstruction produced for this sector of the Southern Ocean (Perren et al. Reference Perren, Hodgson, Roberts, Sime, van Nieuwenhuyze, Verleyen and Vyverman2020). It provides new insights into the climatic conditions associated with the early LIA in a region where climate models generally perform poorly over the recent period (e.g. Favier et al. Reference Favier, Verfaillie, Berthier, Menegoz, Jomelli and Kay2016, Verfaillie et al. Reference Verfaillie, Favier, Gallée, Fettweis, Agosta and Jomelli2019). Similar to the findings of Reynhout et al. (Reference Reynhout, Sagredo, Kaplan, Aravena, Martini and Moreno2019) for Patagonia, our results suggest that climate and subsequent glacier evolution on the Kerguelen Islands over the last millennium were highly influenced by fluctuations in the SAM. The period between ca. 1400 and ca. 1600 ce corresponds to the period during which the SAM index was the most negative over the last millennium (Abram et al. Reference Abram, Mulvaney, Vimeux, Phipps, Turner and England2014, Perren et al. Reference Perren, Hodgson, Roberts, Sime, van Nieuwenhuyze, Verleyen and Vyverman2020). This also suggests that past CIC wastage and extents reflected this extreme state of the SAM, making the Kerguelen Islands one of the best laboratories to study this most important climate feature at high latitudes in the Southern Hemisphere (as the leading empirical orthogonal function of extratropical atmospheric mode of variability in the Southern Hemisphere).
Uncertainties in the glacio-climatic simulations
To the first order, the simulated 1963 and 2009 extents fit relatively well with the extents derived from the IGN topographic reconnaissance map and the SPOT image, respectively (Fig. 5). However, local discrepancies exist between the simulated extents and the observed ones in 1963 and 2009. In addition, the total extents from the glaciological model are ~9% too large in 1963 and ~19% too small in 2009. As the model was designed to represent permanent states of the CIC, it does not allow for reproducing the exact timing of a transient glacier front retreat. The reduced size of the modelled (permanent) extent relative to observations in 2009 reflects the fact that the CIC is actually in a transitional regime. Differences between model results and observations also may result from 1) the too coarse resolution of the glaciological model (125 m), 2) the extrapolation of meteorological data from PAF and 3) the simplicity of the glaciological model. Concerning the latter, we believe that the main uncertainty affecting the cellular automaton (dynamical part of the model) is related to the fact that the glacier model is applied on 2009's DEM and that the ice-cap thickness and thus the depth of the ice-cap bedrock remain unknown. We attempted some ground-penetrating radar measurements on Ampere Glacier in 2014 to obtain more information on the bedrock depth, but we were unsuccessful due to the high liquid content at the glacier surface and subsurface. In addition, we consider that, given the simplicity of the glacio-climatic model and the uncertainties in the parameters applied in the model, a resulting uncertainty in the order of 10–20% is acceptable. This study shows that the degree-day glaciological model combined with a cellular automaton is - although rather simple - a robust tool given the spatiotemporal scales considered.
Concerning the simulated early LIA extent, it must be taken into account that the only moraines that are thus far dated to the last millennium are the M1 and M2 moraines in the Ampere valley, making the constraint for the whole CIC rather limited. Several other CIC outlet glaciers have deposited moraines that could potentially correspond to the LIA, but they remain undated. The simulated early LIA extents should therefore be considered with caution.
Concerning future extents, uncertainties also arise from the model and the climatic scenarios used to drive the glaciological model. Although ACCESS1-3 is the model that best simulates precipitation amounts and temperature over the recent period (Verfaillie et al. Reference Verfaillie, Favier, Gallée, Fettweis, Agosta and Jomelli2019), it is still affected by biases that needed to be accounted for in this study (see the ‘Methods’ section). Even after this bias correction, we had to propose certain hypotheses concerning the future climate scenarios from ACCESS1-3. For instance, we considered that precipitation at the end of the century would moderately increase by 11% under the RCP4.5 scenario and by 23% under the RCP8.5 scenario (Table VI) due to increasing temperature (Clausius-Clapeyron processes are already taken into account in the ACCESS1-3 model). Considering alternative hypotheses regarding precipitation (i.e. a strong or very strong increase in precipitation by the end of the century) would still imply reductions of 83% and 51%, respectively, in CIC extent between 2009 and 2100. Moreover, modelled extents are simulated by taking the CIC extent and topography at a given snapshot in time as a reference (using the DEM from 1963 for the early LIA and 1963 extents and the DEM from 2009 for the 2009 and 2100 extents). The ice-cap elevation and extent are updated iteratively as the simulation runs, but the surface elevation never goes below the 2009 DEM elevation, whereas the glacier surface elevation will decrease as ice will disappear over time. This strong feedback on a negative surface mass balance is not taken into account in our glaciological projections, which adds another source of uncertainty to the simulated extents.
Future evolution of the CIC
We used the bias-corrected daily temperature and precipitation simulated for 2100 from a single model (ACCESS1-3) forced by the two available RCP scenarios (RCP4.5 and RCP8.5) to drive the glaciological model. Nevertheless, we showed above that the extent of the CIC is expected to be reduced strongly or to have disappeared completely by 2100 owing to the strong sensitivity of the CIC to climate fluctuations for various geomorphological, glaciological and climatological reasons. Firstly, the accumulation area of the CIC is located at low altitudes (currently between ~800 and 1049 m a.s.l.). This is because the oceanic climate and the location of the Kerguelen Islands on the storm tracks’ path supply sufficient moisture that results in significant snow accumulation on the ice cap. However, due to the recent dryness experienced at Kerguelen, linked to the SAM-induced shift of the storm tracks to more southerly latitudes, the accumulation area of the CIC should rapidly lose mass and disappear before the end of the century (Favier et al. Reference Favier, Verfaillie, Berthier, Menegoz, Jomelli and Kay2016). The SAM is the first-order variable that modulates daily regime occurrences and their seasonal frequencies throughout the year on the Kerguelen Islands (Pohl et al. unpublished data 2021). Its control on temperature and precipitation trends has also been demonstrated at the interannual timescale, with dramatic consequences on the glacier behaviour over the second half of the twentieth century (Verfaillie et al. Reference Verfaillie, Favier, Dumont, Jomelli, Gilbert and Brunstein2015, Favier et al. Reference Favier, Verfaillie, Berthier, Menegoz, Jomelli and Kay2016). The future of the CIC will thus be strongly tied to the potential changes in the SAM phase.
Secondly, the hypsometry of the CIC (dome-shaped and almost flat between ~600 m a.s.l. and its summit; see fig. 5c in Verfaillie et al. Reference Verfaillie, Favier, Dumont, Jomelli, Gilbert and Brunstein2015) plays an important role in the response of the net accumulation area to changes in temperature. Indeed, Verfaillie et al. (Reference Verfaillie, Favier, Dumont, Jomelli, Gilbert and Brunstein2015) showed that the ELA had risen by ~100 m between 2001 and 2012, implying a reduction of the accumulation area ratio of ~20% and a decrease of the accumulation area of ~90 km2 (as a comparison, the total area of CIC in 2020 is ~400 km2). These values are conservative, as they apply for the recent period, but they are expected to be even larger in the future. Indeed, as the CIC recedes, the ELA should reach higher altitudes where the surface is flatter, thereby uncovering larger areas. Based on the RCP8.5 scenario, our glaciological modelling foresees an ELA above the summit of the ice cap by 2100, which would imply the complete disappearance of the CIC by the end of the century.
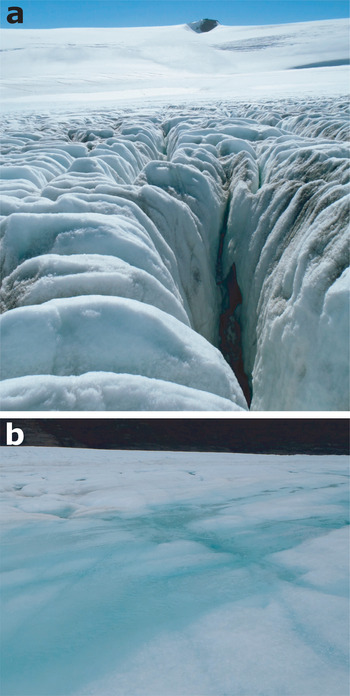
Thirdly, the increase in temperature will induce an increase in the altitude of the rain/snow transition, which will also have a detrimental impact on the accumulation area of the ice cap. Additionally, as is shown by Verfaillie et al. (Reference Verfaillie, Favier, Dumont, Jomelli, Gilbert and Brunstein2015), this will reduce the surface albedo, resulting in positive feedback on melt rates and snow line elevation (Fig. 6) mainly through the shortwave radiation budget of the CIC. Given the extent and ELA simulated for 2100 and the sensitivity of the CIC to climate fluctuations, as explained above, we expect the ice cap to have completely disappeared by the end of the century.
Photographs of the surface of Ampere Glacier in January 2012. a. Crevassed ablation area at the forefront (~550 m above sea level) and firn- and snow-covered accumulation area in the background (~650 m above sea level). b. Surface melt in the ablation area (~200 m above sea level).

Conclusions
To conclude, in this study, we have used glacio-climatic modelling and cosmogenic dating to assess the glacial evolution of the CIC in the sub-Antarctic Kerguelen Islands between recent centuries and the end of the twenty-first century. Glacial extents for four snapshots in time were reconstructed, namely the first part of the LIA (commonly defined over the period 1400–1870 ce), 1963, 2009 and 2100, and their associated climatic scenarios revealed.
Despite large uncertainties, 36Cl cosmogenic nuclide dating of morainic boulders from Ampere valley reveals two consecutive glacial advances that most probably occurred during the early LIA. The oldest advance, recorded by the outermost M1 moraine, was dated at 800 ± 260 years ago (1220 ± 260 ce), and a subsequent advance led to the formation of the M2 moraine, dated at 580 ± 310 years ago (1440 ± 310 ce). Geomorphological evidence of past glaciations is scarce on the sub-Antarctic islands, and this is the first time that moraines from this period have been dated in the Indian sector of the Southern Ocean, thereby contributing to our currently limited understanding of palaeoclimate for the early LIA in this region. It brings new insights into the climatic conditions (cold and humid compared to today) associated with the LIA in a region where climate models generally perform poorly over the recent period. For the recent period (between 1963 and 2009), glaciological modelling and observations show a rather strong decrease in the CIC extent, associated with an increase in the ELA. Similarly to studies in Patagonia, our results suggest that climate and subsequent glacier evolution on the Kerguelen Islands over the last millennium was highly influenced by fluctuations in the SAM, one of the most important climate features at high latitudes of the Southern Hemisphere. This also suggests that past CIC wastage and extents reflected the state of the SAM, making the Kerguelen Islands one of the best laboratories to study this prominent feature of the climate system.
Concerning uncertainties affecting the glaciological modelling, we have shown that local discrepancies exist between the simulated extents and the observed ones, mainly due to the unknown depth of the bedrock below the ice cap. For future extents, uncertainties also arise from the climate model used as an input of the glaciological model. We used bias-corrected fields of temperature and precipitation from the Australian ACCESS1-3 model, which is the model that, according to previous studies, performs the best over our region for the recent period. Despite a large variability in projected temperature in CMIP5 models, all of the models project a dramatic warming in the area, generally leading to a rise of the ELA above the summit of CIC. The behaviour of ACCESS1-3, being very close to that of the ‘mean model', represents the most probable projection for the RCP8.5 scenario. Because warming will rapidly become the main cause of CIC wastage, reducing emissions of greenhouse gases further would clearly limit the acceleration in the disappearance of the CIC. Nevertheless, for the RCP8.5 scenario, even with a strong increase in precipitation by 2100, the CIC extent would still be reduced by more than half compared to 2009, and the ELA will be confined to the last tens of metres from the summit. Considering these uncertainties and the strong sensitivity of the ice cap to climate fluctuations, we expect the CIC to have completely disappeared by the end of the century. Future studies should assess the timing of this disappearance in more detail, such as by quantifying the different contributors to the elevation feedback.
Acknowledgements
Our colleague and friend Didier L. Bourlès passed away recently. A specialist in cosmogenic dating, he developed ASTER. This article is dedicated to him. We thank Météo France for the meteorological data from Port-aux-Français. We acknowledge the World Climate Research Programme's Working Group on Coupled Modelling, which is responsible for CMIP, and we thank the Commonwealth Scientific and Industrial Research Organisation and Bureau of Meteorology for producing and making available the ACCESS1-3 model outputs. Finally, we thank two anonymous reviewers for their useful comments and suggestions.
Financial support
This work has received financial support from the LabEx DynamiTe (ANR-11-LABX-0046) Les Envahisseurs, as part of the ‘Investissements d'Avenir’ programme. This paper was also supported by the French INSU LEFE Glacepreker project and by the IPEV Kesaaco 1048 project. Logistical supply to the Kerguelen Islands was provided by the French Polar Institute. The 36Cl measurements were performed at the ASTER AMS national facility (CEREGE, Aix-en-Provence) that is supported by the INSU/CNRS, the ANR through the ‘Projets thématiques d'excellence’ programme for the ‘Equipements d'excellence’ ASTER-CEREGE action and IRD. EB acknowledges support from the French Space Agency (CNES).
Author contributions
VJ, VR, CL, VF and DV conducted the fieldwork on the islands. VF modelled the ice-cap extents. JCh and IS produced the cosmogenic data. GA, DLB and KK (ASTER Team) performed accelerator mass spectrometry measurements. JCh, IS and VJ interpreted the cosmogenic ages. ZS, JCa, EB and RC produced the cartographic data. JCh, DV and FB prepared the figures. DV, JCh, IS, ZS, VJ, FB, VF, JCa, EB and HG wrote the paper. All authors have approved the contents of the manuscript.
Details of data deposit
The 36Cl data will be found at an open-access repository on the informal cosmogenic-nuclide exposure-age database (ICE-D: Alpine; http://alpine.ice-d.org). Meteorological data from the weather stations used in this study can be found at the following repository: http://pp.ige-grenoble.fr/pageperso/faviervi/kesaaco/AWS.php.