

1. Introduction
Considering a mass of liquid with a translational invariance in one direction (which we will henceforth call a ‘liquid cylinder’, regardless of the shape of its transverse section), such a cylinder can have a totally free surface in the case of a jet; it can be bounded by the presence of a flat substrate in the case of a rivulet; and it can be laterally bounded in the case of open-channel flows.
Since the seminal works of Savart (Reference Savart1833), Plateau (Reference Plateau1849) and Rayleigh (Reference Rayleigh1878), jets have been known to be unstable because of the capillary forces that lead to the Plateau–Rayleigh instability, whereas the stability of a rivulet on a flat surface depends on the wetting condition at the substrate (Davis Reference Davis1980; Sekimoto, Oguma & Kawasaki Reference Sekimoto, Oguma and Kawasaki1987; Bostwick & Steen Reference Bostwick and Steen2018). In both cases, the two principal modes of propagating deformations are identified as varicose modes (that is, modulations of the cross-sectional area along its axis) and as sinuous modes (that is, displacements of the centre of mass of the section, in the transverse direction). Recently, Bostwick & Steen (Reference Bostwick and Steen2018) performed a comprehensive numerical study of the stability of inviscid sinuous and varicose modes along sessile circular cylinders, for pinned contact lines or free contact lines with constant contact angle. In particular, they identified the dominant modes for various contact line configurations.
In contrast, liquid cylinders placed upon a horizontal trough are supposedly stable, at least at centimetre scales, because gravity acts as a stabilising force, and waves at the surface of an open channel can propagate along the latter. This is actually one of the oldest problems studied in hydrodynamics – see Craik (Reference Craik2004, Reference Craik2005) for historical reviews – and the classic result of the gravity–capillary waves propagating along a rectangular channel is treated in any textbook (see e.g. Lamb Reference Lamb1932). Regarding the varicose waves, capillary- and gravity-dominated regimes can be distinguished depending on the channel depth. Other modes of wave propagation can be evidenced. They correspond to sloshing modes (Lamb Reference Lamb1932; Groves Reference Groves1994), observed as standing waves in the case of bounded tanks, even at very large scales and known in this context as ‘seiches’ (Forel Reference Forel1904).
At millimetre scales, the Plateau–Rayleigh instability comes into play along a liquid cylinder in a small trough. In particular, it depends on the contact line configuration at the substrate. In the context of a wedge-shaped groove, the problem of the stability of a circular cylinder was first treated by Langbein (Reference Langbein1990) and extended by Roy & Schwartz (Reference Roy and Schwartz1999), considering various substrate geometries and different wetting conditions. The stability of a rivulet on a wedge was studied by Yang & Homsy (Reference Yang and Homsy2007) in the flowing case and by Speth & Lauga (Reference Speth and Lauga2009) in the static case. In all the aforementioned cases, the effects of gravity were not taken into account and circular cylindrical base states were considered.
Russell (Reference Russell1844) reported for the first time the propagation of a hump of water, propagating at constant speed and constant shape. Korteweg & de Vries (Reference Korteweg and de Vries1895) derived the now so-called Korteweg–de Vries (KdV) equation, which governs the properties of this soliton (speed, amplitude and width) propagating along a rectangular channel. They predicted the existence of negative amplitude solitons whenever the depth of water  $H$ is below
 $\sqrt {3}\ell_{{c}}$, where
 $\ell_{c}=\sqrt{\sigma /(\rho g)}$ denotes the capillary length for a fluid of surface tension
 $\sigma$ and density
 $\rho$, that is, whenever the Bond number – defined as
 $\textit{Bo}=\sigma /(\rho g H^{2})$ in this article – is larger than
 $1/3$ the critical value of the Bond number in the case of a rectangular channel. The first experimental observation of such negative solitons was made by Falcon, Laroche & Fauve (Reference Falcon, Laroche and Fauve2002), at the surface of a thin layer of mercury.
In the context of Leidenfrost liquid cylinders levitating above their own vapour (see figure 1a), Perrard et al. (Reference Perrard, Deike, Duchêne and Pham2015) experimentally studied the linear and nonlinear waves propagating along this cylinder. They evidenced a reduced-gravity effect due to the shape of their experimental substrate, as well as an effective reduced surface tension, supposedly stemming from the non-trivial shape of the cylinder section. Different branches of the dispersion relation were evidenced. One branch was related to the varicose modes of the drop, whereas an upper branch was characterised by a cutoff frequency and corresponded to sloshing modes. In this context, the general dispersion relation of the varicose modes reads
 \begin{equation} \omega^{2} = \left(g_{{\textit{eff}}}\,k +\frac{\sigma_{{\textit{eff}}}}{\rho} k^{3}\right) \varPsi(W_{{\textit{eff}}}\,k). \end{equation}
Here,  $g_{{\textit{eff}}} = g\sin \alpha$;
 $W_{{\textit{eff}}} = c_{{\textit{eff}}}^{2}/g_{{\textit{eff}}}$, with
 $c_{{\textit{eff}}}$ being the phase velocity of long-wave varicose modes;
 $\sigma _{{\textit{eff}}}$ is an effective surface tension (fitted in experiments), lower than the expected surface tension of the liquid;
 $\alpha$ is the tilt angle; and
 $\varPsi$ is a function depending on the substrate shape and equivalent to the standard
 $\tanh$ function for a rectangular channel.
(a) Photograph of a water cylinder deposited upon a hot substrate. The temperature is higher than the boiling temperature. Owing to the Leidenfrost effect, this cylinder levitates above its own vapour. Depression KdV solitons can propagate along such a cylinder. (b) A cylinder of water can be deposited upon a superhydrophobic substrate (here a symmetrical V-shaped substrate). Beyond a critical volume, such a cylinder is stable and waves can propagate along it.

Negative amplitude solitons were observed along these Leidenfrost cylinders. Perrard et al. (Reference Perrard, Deike, Duchêne and Pham2015) characterised the existence of these depression solitary waves by means of an effective Bond number that they compared to a critical Bond number related to the substrate section shape. By adding nonlinear corrections to the dispersive wave equation, they proposed a KdV equation with ad hoc coefficients of the form
 \begin{equation} \eta_t + c_{{\textit{eff}}} \left[\eta_x + \frac{\nu_1}{W_{{\textit{eff}}}}\eta\eta_x + \frac 12 W_{{\textit{eff}}}^{2} (\textit{Bo}_{{\textit{c}}} -\textit{Bo}_{{\textit{eff}}})\eta_{xxx}\right] = 0. \end{equation}
The coefficient  $\nu _1$ depended on the substrate geometry, and the critical Bond number
 $\textit{Bo}_{{\textit{c}}}$ and the effective Bond number
 $\textit{Bo}_{{\textit{eff}}}$ were respectively equal to
 $|\varPsi '''(0)|/6$ and
 $\sigma _{{\textit{eff}}}/(\rho g_{{\textit{eff}}}W_{{\textit{eff}}}^{2})$. No details of the theoretical derivation of this KdV equation were given within that article.
Recently, Pham, Perrard & Le Doudic (Reference Pham, Perrard and Le Doudic2020) studied a system that bridges open-channel flows and the free cylinder encountered in the Leidenfrost experiments, provided the curved substrate is replaced by a superhydrophobic non-heated wedge-shaped substrate. They calculated the exact shape of the capillary cap and showed that cylinders can be stable against the Plateau–Rayleigh instability as long as the liquid is deposited upon a non-flat substrate and its section is sufficiently large (see figure 1b as an illustration). They interpreted this instability in terms of the square of the effective celerity of the varicose waves in the non-dispersive regime,  $c_{{\textit{eff}}}^{2}$. It is positive for large volumes of liquid, and it becomes negative for small volumes of liquid.
This article is the follow-up to Part 1 (Pham et al. Reference Pham, Perrard and Le Doudic2020). We present a thorough study of the dispersive regime of the waves propagating along sessile cylinders of water, deposited upon superhydrophobic wedge-shaped substrates.
We start with the presentation of our experimental set-up along with the experimental results in § 2. Cylinders of liquids are deposited upon superhydrophobic substrates (either a symmetrical V-shaped channel, or an L-shaped channel, such that its geometry can be finely tuned). These cylinders are excited and the spectra of the deformations of the interface are analysed. We evidence the existence of varicose, sinuous and sloshing waves. Fitting of the varicose branch of excitations with (1.1) is carried out.
In § 3, we numerically study the varicose and the sloshing waves, without taking the surface tension into account, by studying the inviscid equations governing the motion of the fluid in such channels. To do so, we solve the equations governing the velocity potential, in the form of a generalised eigenvalue problem that we solve through a code based on the finite element method. This leads to the dispersion relations of the different wave modes. More specifically, we characterise the varicose waves in terms of a shape function  $\varPsi$, equivalent to the standard
 $\tanh$ function of the classic capillary–gravity waves, and relate this function
 $\varPsi$ to the substrate geometry. We compute the sloshing branches above the varicose branch and compare them with the experimental results by analysing their characteristic cutoff frequencies at zero wavenumber.
We introduce the dispersive correction due to the surface tension effects. An estimation of the renormalised surface tension is proposed in § 4, based on a toy model. It is developed and discussed in detail in Appendix B. Because the varicose perturbations of the base state induce a non-uniform distribution of the curvature along the section border of the cylinder, there is an effective averaging of the surface tension, which leads to an effective surface tension lower than the expected standard value. In § 5, based on a nonlinear acoustics analogy, we add nonlinear corrections to the wave equation obtained through the dispersion relation (1.1) and derive the ad hoc KdV equation (1.2) governing our system, taking into account the shape of the channel. Experiments are performed in order to check the validity of this equation. In a similar way to the Leidenfrost case of Perrard et al. (Reference Perrard, Deike, Duchêne and Pham2015), negative amplitude solitons can propagate along our cylinder. We characterise them by measuring their amplitude and their propagation speed, which is subsonic, namely lower than  $c_{{\textit{eff}}}$.
Last, we show in § 5.4 how our method can be generalised and how it can describe the propagation of depression pulses in Plateau borders, observed in experiments by Argentina et al. (Reference Argentina, Cohen, Bouret, Fraysse and Raufaste2015); and we draw our conclusions in § 6.
2. Experimental set-up and results
In this section, we present an experimental characterisation of the waves propagating along cylindrical drops (namely, with translational invariance along one direction), when deposited upon superhydrophobic substrates. We will study the dispersive regime, while Pham et al. (Reference Pham, Perrard and Le Doudic2020) only focused on the non-dispersive regime.
2.1. Experimental set-up
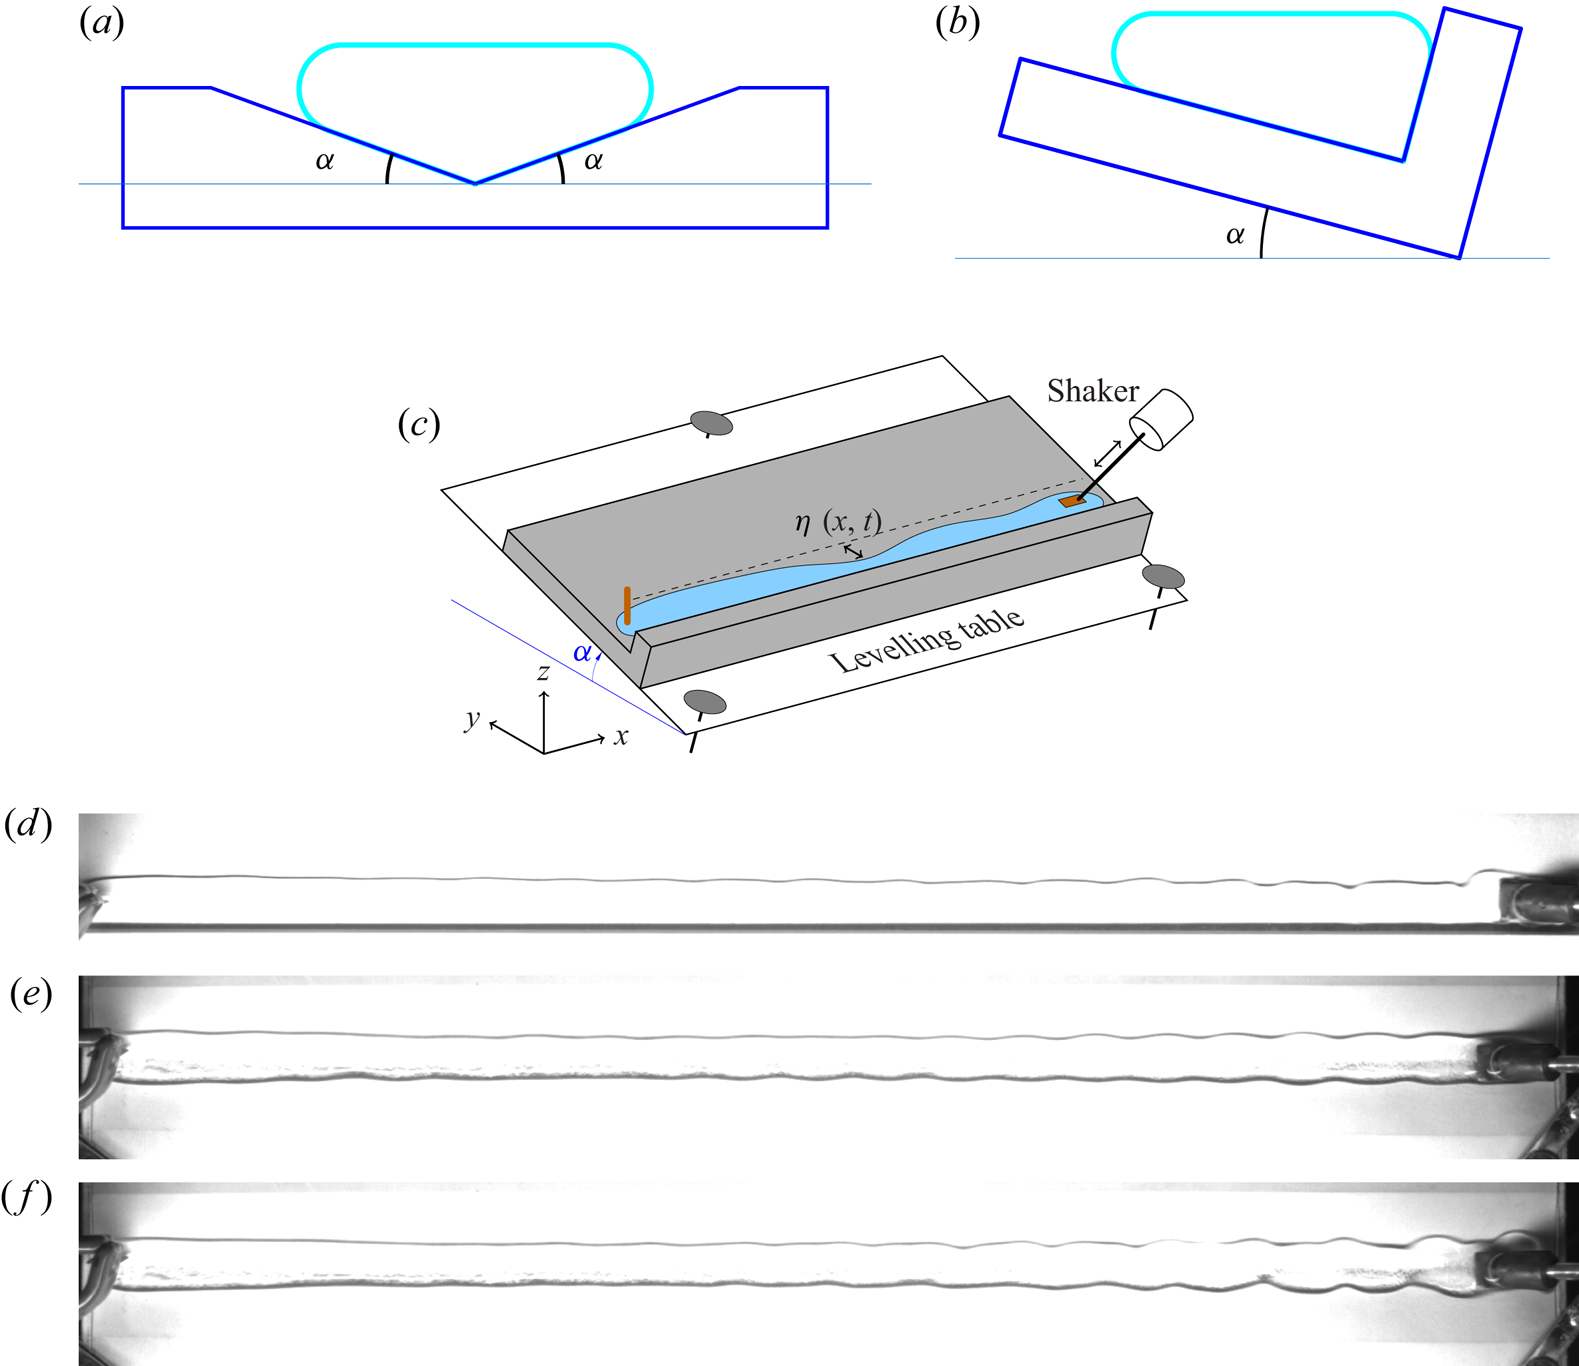
We use the same two different substrates as in Pham et al. (Reference Pham, Perrard and Le Doudic2020). The first one is a symmetrical V-shaped Dural channel with an angle  $\alpha =10^{\circ }$. The second one is an L-shaped Dural channel, placed upon a levelling table, so that it can be tilted by an angle
 $\alpha$, set from
 $0^{\circ }$ up to
 $45^{\circ }$ (see the schematics in figure 2a–c). The surface of these substrates is treated using Rust-Oleum NeverWet, so that the wetting conditions can be considered as superhydrophobic (contact angle around
 $160^{\circ }$; see Gupta, Vaikuntanathan & Siakumar Reference Gupta, Vaikuntanathan and Siakumar2016). Both channels are 50 cm long. On either of them, a controlled volume of distilled water is deposited and stretched from one end to the other end of the channel. If the deposited volume is sufficiently large, such long drops can be pinned at both ends of the channel without breaking up (see Pham et al. Reference Pham, Perrard and Le Doudic2020).
Geometry of the two different substrate shapes used in our experiments. (a) Cross-section of the V-shaped substrate ( $\alpha = 10^{\circ }$). (b) Cross-section of the L-shaped substrate. (c) Schematic of the experimental set-up. Movies are recorded from above. (d–f) Top views of experiments of shaken drops of volume 40 ml. (d) On the non-symmetrical L-shaped substrate tilted by an angle
 $\alpha =10^{\circ }$. (e) On the symmetrical V-shaped substrate. Varicose modes, i.e. constriction modes, are observed. They are symmetrical in the V-shaped case. In contrast, on the L-shaped substrate, due to the asymmetry, only the constrictions of the interface border located at the gentle sloping side (upper side of the image) are clearly visible. ( f) On the V-shaped symmetrical substrate. The generation of sinuous modes when excited close to their cutoff frequency can be seen.

In order to study the propagation of waves along these drops, we force one end of the drop using a shaker at slowly increasing frequencies from 1 to 20 Hz. Three snapshots are shown as an illustration in figure 2(d–f). The plate connected to the shaker can be seen at the right-hand side of the photographs. The photographs correspond to excited drops of volume equal to 40 ml, deposited on the symmetric V-shaped substrate and the non-symmetrical L-shaped substrate with a tilt angle  $\alpha =10^{\circ }$. In the symmetrical case, constriction modes are clearly visible near the shaker; whereas, in the non-symmetrical case, only the deformations of one side of the drop can be captured, as the deformations of the border of the drop at the steepest side of the substrate are too small to be visible. We then naturally focus on the interface located on the smallest slope of the substrate.
The deformation of the interface border is recorded from above using a digital camera (AVT Manta G223) at 50 frames per second. The position of the interface border,  $\eta (x,t)$, is numerically reconstructed using an algorithm of contour detection based on the change in the colour gradient, with a 0.03 mm accuracy.
From the camera recordings, we compute the spatio-temporal spectrum  $S^{\eta }(k,\omega )$ of the perturbed interface by performing fast Fourier transforms (FFTs) on the difference
 $\eta(x,t)-\eta_0(x)$, where
 $\eta_0(x)$ is the shape of the border at rest. The typical spatial resolution is of the order of
 $0.25$ mm per pixel, and we use a typical image resolution equal to 1700 pixels.
2.2. Experimental results
Several branches can be observed from the obtained spatio-temporal spectra (see figures 3 and 4). We will focus first on the lowest branch, which goes to zero when  $k\to 0$ (namely, the varicose branch), then on the other branches (characterised by a low-frequency cutoff at
 $k=0$), which are related to other modes of wave propagation. The very first upper branch is related to sinuous modes (in the V-shaped case), while the other ones correspond to sloshing modes.
(a–c) Spatio-temporal spectra  $S^{\eta }(k,\omega )$ of the deformation of the border of elongated drops, on a superhydrophobic symmetric V-shaped substrate for three different volumes
 $V$: (a)
 $V = 120\ {\rm ml}$, (b)
 $V = 80$ ml and (c)
 $V = 35$ ml, at fixed angle
 $\alpha =10^{\circ }$. The larger the volume, the larger the slope at the origin, that is, the speed of sound. We have superimposed the analytical non-dispersive relation
 $\omega =c_{{\textit{eff}}}\,k$ (dashed white, with respective values of
 $c_{{\textit{eff}}}$: (a)
 $15.9$ cm s
 $^{-1}$, (b)
 $13.8$ cm s
 $^{-1}$ and (c)
 $9.9$ cm s
 $^{-1}$) along with the dispersion relation (1.1) with the
 $\tanh$ function as an ansatz of
 $\varPsi$ (solid cyan). The agreements are very good. At large volumes (greater than 80 ml), the dispersion relation is not convex; this is the gravity-dominated regime. For smaller volumes (which will correspond to regimes of Bond numbers larger than a critical value), the dispersion relation is purely convex; this is the capillary-dominated regime. The other branches are characterised by a cutoff frequency. They correspond to other modes of propagation (sinuous and sloshing modes). In panel (c) at a volume of water equal to 35 ml, we can clearly distinguish two branches with cutoff frequencies
 $f_{\textit{sinuous}}\simeq 2.6$ Hz and
 $f_{\textit{slosh}}\simeq 10$ Hz. (d) Spectrum
 $S^{W}(k,\omega )$ of
 $W(x,t)$, the width of the same drop, at
 $V=35$ ml (see text for its definition), plotted in log–log scale. The sinuous branch with cutoff frequency
 $f_{\textit{sinuous}}\simeq 2.6$ Hz vanishes; only the varicose mode branch, as well as the upper sloshing branch, remain. For
 $k\to 0$,
 $\omega (k)$ scales like
 $k$ (non-dispersive regime), while for
 $k\to \infty$,
 $\omega (k)$ scales like
 $k^{3/2}$.

Spatio-temporal spectra of elongated drops, on a superhydrophobic asymmetrical L-shaped substrate for volume equal to 35 ml and four different angles: (a)  $\alpha =10^{\circ }$, (b)
 $\alpha =20^{\circ }$, (c)
 $\alpha =30^{\circ }$ and (d)
 $\alpha =40^{\circ }$. We have superimposed the analytical non-dispersive relation
 $\omega =c_{{\textit{eff}}}\,k$ together with the dispersion relation (1.1) with the
 $\tanh$ function as an ansatz of
 $\varPsi$. The larger the angle, the larger the slope, i.e. the greater the propagation speed of long-wavelength varicose modes. We have (a)
 $c_{{\textit{eff}}} = 12.8$ cm s
 $^{-1}$, (b)
 $16.2$ cm s
 $^{-1}$, (c)
 $17.9$ cm s
 $^{-1}$ and (d)
 $18.7$ cm s
 $^{-1}$. In this low-volume regime, the varicose branches are convex. No sinuous branch is visible.

We have analytically characterised the long-wave regime ( $k\to 0$ limit) of the varicose modes in Pham et al. (Reference Pham, Perrard and Le Doudic2020), with a very good agreement with the experiments. From the value of the deposited volume
 $V_0$ and the substrate geometry (given by the angle
 $\alpha$), we were able to deduce the value of the geometric parameter
 $m$ that sets the section of the drop at rest. Then we deduced the slope at zero of the varicose branch, corresponding to the phase velocity
 $c_{{\textit{eff}}}$ of the varicose modes. Note that this wedge-shaped geometry corresponds to the ansatz used in Perrard et al. (Reference Perrard, Deike, Duchêne and Pham2015). In this latter work, the authors found a corrective 0.8 factor, because of the curvature of the substrate bottom, which made the actual cross-sectional area lower than that of the ansatz.
We can then deduce the parameter  $W_{{\textit{eff}}}=c_{{\textit{eff}}}^{2}/g_{{\textit{eff}}}$ in the dispersion relation (1.1), and we have superimposed the latter onto the spectra using
 $\varPsi \equiv \tanh$. This functional ansatz will be justified in § 3. Moreover, in order to take into account the short-wave dispersive regime where
 $\omega ^{2}\sim (\sigma _{{\textit{eff}}}/\rho ) k^{3}$, we have fitted the experimental varicose curve using a fitted value of
 $\sigma _{{\textit{eff}}}$, typically about
 $57$ mN m
 $^{-1}$. As already observed in the case of levitating Leidenfrost cylinders (see Perrard et al. Reference Perrard, Deike, Duchêne and Pham2015), this value is below its expected value (
 $72$ mN m
 $^{-1}$ in the superhydrophobic case). This property is due to the non-uniform distribution of curvature of the interface along its section border. This point is thoroughly discussed in § 4 and Appendices A and B. The agreement is very good for both the V-shaped and the L-shaped cases. Note that, in the V-shaped case, the curve loses its convexity, as expected, when the Bond number is below the critical Bond number. This transition between a capillary- and a gravity-dominated regime occurs at a critical volume
 $V_{{\textit{c}}}\simeq 80$ ml (see discussion in § 4).
Several upper branches  $\omega =\omega (k)$, those that do not go to zero at
 $k\to 0$, are clearly visible in the spectra. In order to characterise the first upper branch, we consider the spectra of the interface border in the V-shaped case. The geometry allows us to capture both the upper
 $\eta ^{\textit{up}}(x,t)$ and the lower
 $\eta ^{\textit{lo}}(x,t)$ borders of the interface. The spectrum of
 $\eta ^{\textit{up}}(x,t)$ is shown in figure 3(c) for a volume
 $V=35$ ml, whereas we have plotted the spectrum of the difference
 $W(x,t)=\eta ^{\textit{up}}(x,t)-\eta ^{\textit{lo}}(x,t)$, which corresponds to the spectrum of the drop width (figure 3d). The last is plotted in log–log scale in order to evidence the long-wave regime (for
 $k\to 0$, where
 $\omega (k)$ scales like
 $k$) along with the short-wave regime (for
 $k\to \infty$, where
 $\omega (k)$ scales like
 $k^{3/2}$). The first upper branch has vanished. It corresponds to a motion of the drop of constant section, namely to sinuous modes.
The other upper branches are related to sloshing modes because of the presence of the substrate. The cutoff frequencies of the sinuous and the sloshing modes decrease for increasing values of the deposited volume of liquid. Comparisons with numerical simulations are made in § 3 in the V-shaped case.
In the case of the L-shaped substrate, by inspection of figure 4(a–d), one can tell that, at a fixed volume  $V=35$ ml, the cutoff frequencies increase as the angle
 $\alpha$ increases. A quantitative measurement of these cutoff frequencies along with a comparison with numerical simulations will be discussed in § 3. No sinuous branch is visible.
3. Numerical dispersion relations without surface tension
We will start with a brief presentation of classic results on gravity waves. We will then address the question of gravity waves propagating along general wedge-shaped channels and then, more specifically, along the channels used in our experiments.
3.1. Governing equations and classic results
In this section, we present the equations that govern the propagation of surface waves in the  $x$-direction, along a channel of given cross-section of water at rest
 $S_0$, without taking surface tension into account. The flat free interface is denoted
 $\varGamma _0$ and the solid bottom of the substrate is denoted
 $\varGamma _1$ (see figure 5a). Let us consider an irrotational, incompressible, inviscid flow. We set
 $\varPhi (x,y,z)$ as the velocity potential and separate it into
 $\varPhi (x,y,z,t) = \phi (y,z)\,{\rm e}^{{\rm i}(kx - \omega t)}$. Then the problem to solve is this: Find a non-zero function
 $\phi (y,z)$ such that there exists
 $\omega$ that satisfies (see Lamb Reference Lamb1932)
 \begin{gather} (\varDelta-k^{2}) \phi = 0, \quad \forall (y,z) \in S_0, \end{gather}
 \begin{gather}\frac{\partial \phi}{\partial n} = 0, \quad \forall (y,z)\in \varGamma_1, \end{gather}
 \begin{gather}\frac{\partial \phi}{\partial y } = \frac{\omega^{2}}{g} \phi, \quad \forall (y,z)\in \varGamma_0. \end{gather}
This corresponds to a generalised eigenvalue problem. As stated in McIver & McIver (Reference McIver and McIver1993) and Groves (Reference Groves1994), very few analytical solutions of the problem (3.1)–(3.3) can be exhibited. We will present the two standard following ones.
(a) General notation of the numerical problem. Here  $W$ denotes the width of the horizontal free interface
 $\varGamma _0$;
 $S_0$ denotes the cross-sectional area of the cylinder at rest;
 $\varGamma _1$ denotes the solid boundary of the channel; and
 $H$ denotes the maximum depth of the liquid. (b) Rectangular geometry. (c) Symmetrical square triangle geometry.

3.1.1. Rectangular channel
In the case of a rectangular channel of depth  $H$ and width
 $W$ (see figure 5b), we have a discrete set of dispersion relations, indexed by an integer
 $N$:
 \begin{equation} \omega^{2}(k)=g\mu_N(k)\tanh[\mu_N(k)H], \end{equation}
with
 \begin{equation} \mu_N(k) = \sqrt{\frac{N^{2} {\rm \pi}^{2}}{W^{2}} + k^{2}}. \end{equation}
The case  $N=0$ yields the classic dispersion relation
 \begin{equation} \omega^{2}(k)=gk \tanh kH. \end{equation}
In the limit  $kH\to 0$, we have
 $\omega ^{2}=c_0^{2} k^{2}$ with
 $c_0^{2}=gH$.
For positive integers  $N$, the other branches possess a cutoff frequency
 $\omega _{{\textit{cut}}}(N)$ that reads
 \begin{equation} \omega_{{\textit{cut}}}^{2}(N) = g\left[\frac{N{\rm \pi}}{W} \tanh \left(H \frac{N{\rm \pi}}{W}\right)\right]. \end{equation}
For  $N=1$ and a depth
 $H$ much smaller than the width
 $W$, the first cutoff frequency then reads
 \begin{equation} \omega_{{\textit{cut}}}(N=1) \underset{H/W\ll 1}{=} \frac{{\rm \pi} \sqrt{gH}}{W}. \end{equation}
3.1.2. Square symmetrical wedge-shaped channel
In the case of a square symmetrical wedge-shaped channel (see figure 5c), exact solutions can be exhibited as well (Lamb Reference Lamb1932; Wehausen & Laitone Reference Wehausen and Laitone1960, p. 551; Groves Reference Groves1994). The first two branches (varicose and first sloshing modes), respectively, satisfy the following dispersion relations:
 \begin{gather} \omega^{2}=\frac{g}{\sqrt 2} k \tanh \frac{kH}{\sqrt 2}, \end{gather}
 \begin{gather}\omega^{2}=\frac{g}{\sqrt 2} k \operatorname{cotanh} \frac{kH}{\sqrt 2}. \end{gather}
Rewriting (3.9) as  $\omega ^{2}=g_{{\textit{eff}}}\,k \tanh (W_{{\textit{eff}}}\,k)$ yields
 $g_{{\textit{eff}}}=g\sin \alpha$ with
 $\alpha = {\rm \pi}/4$. Note that, in the long-wavelength limit, we recover the non-dispersive varicose regime
 \begin{equation} \omega^{2}\underset{k\to 0}{=}\frac{gH}{2} k^{2}. \end{equation}
Note that (3.11) is valid for any wedge-shaped channel, regardless of the wedge slopes.
The cutoff frequency of the first branch is
 \begin{equation} \omega_{{\textit{cut}}}(N=1) = \sqrt{\frac{g}{H}}, \end{equation}
and, in order to obtain the upper branches of the dispersion relations, one has to resort to numerical calculations (Groves Reference Groves1994).
3.2. Numerical results
We now turn to the general case of an arbitrary triangular channel section, with angles  $\alpha$ and
 $\beta \geq \alpha$ (see figure 6a). In such a geometry, the substrate is unequivocally characterised by its height
 $H$ and its angles
 $\alpha$ and
 $\beta$. We recall that the relationships between the height
 $H$, the width
 $W$ and the cross-sectional area
 $S$ are given by
 \begin{gather} W = \frac{\sin(\alpha+\beta)}{\sin\alpha \sin\beta} H, \end{gather}
 \begin{gather}S = \frac 12 W H = \frac 12 \frac{\sin(\alpha+\beta)}{\sin\alpha \sin\beta} H^{2}=\frac 12 \frac{\sin\alpha \sin\beta}{\sin(\alpha+\beta)}W^{2}, \end{gather}
which yields for our substrates  $W = (\cot \alpha )H$ in the V-shaped case and
 $W = H/{\sin 2\alpha }$ in the L-shaped case. The eigenvalue problem (3.1)–(3.3) depends on six independent quantities:
 $\alpha ,\ \beta ,\ g,\ \omega ,\ H$ and
 $k$. The Buckingham
 ${\rm \pi}$ theorem implies that our system is governed by four independent dimensionless numbers
 $\alpha ,\ \beta ,\ \varOmega = \omega \sqrt {H/g}$ and
 $K=kH$. Hence,
 $H$ sets our length scale and
 $\sqrt {H/g}$ our time scale.
(a) Schematic of the geometry: example of a two-dimensional mesh used in numerical simulation (low spatial resolution, here 239 elements). (b,c) Two spectra: (b) V-shaped case and (c) L-shaped case, for an angle  $\alpha = 10^{\circ }$. Note that, in the L-shaped case, branches do not converge asymptotically in pairs as in the V-shaped case. (d) Comparison between the classic
 $\tanh$ function (dashed line) and the actual shape function
 $\varPsi _{\alpha ,\beta }$ for the V-shaped and the L-shaped cases (solid lines). The two shape functions are almost identical, whereas they differ from the
 $\tanh$ function at intermediate values of
 $\xi$.

In order to obtain the dispersion relation of the problem, we resort to numerical computations. To that end, we have discretised the domain into a two-dimensional triangular mesh using the MATLAB/Octave mesh2d mesh generator (Engwirda Reference Engwirda2014). A Lagrange  $\mathbb {P}_1$ finite element method is used to solve the problem (3.1)–(3.3), which consists in a generalised eigenvalue problem. The numerical computations yield different branches
 $\varOmega (K)$. A typical number of 2000–4000 elements is used in order to ensure numerical convergence, depending on the angles
 $\alpha$ and
 $\beta$.
The first branch, the one that goes to zero as  $k\to 0$, corresponds to the varicose modes. Their dispersion relation reads in physical units
 \begin{equation} \omega^{2}(k)=(g\sin\alpha) k \varPsi_{\alpha,\beta}\left(\frac{kH}{2\sin\alpha}\right) =(g_{{\textit{eff}}}\,k) \varPsi_{\alpha,\beta}(W_{{\textit{eff}}}\,k),\end{equation}
with the function  $\varPsi _{\alpha ,\beta }$, for given angles
 $\alpha$ and
 $\beta$, having the following properties:
 \begin{gather} \varPsi_{\alpha,\beta}(\xi)\underset{\xi\to 0}{\sim} \xi, \end{gather}
 \begin{gather}\lim_{\xi\to+\infty} \varPsi_{\alpha,\beta}(\xi) = 1, \end{gather}
with  $W_{{\textit{eff}}}=H/(2\sin \alpha )$ being the effective width. The boundary conditions (3.16) and (3.17) of the function
 $\varPsi _{\alpha ,\beta }$ are chosen so that they are the same as those of the
 $\tanh$ function in the classic cases, as mentioned in § 3.1 (rectangular and square symmetrical triangle), thus allowing direct comparisons. Note that the prefactor
 $g_{{\textit{eff}}}\,k$ does not depend on
 $\beta$; it only depends on the smallest angle
 $\alpha$.
We can deduce the function  $\varPsi _{\alpha ,\beta }(\xi )$ by considering the numerical ratio
 \begin{equation} \varOmega^{2}/[(\sin\alpha)K]=\varPsi_{\alpha,\beta}[K/(2\sin\alpha)]. \end{equation}
This result is depicted in figure 6(d).
From the numerical computations, we obtain the upper branches as well. They are characterised by a cutoff frequency  $\omega _{\textit{cut}}(N)$. For different angles
 $\alpha$ and
 $\beta$, the first three cutoff frequencies are computed and shown in figure 7(a,b). At fixed angle
 $\alpha$, the cutoff frequency is an increasing function of the angle
 $\beta$.
For a fixed angle  $\alpha$ and for different angles
 $\beta$ (normally
 $2{\rm \pi} -\alpha >\beta \geq \alpha$, but we will even consider the case
 $\beta \leq \alpha$) dimensionless values of
 $\varOmega _{{\textit{cut}}}(N)={\omega _{{\textit{cut}}}(N)}\sqrt {H/g}$, for
 $N= 1,\ 2$ and
 $3$, and (a)
 $\alpha = 15^{\circ }$ and (b)
 $\alpha = 45^{\circ }$.

More specifically, we have performed the same calculations in the particular cases of V-shaped and L-shaped substrates in order to relate them to our experiments (see figure 8). At fixed depth, for both the V-shaped and L-shaped substrates, the cutoff frequencies  $\omega _{\textit{cut}}(N)$ are increasing functions of the angle
 $\alpha$. In the limit
 $\alpha \to 0$, the cutoff frequencies decrease linearly towards zero: the less steep the channel, the slower the sloshing motion.
(a) V-shaped substrate: numerical calculations of the first three dimensionless cutoff frequencies  $\varOmega _{{\textit{cut}}}(N) = {\omega _{{\textit{cut}}}(N)} \sqrt {H/g}$ for a given angle
 $\alpha$. (b) L-shaped substrate: numerical calculations of
 $\varOmega _{{\textit{cut}}}(N)$ (solid circles), together with a comparison with the experimental measurements of
 $\omega _{{\textit{cut}}}^{\textit{expe}}(1)$ using different values of
 $H_{{\textit{eff}}}$ (open squares, see text); in grey, we use
 $H_{{\textit{eff}}}=2c_{{\textit{eff}}}^{2}/g$, while in red, we use a smaller
 $H_{{\textit{eff}}}=c_{{\textit{eff}}}^{2}/g$, which yields better agreement.

3.3. Comparison with the experiments
In this section, we compare the cutoff frequencies found in the experimental spectra and the numerical results.
In the case of the V-shaped substrate, the cutoff frequency scales as  $\sqrt {g/H}$. The larger the volume, the larger
 $H$, and therefore the lower the cutoff frequency. For larger volumes of liquid, the measurements of the cutoff frequencies become less accurate. Nevertheless, the larger the volume, the more branches can be distinguished. For instance, four sloshing branches are visible at volume 80 ml in figure 3(a). The value of their cutoff frequencies can be extrapolated at
 $k=0$:
 $f_1^{\textit{expe}}\simeq 5.5$ Hz,
 $f_2^{\textit{expe}}\simeq 9.5$ Hz,
 $f_3^{\textit{expe}}\simeq 13.3$ Hz and
 $f_4^{\textit{expe}}\simeq 17.2$ Hz. Their ratios
 $f_2^{\textit{expe}}/f_1^{\textit{expe}}\simeq 1.73$,
 $f_3^{\textit{expe}}/f_2^{\textit{expe}}\simeq 1.4$ and
 $f_4^{\textit{expe}}/f_3^{\textit{expe}}\simeq 1.29$ are in good agreement with the numerical calculations, which yield the following ratios:
 $f_2^{\textit{num}}/f_1^{\textit{num}}\simeq 1.59$,
 $f_3^{\textit{num}}/f_2^{\textit{num}} \simeq 1.43$ and
 $f_4^{\textit{num}}/f_3^{\textit{num}}\simeq 1.26$ (see figure 8a, where the first three frequencies are displayed).
In the case of the L-shaped substrate, we have performed a series of experiments at fixed volume  $V=35$ ml with an angle
 $\alpha$ varying from
 $5^{\circ }$ to
 $45^{\circ }$, by
 $5^{\circ }$ steps. First we must state that, because of the L-shaped geometry, in particular in the low-angle regime, sinuous modes are penalised, for the steepest side of the substrate prevents the border of the interface from moving laterally and keeping its width constant. We have measured the cutoff frequency of the first visible upper branch
 $\omega ^{\textit{expe}}_{{\textit{cut}}}(1)$.
From the experimental data, the dimensionless quantity  $\omega _{{\textit{cut}}}^{\textit{expe}}(1)\sqrt {H_{{\textit{eff}}}/g}$, where
 $H_{{\textit{eff}}}$ is a length, can be computed and compared to the numerical calculations of
 $\varOmega _{{\textit{cut}}}(N)$. It is known that, for any triangle of height
 $H$, we have exactly
 $c_{{\textit{eff}}}^{2}=gH/2$ (see (3.10) in Pham et al. Reference Pham, Perrard and Le Doudic2020). From the value of
 $c_{{\textit{eff}}}^{2}$ of our drop, if we consider
 $H_{{\textit{eff}}}=2 c_{{\textit{eff}}}^{2}/g$, we do not find any agreement between the numerical and the experimental results; the relative error is 40 %. If
 $H_{{\textit{eff}}}= c_{{\textit{eff}}}^{2}/g$ is chosen instead, the agreement becomes good and the data seem to correspond to the first sloshing branch (see figure 8b). The larger the angle, the larger the cutoff frequency. Determining the exact value of
 $H_{{\textit{eff}}}$ remains an open question. It can most likely be attributed to the presence of the capillary cap on top of the wedge-shaped volume of water, which has an effect on the experimental value of
 $\omega ^{\textit{expe}}_{{\textit{cut}}}(1)$, while the sequence of the cutoff frequency ratios may still be described by a sole wedge-shaped cross-section.
4. First dispersive contributions to the varicose modes
In § 3, we have numerically calculated the shape function  $\varPsi _{\alpha ,\beta }$, which is not a linear function; its linear behaviour is only true at vanishing wavenumbers. Therefore, dispersion is present in the dispersion relation of the varicose waves even without taking into account the surface tension effects. We will quantify the first dispersive corrections due to the nonlinear behaviour of
 $\varPsi _{\alpha ,\beta }$ in § 4.1.
Another source of dispersion is due to surface tension. As long as the interface remains horizontal in the  $(y,z)$-plane, in the case of a rectangular channel, it is straightforward to make the substitution
 $g\mapsto g+(\sigma /\rho ) k^{2}$ in the dispersion relation of the varicose modes. This substitution yields the classic dispersion relation
 \begin{equation} \omega^{2}= \left(gk+\frac\sigma\rho k^{3}\right)\tanh kH. \end{equation}
When the interface in the transverse plane turns out to be curved, the substitution does not hold any longer. In § 4.2 we present a toy model in order to explain and estimate the renormalisation effect on the surface tension observed in our experimental spectra, as well as in the work of Perrard et al. (Reference Perrard, Deike, Duchêne and Pham2015). As a consequence, in § 4.3, we will estimate the effective Bond number of our system as well as the value of the critical Bond number at which the transition between a capillary- and a gravity-dominated regime occurs.
4.1. Dispersive effects due to the shape function  $\varPsi _{\alpha ,\beta }$

From the numerical calculations presented in § 3, we have evidenced the dispersion relation of the varicose modes propagating along a wedge-shaped channel of angles  $\alpha$ and
 $\beta$. It is given by (3.15) and, because the shape function
 $\varPsi _{\alpha ,\beta }$ is not a linear function, dispersive effects are intrinsically present. A Taylor expansion of the shape function
 $\varPsi _{\alpha ,\beta }(\xi )$ at order three in
 $\xi$ yields the first dispersive correction of the dispersion relation at small wavenumbers
 $~k$, which reads
 \begin{equation} \omega^{2} \underset{k\to 0}= g_{{\textit{eff}}}\,k ( W_{{\textit{eff}}}\,k + \tfrac 1 6 \varPsi_{\alpha,\beta}'''(0) W_{{\textit{eff}}}^{3}\kern0.06em k^{3} )+ \mathscr{O}(k^{6}). \end{equation}
This correction is given by  $\varPsi _{\alpha ,\beta }'''(0)$. From the numerical calculations, its value can be numerically deduced, insofar as
 $\varPsi _{\alpha ,\beta }(\xi )\sim \xi$ and
 $\varPsi _{\alpha ,\beta }$ is an odd function, using the limit
 \begin{equation} \frac{6}{\xi^{2}}\left(\frac{\varPsi_{\alpha,\beta}(\xi)}{\xi}-1\right)\underset{\xi\to 0}{\longrightarrow}\varPsi_{\alpha,\beta}'''(0). \end{equation}
The results are depicted in figure 9(a,b). The dependence in  $\alpha$ and
 $\beta$ is non-trivial. One can note that, for a fixed value of
 $\alpha$,
 $\varPsi _{\alpha ,\beta }'''(0)$ does not vary significantly with
 $\beta$. This value is of great importance because it sets the value of the critical Bond number at which the dispersion relation starts above (purely convex dispersion relation) or below the non-dispersive dispersion relation (non-convex dispersion relation) (see § 4.3). We will refer to these two regimes as the capillary- and the gravity-dominated regime, respectively.
(a) Values of  $\varPsi _{\alpha ,\beta }'''(0)$ for fixed values of
 $\alpha$. (b) Same, for fixed values of
 $\beta$. (c) Particular cases of the V-shaped and L-shaped substrates: dependence of
 $\varPsi _{\alpha ,\beta }'''(0)$ on the angle
 $\alpha$. Note that for
 $\alpha ={\rm \pi} /4=45^{\circ }$, the two situations are the same and we recover
 $\varPsi _{\alpha ,\beta }'''(0) = \tanh '''(0)=-2$. The curve of the L-shaped substrate has been symmetrised about
 $\alpha =45^{\circ }$; the values of
 $\alpha >45^{\circ }$ actually are those of the corresponding angle
 $\beta =90^{\circ }-\alpha$. In all cases, the value of
 $|\varPsi _{\alpha ,\beta }'''(0)|/6$ yields the critical Bond number (see § 4.3).

In figure 9(c) are displayed the values of  $\varPsi _{\alpha ,\beta }'''(0)$ in the particular cases of the V-shaped and the L-shaped substrates. At angle
 $\alpha ={\rm \pi} /4$, we recover the value
 $\tanh '''(0) = -2$, whereas for
 $\alpha \to 0$, we have
 $\varPsi _{\alpha ,\beta }'''(0) \to -1$. In the V-shaped case, when
 $\alpha \to {\rm \pi}/2$, we have
 $\varPsi _{\alpha ,\beta }'''(0) \to -3$.
4.2. An analytical estimation of $\sigma _{{\textit{eff}}}$

We propose an estimation of  $\sigma _{{\textit{eff}}}$ as a cross-sectional averaging of the hydrostatic pressure field, by taking into account the non-uniform profile of curvature of the interface along the transverse section of it, due to the presence of varicose modes. In short, we go one step further than the non-dispersive calculation of Pham et al. (Reference Pham, Perrard and Le Doudic2020) and calculate the
 $k^{4}$ contribution in the framework of the Saint-Venant equations. Owing to the length of the derivations, their technical details are deferred to Appendix B, where we first analytically compute the curvature of the interface of the varicose modes using an adiabatic hypothesis on the sections. We then perform an estimation of the averaged pressure gradient that yields
 $\sigma _{{\textit{eff}}}$, through a toy model. This toy model is motivated by a few statements on how dispersive effects due to surface tension can be taken into account within the Saint-Venant formalism we used to study the non-dispersive regime of our sessile cylinders (Pham et al. Reference Pham, Perrard and Le Doudic2020). These statements are made in Appendix A.
The main result of this study is that, because of the non-flat interface, the perturbative curvature profile along the interface when varicose perturbations are present is non-trivial. At low angle  $\alpha$, the curvature is dominant at the drop tip, while at steep angle
 $\alpha$, the maximum of the curvature is reached about the top of the drop. The uneven distribution of curvature leads to an effective reduced surface tension of about 57 mN m
 $^{-1}$ observed in our experiments, in both the V-shaped and the L-shaped substrates. The comparisons with the experiments are summarised in tables 1 and 2.
Case of the V-shaped substrate. Experimental values of  $\sigma _{{\textit{eff}}}$ found by fitting the spectra, using (1.1), for different volumes
 $V$ and comparison with the toy model. The agreement is fair, with a relative error of 15 %.

Case of the L-shaped substrate. Comparison of the values of  $\sigma _{{\textit{eff}}}$ between experiments and toy model. The agreement is good, with an error of less than 10 %.

In the case of our V-shaped geometry, at a low angle  $\alpha = 10^{\circ }$, the fitting of the value of
 $\sigma _{{\textit{eff}}}$ does not show much dependence on the volume, and nor do the values yielded by the toy model, which undershoots the experimental value with an error of 15 %. In the case of our L-shaped substrate, the experimental values do not show any obvious dependence on the angle
 $\alpha$, while the toy model we used shows a small decrease in the values of
 $\sigma _{{\textit{eff}}}$ with increasing angles
 $\alpha$. In any case, we obtain a better agreement than in the V-shaped case. The error is of 10 % with the experimental data.
4.3. Effective Bond number and critical value
From the general dispersion relation (1.1) and the Taylor expansion of  $\varPsi (\xi )$ at order three, we get, at order
 $k^{4}$,
 \begin{equation} \omega^{2} = c_{{\textit{eff}}}^{2}\kern0.05em k^{2} [1 + (\textit{Bo}_{{\textit{eff}}} - \textit{Bo}_{{\textit{c}}})k^{2}W_{{\textit{eff}}}^{2}]+ \mathscr{O}(k^{6}), \end{equation}
with the effective Bond number and the critical Bond number defined as
 \begin{equation} \textit{Bo}_{{\textit{eff}}} = \frac{\sigma_{{\textit{eff}}}}{\rho g_{{\textit{eff}}}W_{{\textit{eff}}}^{2}},\quad \textit{Bo}_{{\textit{c}}} = \frac{|\varPsi'''(0)|}{6}. \end{equation}
In the V-shaped and L-shaped cases, both quantities depend strongly on the angle  $\alpha$. The difference
 $\textit{Bo}_{{\textit{eff}}} - \textit{Bo}_{{\textit{c}}}$, as can be seen in (4.4), ensures whether the dispersion relation is purely convex (namely, is always above its tangent), yielding the capillary-dominated regime, or starts like a concave curve in the neighbourhood of the origin (the dispersion relation curve starts under the line
 $\omega =c_{{\textit{eff}}}\,k$). In both cases, the shape of the curve is convex at large wavenumbers
 $k$ (
 $\omega \sim \sqrt {\sigma _{{\textit{eff}}}/\rho }k^{3/2}$). For a given substrate of given angle
 $\alpha$, be it an L-shaped or a V-shaped substrate, the larger the volume of water, the larger the effective width
 $W_{{\textit{eff}}}$ and the smaller the effective Bond number
 $\textit{Bo}_{{\textit{eff}}}$. Conversely, because of the presence of
 $g_{{\textit{eff}}}=g\sin \alpha$,
 $\textit{Bo}_{{\textit{eff}}}$ can reach large numbers when the volume is small (yet larger than the Plateau–Rayleigh threshold).
As can be seen in figure 9(c), the value of  $\varPsi '''(0)$ ranges from
 $-1$ at vanishing
 $\alpha$, to
 $-2$ at
 $\alpha ={\rm \pi} /4$ for a V-shaped substrate, and down to
 $-3$ for
 $\alpha$ approaching
 ${\rm \pi} /2$ when ignoring the capillary cap. These results are valid in the absence of surface tension, or considering that the interface remains horizontal. Now, let us compare the previous results with the experimental results of § 2 in terms of effective Bond number
 $\textit{Bo}_{{\textit{eff}}}$.
In the V-shaped case with no surface tension, we have  $\alpha =10^{\circ }$,
 $\varPsi _{\textit{num}}'''(0)\simeq -1.061$, so that
 $\textit{Bo}_{{\textit{c}}}\simeq 1/6\simeq 0.167$. The value of the effective surface tension
 $\sigma _{{\textit{eff}}}$ is given by fitting the experimental spectra (see table 1). For a volume
 $V=35$ ml, we find
 $\textit{Bo}_{{\textit{eff}}}\simeq 1.00$, whereas for a larger volume
 $V=80$ ml, we find
 $\textit{Bo}_{{\textit{eff}}}\simeq 0.274$. At volumes less than
 $V=80$ ml, the dispersion relation curve remains convex and we can note that the curve is linear within a larger range of small
 $k$ as the volume increases. It seems that the transition occurs in the vicinity of the volume
 $V=80$ ml (see figure 3). Therefore, from our experiments, we can perform the estimation
 $\textit{Bo}_{{\textit{c}}}\simeq 0.274$, so that
 $\varPsi _{\textit{expe}}'''(0)\simeq -6\times 0.274\simeq -1.644$. This result departs from the case without surface tension because of the presence of the capillary cap on top of the triangular wedge.
5. Beyond the linear dispersive regime: the Korteweg–de Vries equation
In this section we will take into account the nonlinear effects and evidence the propagation of nonlinear constriction waves along our cylinders. To that end, we will draw an analogy between the Saint-Venant equations and the equations of nonlinear acoustics. This analogy will yield an ad hoc KdV equation. Note that this formalism can be generalised to other constriction waves such as solitary waves found in Plateau borders (§ 5.4).
5.1. Linear part of the Korteweg–de Vries equation
We will start with the following statement: if we consider the first dispersive contribution of the general dispersion relation (1.1), we obtain (4.4), which corresponds to a wave equation that reads
 \begin{equation} \eta_{tt}-c_{{\textit{eff}}}^{2}[\eta_{xx}+W_{{\textit{eff}}}^{2}(\textit{Bo}_{{\textit{c}}}-\textit{Bo}_{{\textit{eff}}})\eta_{xxxx}] = 0. \end{equation}
The linear part of the KdV equation (1.2) reads
 \begin{equation} \eta_{t}+c_{{\textit{eff}}}[\eta_{x}+\tfrac 1 2 W_{{\textit{eff}}}^{2}(\textit{Bo}_{{\textit{c}}}-\textit{Bo}_{{\textit{eff}}})\eta_{xxx}] = 0, \end{equation}
and this wave equation corresponds to travelling waves in the right direction.
5.2. Saint-Venant equations as nonlinear acoustics equations
In order to obtain the nonlinear contribution in (1.2), we will use the Saint-Venant equations previously used in Part 1 of this work (Pham et al. Reference Pham, Perrard and Le Doudic2020) and treat them as nonlinear acoustics equations. The aim is to eliminate the averaged speed in the Saint-Venant equations and obtain a nonlinear wave equation in the section variable only. The details of the derivation are deferred to Appendix A.3. They follow a calculation due to Earnshaw (Reference Earnshaw1860), as presented by Whitham (Reference Whitham1999, § 6.9). In this subsection, we will disregard the surface tension effects and suppose that the transverse section of liquid has a flat horizontal free interface.
We start from the Saint-Venant equations
 \begin{gather} \partial_t S + \partial_x{(S\bar u)} = 0, \end{gather}
 \begin{gather}\partial_t \bar u + \bar u \partial_x \bar u + \frac 1\rho \langle\partial_x P\rangle =0, \end{gather}
for a transverse section of the liquid  $S(x,t)$, a section-averaged velocity in the
 $x$-direction
 $\bar u(x,t)$ and a section-averaged hydrostatic pressure gradient
 $\langle \partial _x P(x,t)\rangle$ (see Pham et al. Reference Pham, Perrard and Le Doudic2020). In the context of a section with a horizontal free interface, the section-averaged pressure gradient reads
 $\langle \partial _x P\rangle = \rho g \partial _x H$, where
 $H(x,t)$ denotes the vertical position of the free interface. As we want eventually to obtain an equation in the variable
 $S$ only, we first write
 $H$ as a function of the cross-sectional area
 $S$ and perform the symbolic substitution
 $(1/\rho ) \langle \partial _x P \rangle \equiv ({1}/{S}) \partial _x \varPi (S)$. The Saint-Venant equations then become
 \begin{gather} \partial_t S + \partial_x{(S\bar u)} = 0, \end{gather}
 \begin{gather}\partial_t \bar u + \bar u \partial_x \bar u + \frac{1}{S} \partial_x \varPi(S) =0, \end{gather}
which are equivalent to the one-dimensional compressible Euler equations governing the dynamics of a compressible isentropic gas of density  $\varrho (x,t)$, velocity
 $\bar u(x,t)$ and pressure field
 $\varPi (x,t)$.
In the case of a polytropic gas, namely a system that has an equation of state that reads  $\varPi (S) = \kappa S^{\gamma }$, and in the case of a wave travelling in the right direction,
 $\bar u$ can be eliminated in (5.5) and we obtain the nonlinear wave equation
 \begin{equation} \partial_t S +c_0\left( 1+ \frac{\gamma+1}{2} \frac{S-S_0}{S_0}\right)\partial_x S = 0.\end{equation}
In the case of a rectangular section, we have  $\gamma =2$. In the case of a triangular section, we have
 $\gamma =3/2$. Note that, if the nonlinear terms are neglected, we recover the non-dispersive linear regime.
The linear waves in the variable  $S(x,t)$ actually follow the dispersion relation (5.2) at first dispersive order. Taking into account the first correction both in nonlinearity and in dispersion thus yields the following KdV equation:
 \begin{equation} \partial_t S +c_{{\textit{eff}}}\left[ \partial_x S + \frac{\gamma+1}{2} \frac{S-S_0}{S_0}\partial_x S + \frac 12 W_{{\textit{eff}}}^{2} (\textit{Bo}_{{\textit{c}}} -\textit{Bo}_{{\textit{eff}}})\partial_{xxx}S\right]= 0. \end{equation}
For a rectangular channel of width  $W$ and depth at rest
 $H_0$, we have
 $S(x,t)=W H(x,t)$,
 $c_{{\textit{eff}}}=\sqrt {gH_0}$ and
 $\gamma =2$. Moreover,
 $\varPsi (\xi )=\tanh (\xi )$ so that
 $\varPsi '''(0) = -2$ and
 $\textit{Bo}_{{\textit{c}}} = 1/3$. By using
 $\eta =H(x,t)-H_0$ as the variable, the standard KdV equation is recovered, which reads
 \begin{equation} \partial_t \eta +\sqrt{gH_0}\left[ \partial_x \eta + \frac{3}{2} \frac{\eta}{H_0}\partial_x \eta + \frac 12 H_0^{2} \left(\frac 13 -\frac{\sigma}{\rho g H_0^{2}}\right)\partial_{xxx}\eta\right]= 0. \end{equation}
In the case of a wedge-shaped channel with a flat interface (surface tension is taken into account but not the capillary cap) and of depth  $H_0$, we have
 $c_{{\textit{eff}}}=\sqrt {gH_0/2}$ and
 $W_{{\textit{eff}}} = H_0/(2\sin \alpha )$. The variations of the cross-sectional area are related to the displacement of the border of the interface, hence to the variations of the width of the interface, which will be denoted
 $W$. The cross-sectional area
 $S$ is proportional to
 $W^{2}$ so that the ratio
 $(S-S_0)/S_0$ becomes
 $2(W-W_0)/W_0$ with
 $W_0 = \sin (\alpha +\beta )/(\sin \alpha \sin \beta ) H_0=2[\sin (\alpha +\beta )/{\sin {\beta }}]W_{{\textit{eff}}}$ (see (3.14)). The KdV equation for a general triangle now reads, in terms of variable
 $\eta =W-W_0$, with
 $W_0$ the width at rest:
 \begin{equation} \partial_t \eta +c_{{\textit{eff}}}\left[ \partial_x \eta + \left(\frac{5}{4} \frac{\sin\beta}{\sin(\alpha+\beta)}\right) \frac{\eta}{W_{{\textit{eff}}}}\partial_x \eta + \frac 12 W_{{\textit{eff}}}^{2} (\textit{Bo}_{{\textit{c}}} -\textit{Bo}_{{\textit{eff}}}) \partial_{xxx}\eta \right]= 0, \end{equation}
for angles  $\alpha <\beta$, with
 $\textit{Bo}_{{\textit{c}}} = |\varPsi _{\alpha ,\beta }'''(0)|/6$ and
 $\textit{Bo}_{\textit{eff}}=\sigma/(\rho g_{\textit{eff}} W_{\textit{eff}}^2)$.
In the L-shaped case ( $\alpha ={\rm \pi} /2-\beta$) and for small values of
 $\alpha$, the prefactor
 $\sin \beta /{\sin (\alpha +\beta )}$ is close to
 $1$ and can be ignored in this limit. We then have the approximation
 $5/4\times \sin \beta /{\sin (\alpha +\beta )}\simeq 5/4$.
In contrast, in the V-shaped case ( $\alpha =\beta$) and for a small angle
 $~\alpha$, the sinusoidal prefactors add a factor
 $1/2$ and we have
 $5/4\times \sin \beta /{\sin (\alpha +\beta )}\simeq 5/8$.
In our experimental set-up, which will consist of an L-shaped triangle with a capillary cap on top, the equation of state is no longer that of a polytropic gas, but rather that of a barotropic gas. In this case,  $\varPi (S)$ is no longer a power law. The nonlinear wave equation can be formally derived using the expression of
 $\varPi (S)$, which could be computed after tedious calculations. Instead of doing so, we assume that the geometrical ansatz of the cylinder cross-section as a triangle of angle
 $\alpha$ and
 $\beta$ (hence a polytropic exponent
 $\gamma = 3/2$) is relevant to yield the nonlinear term in the nonlinear wave equation, so that the KdV equation now reads in the variable
 $\eta =W-\Delta Y_{\textit{max}}$, where
 $\Delta Y_{\textit{max}}$ is the width at rest:
 \begin{equation} \partial_t \eta +c_{{\textit{eff}}}\left[\partial_x \eta + \left(\frac{5}{2} \frac{W_{{\textit{eff}}}}{\Delta Y_{\textit{max}}}\right) \frac{\eta}{W_{{\textit{eff}}}}\partial_x \eta + \frac 12 W_{{\textit{eff}}}^{2} (\textit{Bo}_{{\textit{c}}} -\textit{Bo}_{{\textit{eff}}}) \partial_{xxx}\eta \right]= 0, \end{equation}
with  $W_{{\textit{eff}}} = c_{{\textit{eff}}}^{2}/g_{{\textit{eff}}}$,
 $\textit{Bo}_{{\textit{c}}}$ and
 $\textit{Bo}_{{\textit{eff}}}$ are given by (4.5a,b), and the prefactor
 $\nu _1$ in front of the nonlinear term here is
 \begin{equation} \nu_1 = \frac 52 \frac{W_{{\textit{eff}}}}{\Delta Y_{\textit{max}}}.\end{equation}
5.3. Experimental results
For a KdV equation of the form
 \begin{equation} \partial_t \eta +c_{{\textit{eff}}}\left[\partial_x \eta + \frac{\nu_1}{W_{{\textit{eff}}}} {\eta}\partial_x \eta + \frac 12 {W_{{\textit{eff}}}}^{2} (\textit{Bo}_{{\textit{c}}} -\textit{Bo}_{{\textit{eff}}}) \partial_{xxx}\eta\right]= 0, \end{equation}
the one-soliton solution reads
 \begin{equation} \eta(x,t) = A_0 \operatorname{sech}^{2}\left(\frac{x-ct}{\varDelta}\right), \end{equation}
with the following relationship between speed  $c$, amplitude
 $A_0$ and width
 $\varDelta$:
 \begin{gather} \frac{c}{c_{{\textit{eff}}}} = 1 + \frac{\nu_1 A_0}{3 W_{{\textit{eff}}}}, \end{gather}
 \begin{gather}\frac{\varDelta}{W_{{\textit{eff}}}} = \sqrt{2\frac{\textit{Bo}_{{\textit{c}}}-\textit{Bo}_{{\textit{eff}}}}{{c}/{c_{{\textit{eff}}}}-1}}. \end{gather}
In our experiments, we will study the propagation of large negative amplitude waves and see if the relationship (5.15) is satisfied with  $\nu _1$ given by (5.12). To that end, we will consider the L-shaped substrate, tilted by a small angle
 $\alpha =2^{\circ }, 3^{\circ }$ or
 $4^{\circ }$. We will use a volume of water
 $V=40$ ml, which is sufficiently small for the effective Bond number to be large compared to the value of critical Bond number, which lies somewhere in between
 $1/3$ and
 $1/6$ (see§ 4.3).
In order to generate a large amplitude soliton, we use a micro-pipette that injects a small jet of water inside the sessile liquid cylinder. Because of the jet, a depression is locally created that strongly disturbs the interface (see figure 10a and the supplementary movie available at https://doi.org/10.1017/jfm.2021.502). A train of fast waves and a hump of water are ejected and travel to the other end of the drop. Eventually, a deep depression solitary wave emerges, propagating at a speed  $c$ slower than the speed of the non-dispersive waves
 $c_{{\textit{eff}}}$. Note that, contrary to their Leidenfrost counterpart, because of the dissipation at the contact line, these depression waves damp in a shorter distance about half of the drop.
(a) Snapshots of the propagation of a KdV soliton. The deposited volume is equal to 40 ml and the angle  $\alpha$ is equal to
 $2^{\circ }$. After a strong perturbation of the surface at the tip of the cylinder, waves propagate ahead of a solitary depression that emerges (see arrows) and propagates at a speed
 $c$ lower than
 $c_{{\textit{eff}}}$, the propagation speed of the long-wavelength waves. Eventually, it vanishes. (b) Renormalised propagation speed
 $c/c_{{\textit{eff}}}$ versus renormalised amplitude
 $A_0/(3W_{{\textit{eff}}})$. The region
 $c/c_{{\textit{eff}}}>1$ corresponds to the supersonic soliton regime (namely, the gravity-dominated regime where elevation solitons exist), whereas the region
 $c/c_{{\textit{eff}}}<1$ corresponds to the subsonic soliton regime (namely, the capillary-dominated regime where depression solitons exist). The data points (SH, for three different angles
 $\alpha$) seem to follow a straight line of slope
 $\nu _1\simeq 2$. As a comparison, we have added the experimental data in mercury from Falcon et al. (Reference Falcon, Laroche and Fauve2002) (in grey, following the standard slope
 $\nu _1=3/2$, each symbol representing a given depth of mercury) along with those obtained by Perrard et al. (Reference Perrard, Deike, Duchêne and Pham2015) in Leidenfrost (open symbols, following a slope
 $\nu _1^{\textit{expe}}\simeq 3$).

We measure the propagation speed  $c$ of this solitary wave as well as its negative amplitude
 $A_0$. The results are shown in figure 10(b), where the dimensionless ratio
 $c/c_{{\textit{eff}}}$ is measured with respect to the dimensionless ratio
 $A_0/3W_{{\textit{eff}}}$. In this plot, we have added the results found by Falcon et al. (Reference Falcon, Laroche and Fauve2002) in experiments performed in mercury; they follow a line of slope
 $\nu _1=3/2$ in accordance with the rectangular geometry of the tank they use. The measurements in the Leidenfrost case are plotted as well, and they follow a line of slope
 $\nu _1^{\textit{expe}}\simeq 3$ (Perrard et al. Reference Perrard, Deike, Duchêne and Pham2015).
At volume  $V=40$ ml and length
 $L=50$ cm, the cross-sectional area is
 $S_{{\textit{tot}}}=V/L=80$ mm
 $^{2}$; the value of the geometric parameter
 $m$ yielding the analytical shape of the drop section can then be analytically deduced, as well as the values of the width of the drop
 $\Delta Y_{\textit{max}}$ and the effective width
 $W_{{\textit{eff}}}=c_{{\textit{eff}}}^{2}/g_{{\textit{eff}}}$ (see (3.44), (2.20) and (3.47), respectively, in Pham et al. Reference Pham, Perrard and Le Doudic2020). At angles
 $\alpha =2^{\circ }, 3^{\circ }$ and
 $4^{\circ }$, the prefactor
 $\nu _1$ given by (5.12) is then respectively equal to 2.1, 2.03 and 1.99, which are very close to 2. In order to test this prediction, we have plotted the line of slope
 $\nu _1=2$. From the experimental data points obtained with our superhydrophobic substrate (SH), the most significant points are those with the largest amplitudes and the lowest speeds, since they are the easiest ones to characterise. Those points seem to follow a slope
 $\nu _1^{\textit{expe}}$ slightly larger than
 $2$, which is in reasonable agreement with our prediction
 $\nu _1=2$.
5.4. Korteweg–de Vries solitons in Plateau borders
The method we have presented to derive the KdV equation is generic and it can be applied to other free-interface systems with a cylinder-type geometry. As an illustration of the generality of the method, we will consider the case of Plateau borders, along which the observation of the propagation of depression solitary waves has been reported in experiments using soap films (Argentina et al. Reference Argentina, Cohen, Bouret, Fraysse and Raufaste2015; Bouret et al. Reference Bouret, Cohen, Fraysse, Argentina and Raufaste2016).
A Plateau border is a cylinder of liquid that corresponds to a geometric region bounded by three tangent circles of radius  $R(x,t)$. The latter corresponds to the radius of curvature of the cylinder at the coordinate
 $x$ and time
 $t$ (see figure 11). The section of a Plateau border of radius of curvature
 $R$ is given by
 \begin{equation} S(R)=\left(\sqrt 3 -\frac{\rm \pi}{2}\right)R^{2}. \end{equation}
Let  $C$ be one of the three centres of curvature. The distance from the origin to this centre
 $~C$ is
 \begin{equation} OC(R) = \frac{R}{2\sqrt{3}}+R\frac{\sqrt 3}{2}=\frac{2}{\sqrt{3}} R. \end{equation}
The distance from the origin to the interface is
 \begin{equation} Ox_i(R) = |OC(R)|-R = \left(\frac{2}{\sqrt{3}}-1\right) R. \end{equation}
Using the Laplace law, we can then deduce the pressure term, which reads
 \begin{equation} P(x,t) ={+}\sigma\left[-\frac{1}{R(x,t)} - \left(\frac{2}{\sqrt 3} -1\right)\partial_{xx}R(x,t) \right]. \end{equation}
It is uniform in the section so that we can apply the Saint-Venant formalism. After setting  $R=R_0\{1+\varepsilon \exp [{\rm i} (kx-\omega t)]\}$ and
 $\bar u=\varepsilon u_0\exp [{\rm i} (kx-\omega t)]$, (5.3) and (5.4), at order one in
 $\varepsilon$, yield the dispersion relation
 \begin{equation} \omega^{2}=\frac{\sigma}{2\rho R_0}k^{2}\left[ 1+\left(\frac{2}{\sqrt 3}-1\right)R_0^{2} k^{2} \right] \end{equation}
after elimination of  $u_0$ and
 $\varepsilon$.
Transverse section of a Plateau border of radius of curvature  $R$, centred at the origin
 $O$. Its boundaries are defined as three tangent circle arcs (in blue); and
 $x_i$ denotes the distance from the centre to the interface. The length
 $|Cx_i|$ is the radius of curvature
 $R$ of the Plateau border, and
 $C$ is the centre of curvature of one of the three interfaces. The Plateau border is circumscribed in a circle of radius
 $R/\sqrt {3}$, centred at the origin.

It would be interesting to validate this theoretical dispersion relation experimentally. To our knowledge, the dispersion relations of waves along a Plateau border studied so far were related to the sinuous modes (Kosgodagan Acharige, Elias & Derec Reference Kosgodagan Acharige, Elias and Derec2014) and not to the varicose modes.
From the nonlinear acoustics analogy (see Appendix A.3), we can deduce the following equation of state:
 \begin{equation} \varPi(S) = \frac\sigma\rho \left(\sqrt 3 - \frac{\rm \pi}{2}\right)^{1/2} S^{1/2}, \end{equation}
which corresponds to a polytropic gas, with exponent  $\gamma =1/2$. The dispersion relation for linear dispersive waves travelling to the right reads
 \begin{equation} \omega = c_0 k \left[1+\left(\frac 1{\sqrt{3}}-\frac 12\right)R_0^{2}k^{2}\right], \end{equation}
with  $c_0=\sqrt {\sigma /(2\rho R_0)}$. The KdV equation in the
 $S$ variable can then be derived from (5.8) as
 \begin{equation} \partial_t S + c_0\left[\partial_x S + \frac {3}{4} \frac{S-S_0}{S_0}\partial_x S - \frac{1}{2}R_0^{2}\left(\frac{2}{\sqrt{3}}-1\right)\partial_{xxx}S\right] = 0. \end{equation}
The KdV equation in the width variable  $r$ (
 $R=R_0+r$) then reads
 \begin{equation} \partial_t r + c_0 \left[\partial_x r + \frac 3{2R_0} r \partial_x r - \frac{1}{2} R_0^{2} \left(\frac{2}{\sqrt 3} -1\right)\partial_{xxx}r\right] =0. \end{equation}
We then have a soliton solution (5.14) that reads, for  $\nu _1=3/2$ and
 $v=c/c_{{\textit{eff}}}$:
 \begin{equation} r(x,t) = 2(v-1) R_0 \operatorname{sech}^{2} \frac{x-v c_0 t}{\sqrt{\dfrac{2(2/\sqrt{3}-1)}{1-v}}R_0}\equiv A_0 \operatorname{sech}^{2} \frac{x-v c_0 t}{ \dfrac{2\sqrt\beta}{\sqrt{1-v}}R_0 }. \end{equation}
Experimentally, Bouret et al. (Reference Bouret, Cohen, Fraysse, Argentina and Raufaste2016) found  $2\sqrt {\beta _{\textit{expe}}}\simeq 0.4$, whereas we have
 $2\sqrt {\beta }\equiv \sqrt {2 (2/\sqrt {3} -1)}\simeq 0.56$, which yields a relative error of
 $40$ %, improving the model used by Argentina et al. (Reference Argentina, Cohen, Bouret, Fraysse and Raufaste2015), who found
 $2\sqrt \beta =2\sqrt {(2\sqrt 3-{\rm \pi} )/{\rm \pi} }\simeq 0.64$, namely a relative error of
 $60$ %.
6. Conclusion
In Part 1 of this two-part series, we showed that sessile cylinders on a flat superhydrophobic substrate were not stable owing to the Plateau–Rayleigh instability. In contrast, placed upon a wedge-shaped superhydrophobic channel, they could be stable against varicose modes provided their cross-sectional area is sufficiently large. We resorted to the Saint-Venant equations in order to analytically compute the phase speed of varicose waves in the non-dispersive regime. We showed that the cylinder section was equivalent to the superposition of a wedge-shaped section of water with a capillary cap on top of it (Pham et al. Reference Pham, Perrard and Le Doudic2020).
In this Part 2, we have studied the dispersive regime of the varicose waves using numerical calculations. These calculations yielded the full spectra of the varicose and the sloshing modes of a triangular channel of arbitrary shape, without considering the surface tension effects. We introduced the dispersive contribution of the surface tension using the Saint-Venant formalism and evidenced an effective renormalisation of the surface tension stemming from the presence of a capillary cap which induces a non-trivial curvature profile along the free boundary of the section of the cylinder submitted to varicose perturbations. These calculations allowed us to estimate the transition between the capillary- and the gravity-dominated regimes, depending on the cross-sectional area of the cylinder. This transition crucially depends on the bathymetry of the channel. Sinuous modes have been experimentally evidenced as well.
We have proposed a derivation of the KdV equation, adapted to our capillary cylinders. For this purpose, we have calculated the first nonlinear corrections to our linear wave propagation, by using a nonlinear acoustics analogy to the Saint-Venant equations. Coupled with a reduced-gravity effect caused by the geometry of the substrate, the propagation of depression KdV solitons of centimetre scale was evidenced. Experiments regarding elevation KdV solitons will be carried to confirm the predictions.
Our derivation of the KdV equation was adapted to another physical system, Plateau borders, and our predictions were in agreement with the experiments previously performed by Argentina et al. (Reference Argentina, Cohen, Bouret, Fraysse and Raufaste2015).
All the theoretical results regarding the dispersive regime were obtained using a number of assumptions and approximations that reasonably capture the experimental properties of the different modes. The presence of the capillary cap on top of the wedge-shaped section is of importance and must be taken into account in order to be fully accurate. To do so, numerical simulations of the full hydrodynamics equations must be performed; they are left for future work.
Supplementary movies
Supplementary movies are available at https://doi.org/10.1017/jfm.2021.502.
Acknowledgements
C.T.P. thanks Cédric Mezui for preliminary experiments. The authors are grateful to Laboratoire Matière et Systèmes Complexes (MSC) and Laboratoire Interdisciplinaire des Sciences du Numérique (LISN) for their valuable material and financial support, A. Grados and M. Receveur for technical support, and F. Novkoski, F. Élias and V. Leroy for fruitful discussions.
Declaration of interests
The authors report no conflict of interest.
Appendix A. Saint-Venant equations: dispersive and nonlinear effects
We start this appendix by presenting the Saint-Venant equations in § A.1. We will see to what extent this Saint-Venant formalism can capture the dispersive effects, and comparisons with the standard rectangular tank dispersion relation will be made in § A.2. From these statements, a toy model devoted to the estimation of the effective surface tension  $\sigma _{{\textit{eff}}}$ measured in our experimental spectra will follow in Appendix B. Then, § A.3 is specifically devoted to the derivation of the nonlinear wave equation (5.7), by drawing an analogy between the Saint-Venant equations and nonlinear acoustics equations.
A.1. Saint-Venant equations
The Saint-Venant equations are a set of hyperbolic equations that were proposed by the eponymous Saint-Venant (Reference Saint-Venant1871) in order to study flows in open channels. Their derivation is based on a long-wavelength expansion (shallow-water limit  $k\to 0$) and the basic hypotheses are the following: (i) the flow is considered quasi-parallel in the
 $x$-direction; and (ii) the pressure is hydrostatic. Under these hypotheses, if one sets the quantities
 \begin{gather} S(x,t) \text{, the transverse cross-sectional area of liquid}, \end{gather}
 \begin{gather}\bar u (x,t) = \frac{1}{S(x,t)} \int_{S(x,t)}u(x,y,z,t) \, \mathrm{d} y\, \mathrm{d} z \text{, the section-averaged velocity}, \end{gather}
 \begin{gather}P(x,y,z,t) \text{, the hydrostatic three-dimensional pressure field}, \end{gather}
then the inviscid Saint-Venant equations read
 \begin{gather} \partial_t S + \partial_x (S\bar u) = 0, \end{gather}
 \begin{gather}\partial_t \bar u + \bar u\partial_x \bar u + \frac{1}{S(x,t)}\int_{S(x,t)} \frac{1}{\rho}\frac{\partial}{\partial x}[P(x,y,z,t)] \,\mathrm{d} y\, \mathrm{d} z = 0. \end{gather}
This set of equations is expressed in terms of section-averaged pressure gradient in the  $x$-coordinate and turns into one-dimensional equations in space. For a complete derivation of these equations (including viscous effects), one can read the article by Decoene et al. (Reference Decoene, Bonaventura, Miglio and Saleri2009). As we are interested in the linear dispersion relation of varicose waves, we will study a linearised version of these equations.
A.2. Dispersion and Saint-Venant formalism
One particular case where Saint-Venant can capture a part of the dispersive contribution of surface tension is when the interface remains strictly horizontal in the transverse plane  $(y,z)$, that is, independent of the coordinate
 $y$. As an illustrative example, let us consider the varicose mode of gravity waves in a rectangular channel of fixed width
 $W_0$. This will show the limitations of the Saint-Venant formalism. The interface is supposedly horizontal and characterised by its height
 $H(x,t)$. At rest, the interface is flat, and
 $H(x,t)=H_0$. The section
 $S(x,t)$ reads
 $W_0H(x,t)$. Here, the pressure field is hydrostatic and, taking into account the longitudinal curvature
 $\kappa ^{\textit{l}}=-\partial _{xx}H$, it reads
 \begin{equation} P(x,y,z,t) = \rho g [H(x,t)-z] - \sigma \partial_{xx} H(x,t), \end{equation}
so that the linearised Saint-Venant equations become
 \begin{gather} W_0\partial_t H + W_0H_0\partial_x u=0, \end{gather}
 \begin{gather}\partial_t u + \frac{1}{S} \int_S \frac 1 \rho \partial_x P(x,y,z,t)\,\mathrm{d} y \,\mathrm{d} z = 0. \end{gather}
For a section  $S(x,t)=\{(y,z)\,|\, 0< y< W_0,\, 0< z< H(x,t)\}$, knowing that the quantity
 $(1/\rho ) \partial _x P = g\partial _x H(x,t)-({\sigma }/{\rho })\partial _{xxx} H(x,t)$ is independent of the coordinates
 $y$ and
 $z$, we have
 \begin{equation} \frac{1}{S} \int_S \frac 1 \rho\partial_x [P(x,t)]\,\mathrm{d} y \,\mathrm{d} z=\left[\frac 1 \rho\partial_x P\right]_{(x,t)}\times \frac{1}{S} \int_S 1\, \mathrm{d} y\,\mathrm{d} z=\left[\frac 1 \rho\partial_x P\right]_{(x,t)}. \end{equation}
The wave equation satisfied by  $H$ can be deduced as
 \begin{equation} \partial_{tt}H - gH_0\left( \partial_{xx} H - \frac{\sigma}{\rho g} \partial_{xxxx}H\right)=0. \end{equation}
Setting  $H(x,t)\sim \exp [{\rm i}(kx-\omega t)]$ yields the dispersion relation
 \begin{equation} \omega^{2}(k)= gH_0(k^{2} + \ell_{{\textit{c}}}^{2}k^{4})\underset{k\to 0}= gH_0 k^{2}(1+\ell_{{\textit{c}}}^{2} k^{2}). \end{equation}
In contrast, it is well known that the actual dispersion relation for varicose waves in a rectangular channel reads
 \begin{equation} \omega^{2}= gk(1 + \ell_{{\textit{c}}}^{2}k^{2})\tanh(kH_0)= gH_0k^{2}(1 + \ell_{{\textit{c}}}^{2}k^{2})[1-\tfrac 1 3 (kH_0)^{2} +\mathscr{O}((kH_0)^{4})].\end{equation}
Both give the same non-dispersive results at quadratic order, namely
 \begin{equation} \omega^{2}\underset{kH_0\to 0}{\sim}gH_0 k^{2}. \end{equation}
The Saint-Venant averaging yields the dispersive contribution related to the surface tension but not that related to the finite depth  $H$ via the
 $\tanh$ function. It amounts to considering the
 $\tanh$ function as a linear function (
 $\tanh x \equiv x$) in the actual dispersion relation expression. The toy model presented in Appendix B will be based on this substitution.
A.3. Saint-Venant equations as nonlinear acoustics equations
In this subsection, we will treat the Saint-Venant equations as nonlinear acoustics equations in order to obtain a nonlinear wave equation in the variable  $S$, the cross-sectional area. We will neglect the surface tension contributions so that the transverse section of liquid has a flat interface and the hydrostatic pressure field gradient in the
 $x$-direction reads
 \begin{equation} \partial_x P(x,y,z,t) = \rho g \partial_xH(x,t). \end{equation}
On the one hand, the section-averaged Saint-Venant equations are given by (A4) and (A5).
On the other hand, the dynamics of a compressible isentropic gas of density  $\varrho (x,t)$, velocity
 $v(x,t)$ and pressure field
 $\varPi (x,t)$ is governed by the one-dimensional compressible Euler equations, which read
 \begin{gather} \partial_t \varrho + \partial_x{(\varrho v)} = 0, \end{gather}
 \begin{gather}\partial_t v + v \partial_x v + \frac{1}{\varrho} \partial_x \varPi =0. \end{gather}
Let  $\langle \partial _x P\rangle$ denote the section-averaged pressure gradient in the
 $x$-coordinate of our hydrodynamic system. When considering the non-dispersive regime, we can write
 $\langle \partial _x P\rangle = \rho g \partial _x H(x,t)$. As the cross-sectional area
 $S$ is monotonic in the height
 $H$,
 $H$ can be considered as a function of
 $S$. Hence, we can perform the symbolic substitution
 \begin{equation} \left\langle\frac 1 \rho\partial_x P\right\rangle = g \partial_x H[S(x,t)] \equiv \frac{1}{S(x,t)} \partial_x \varPi[S(x,t)], \end{equation}
and the Saint-Venant equations turn into
 \begin{gather} \partial_t S + \partial_x{(S\bar u)} = 0, \end{gather}
 \begin{gather}\partial_t \bar u + \bar u \partial_x \bar u + \frac{1}{S} \partial_x \varPi(S) =0. \end{gather}
This set of equations is equivalent to the compressible Euler equations (A15) and (A16) provided that the substitutions  $\bar u \leftrightarrow v$ and
 $S\leftrightarrow \varrho$ are carried out. Equation (A18) corresponds to the mass conservation equation, while (A19) corresponds to the momentum equation. In this situation, the equation of state
 $\varPi (S)$ corresponds to that of a barotropic gas.
At linear order (in the neighbourhood of the equilibrium density/section  $S_0$), we can eliminate
 $\bar u$ and obtain the d'Alembert wave equation
 \begin{equation} \partial_{tt} S - c^{2}(S_0) \partial_{xx} S =0, \end{equation}
with
 \begin{equation} c^{2}(S) = \frac{\partial \varPi}{\partial S}(S), \end{equation}
which yields a non-dispersive wave equation. In the following,  $c(S_0)$ will be denoted
 $c_0$.
As done in the field of nonlinear acoustics (see Whitham Reference Whitham1999, § 6.9, following a calculation due to Earnshaw Reference Earnshaw1860), we can obtain the first nonlinear corrections to this wave equation by expressing  $\bar u(x,t)$ as a function
 $\bar u(S(x,t))$ of the density/section
 $S(x,t)$ and by eliminating it in (A18). To do so, we use the fact that
 $\partial _t\bar u = (\partial _t S) (\partial _S \bar u)$ and
 $\partial _x\bar u = (\partial _x S)(\partial _S \bar u)$; the continuity equation (A18) then turns into
 \begin{equation} \partial_t S + (\partial_x S)\bar u ={-} S (\partial_x S)(\partial_S \bar u), \end{equation}
and the momentum equation (A19), using (A21), turns into
 \begin{equation} [\partial_t S + (\partial_x S)\bar u](\partial_S \bar u) + \frac 1S (\partial_x S) c^{2}(S) = 0.\end{equation}
Combining (A22) and (A23) yields the relationship
 \begin{equation} \partial_S\bar u={\pm} \frac{c(S)}{S},\end{equation}
so that (A22) now reads
 \begin{equation} \partial_t S + [\bar u(S) \pm c(S)] \partial_x S = 0. \end{equation}
The speed of sound  $c(S)$ is given by the equation of state
 $\varPi (S)$ using (A21), and
 $\bar u(S)$ can be deduced from (A24), which closes the equation.
Choosing the upper plus sign in (A24) and (A25) yields at linear order in  $(S-S_0)$,
 $\bar u(S) \simeq [c(S_0)/S_0] (S-S_0)$ and
 $c(S) \simeq c_0 + ({\partial ^{2}\varPi }/{\partial S^{2}})|_{S_0}(S-S_0)/(2c_0)$, so that, at first nonlinear order,
 \begin{equation} \bar u(S) + c(S) = c_0 \left[1 + \left( 1+\frac{S_0}{2c_0^{2}}\left.\frac{\partial^{2}\varPi}{\partial S^{2}}\right|_{S_0} \right) \frac{S-S_0}{S_0} \right]. \end{equation}
In the end, the nonlinear wave equation (A25), for a wave travelling in the right direction, reads
 \begin{equation} \partial_t S + c_0 \left[1 + \left( 1+\frac{S_0}{2c_0^{2}}\left.\frac{\partial^{2}\varPi}{\partial S^{2}}\right|_{S_0} \right) \frac{S-S_0}{S_0} \right] \partial_x S = 0. \end{equation}
We will now focus on the particular case of a polytropic gas, the equation of state of which reads
 \begin{equation} \varPi(S) = \kappa S^{\gamma}. \end{equation}
The exponent  $\gamma$ is called the polytropic exponent. We have
 \begin{equation} c(S) = (\kappa\gamma)^{1/2}S^{{(\gamma-1)}/{2}},\end{equation}
and (A24) yields
 \begin{equation} \bar u(S) = \int_{S_0}^{S} \frac{c(s)}{s} \,\mathrm{d} s = \frac{2}{\gamma-1}[c(S) - c(S_0)]. \end{equation}
We can then compute
 \begin{align} \bar u(S) + c(S) &= \frac{\gamma+1}{\gamma-1} [c(S) - c(S_0)] + c(S_0) \end{align}
 \begin{align} &= \frac{\gamma+1}{2} c(S_0)\frac{S-S_0}{S_0} + c(S_0) + \mathscr{O}(S-S_0), \end{align}
after linearisation of the difference  $[c(S) - c(S_0)]$ in the neighbourhood of
 $S_0$, using (A29). Eventually, in the case of a wave travelling in the right direction, the nonlinear wave equation (A25) – with the upper plus sign – reads, for a polytropic gas,
 \begin{equation} \partial_t S +c_0\left( 1+ \frac{\gamma+1}{2} \frac{S-S_0}{S_0}\right)\partial_x S = 0, \end{equation}
at first nonlinear order, after using (A32) in (A25). Note that this equation only depends on the polytropic exponent  $\gamma$, regardless of the constant
 $\kappa$.
We will now consider the three following particular cases, encountered within this article:
(i) For a rectangular section of constant width
$W_0$ and depth $H(x,t)$, we have $S(x,t)= W_0 H(x,t)$, so that $g\partial _x H = (g/W_0)(\partial _x S)$. In order to satisfy (A17), we then have
(A34)hence a polytropic exponent\begin{equation} \varPi(S)= \frac{gS^{2}}{2W_0}, \end{equation}$\gamma = 2$.(ii) For a triangular section of height
$H(x,t)$ and angles $\alpha$ and $\beta$ (see figure 6a), $S(x,t)=\lambda H(x,t)^{2}$ (with $\lambda =(\sin (\alpha +\beta ))/(2\sin \alpha \sin \beta )$ given by (3.14)), so that $g\partial _x H =g\lambda ^{-1/2}\partial _x S^{1/2}$. Therefore, in order to satisfy (A17), we have
(A35)hence a polytropic exponent\begin{equation} \varPi(S)= \frac{gS^{3/2}}{3\lambda^{1/2}}, \end{equation}$\gamma =3/2$.(iii) For a Plateau border, the pressure field is constant along the interface and is given by (5.20). The second derivative in
$\partial _{xx}R$ will be disregarded since, in the nonlinear acoustics framework, only the non-dispersive terms are taken into account. Hence, we can express the pressure $P$ as a function of the cross-sectional area $S$ and we have, because of (5.17),
(A36)The section-averaged value of\begin{equation} P(x,t) ={-}\frac{\sigma}{R(x,t)} ={-} \frac{\sigma\left(\sqrt 3 - \dfrac{\rm \pi}{2}\right)^{1/2}}{[S(x,t)]^{1/2}}. \end{equation}$\partial _xP$ is given by
(A37)so that the equation of state can be deduced from (A17). It reads\begin{equation} \langle \partial_x P(x,t)\rangle = \frac{\sigma\left(\sqrt 3 - \dfrac{\rm \pi}{2}\right)^{1/2}}{2[S(x,t)]^{3/2}}(\partial_x S), \end{equation}(A38)which yields a polytropic exponent\begin{equation} \varPi(S) = \frac\sigma\rho \left(\sqrt 3 - \dfrac{\rm \pi}{2}\right)^{1/2} S^{1/2}, \end{equation}$\gamma =1/2$.


Appendix B. Estimation of the effective surface tension via a toy model
In this appendix, in order to estimate the first dispersive corrections to the non-dispersive regime due to the surface tension, we will use the idea of averaging the pressure field gradient presented in Appendix A. To that end, a toy model is proposed, based on the Saint-Venant equations pushed to their limits, if not beyond.
B.1. Parametrisation of the interface
In this article and in Pham et al. (Reference Pham, Perrard and Le Doudic2020), in the case of varicose modes, we make the following strong hypothesis: at any coordinate  $x$, at any time
 $t$, we will assume that the cross-sectional shape (of area value
 $S(x,t)$) is adiabatically given by the equilibrium static shape calculated in Pham et al. (Reference Pham, Perrard and Le Doudic2020), at that very value
 $S(x,t)$, corresponding to a geometrical parameter
 $m(x,t)$. This assumption implies that the contact line is free to move on the superhydrophobic substrate, with contact angle at the substrate kept constant at the value
 ${\rm \pi}$. In the rest of this appendix, we will set the parameter
 $\mu$ such that
 $\mu =1-m$.
Under this hypothesis, in the case of a V-shaped substrate of angle  $\alpha$, the shape of the free interface
 $\varGamma _0(x,t)$, at the coordinate
 $x$ and time
 $t$, can be parametrised in the
 $(y,z)$-plane by the angle
 $\phi$ made with the horizontal by its tangent vector
 $\boldsymbol {\tau }$ (see figure 12). It can be viewed as the set of points
 $M(x,\phi ,t)$ such that
 \begin{equation} \forall t\in\mathbb{R},\ \forall x\in\mathbb{R},\ \forall \phi \in [\beta=\alpha, 2{\rm \pi}-\alpha],\quad M(x,\phi,t) = (x,\tilde\eta(x,\phi,t),\tilde\zeta(x,\phi,t)) \end{equation}
with
 \begin{gather} \tilde\eta(x,\phi,t) = \frac{\ell_{{\textit{c}}}}{2}\sqrt{m(x,t)}\int_{\rm \pi}^{\phi}\mathrm{d}\varphi \frac{\cos\varphi}{\sqrt{1-m(x,t)\sin^{2}\dfrac\varphi 2}}, \end{gather}
 \begin{gather}\tilde\zeta(x,\phi,t) = \frac{\ell_{{\textit{c}}}}{2}\sqrt{m(x,t)}\int_{\rm \pi}^{\phi}\mathrm{d}\varphi \frac{\sin\varphi}{\sqrt{1-m(x,t)\sin^{2}\dfrac\varphi 2}} + H_{{\textit{tot}}}(m(x,t)), \end{gather}
with  $H_{{\textit{tot}}}$ that reads
 \begin{align} H_{{\textit{tot}}}(m(x,t)) &= \ell_{{\textit{c}}}\sqrt{m(x,t)} \frac{\tan\alpha}{4}\int^{\alpha}_{2{\rm \pi}-\alpha} \frac{\cos\varphi}{\sqrt{1-m(x,t)\sin^{2}\dfrac\varphi 2}}\,\mathrm{d}\varphi \nonumber\\ &\quad + \frac{2\ell_{{\textit{c}}}}{\sqrt{m(x,t)}} \left[ \sqrt{1-m(x,t)\sin^{2}\frac \alpha 2}-\sqrt{1-m(x,t)} \right]. \end{align}
Schematic of the notation. At time  $t$ and coordinate
 $x$, the section
 $S(x,t)$ is determined by its interface
 $\varGamma _0(x,t)$. The latter can be parametrised, using the angle
 $\phi$ made by its tangent
 $\boldsymbol {\tau }$ with the horizontal, at the corresponding point
 $M(x,\phi ,t$). As an illustration, here,
 $\alpha =30^{\circ }$,
 $\beta =75^{\circ }$ and
 $\mu = 10^{-2}$. For a V-shaped substrate,
 $\beta =\alpha$, whereas for an L-shaped substrate,
 $\beta ={\rm \pi} /2-\alpha$.

In the case of an L-shaped substrate, using the same notation as in the V-shaped case (see figure 12), the interface  $\varGamma _0(x,t)$ can be parametrised in the
 $(y,z)$-plane by the angle
 $\phi$ and be viewed as the points
 $M(x,\phi ,t)$ such that
 \begin{align} \forall t\in\mathbb{R},\ \forall x\in\mathbb{R},\ \forall \phi \in \left[\beta=\frac{\rm \pi}{2} -\alpha, 2{\rm \pi}-\alpha\right],\quad M(x,\phi,t) = (x,\tilde\eta(x,\phi,t),\tilde\zeta(x,\phi,t)), \end{align}
knowing that the expressions of  $\tilde \eta (x,\phi ,t)$ and
 $\tilde \zeta (x,\phi ,t)$ read
 \begin{gather} \tilde\eta(x,\phi,t) = \frac{\ell_{{\textit{c}}}}{2}\sqrt{m(x,t)}\int_{2{\rm \pi}-\alpha}^{\phi}\mathrm{d}\varphi \frac{\cos\varphi}{\sqrt{1-m(x,t)\sin^{2}\dfrac\varphi 2}} - \eta'_{{\textit{bott}}} , \end{gather}
 \begin{gather}\tilde\zeta(x,\phi,t) = \frac{\ell_{{\textit{c}}}}{2}\sqrt{m(x,t)}\int_{2{\rm \pi}-\alpha}^{\phi}\mathrm{d}\varphi\, \frac{\sin\varphi}{\sqrt{1-m(x,t)\sin^{2}\dfrac\varphi 2}} - \zeta'_{{\textit{bott}}}, \end{gather}
 \begin{gather}\eta'_{{\textit{bott}}}={+} \frac{\ell_{{\textit{c}}}}{2}\sqrt{m(x,t)}\,{\cos\alpha} \int^{2{\rm \pi}-\alpha}_{{\rm \pi}/2-\alpha}\mathrm{d}\varphi \frac{\sin\left(\varphi-\dfrac{\rm \pi} 2 +\alpha\right)}{\sqrt{1-m(x,t)\sin^{2}\dfrac\varphi 2}}, \end{gather}
 \begin{gather}\zeta'_{{\textit{bott}}} ={-} \frac{\ell_{{\textit{c}}}}{2}\sqrt{m(x,t)}{\sin\alpha} \int^{2{\rm \pi}-\alpha}_{{\rm \pi}/2-\alpha}\mathrm{d}\varphi \frac{\sin\left(\varphi-\dfrac{\rm \pi} 2 +\alpha\right)}{\sqrt{1-m(x,t)\sin^{2}\dfrac\varphi 2}}. \end{gather}
In both parametrisations, the origin  $O=(0,0)$ is set at the bottom of the substrate.
The hydrostatic pressure field reads, at a given point  $M(x,y,z,t)$ in the liquid, taking the Laplace law at the interface into account
 \begin{equation} p(x,y,z,t) = \rho g[\tilde\zeta(x,\phi,t) - z] + \sigma \kappa, \end{equation}
where the angle  $\phi$ is such that
 $\eta (x,\phi ,t)=y$, whereas
 $\kappa = 2\mathcal {H}$ is twice the mean curvature
 $\mathcal {H}$ and can be split into the sum
 $\kappa =\kappa ^{\textit{t}}+\kappa ^{\textit{l}}$, with
 $\kappa ^{\textit{t}}$ the transverse curvature (that is, in the section) and
 $\kappa ^{\textit{l}}$ the longitudinal curvature (in the
 $x$-direction).
From now on, the variable  $x$ will be expressed in
 $\ell _{{\textit{c}}}$ units and the wavenumber
 $k$ will be dimensionless. As we are dealing with the problem of linear waves, we will start from a static situation corresponding to a parameter
 $m_0$ and perturb this state by considering the following parameter:
 \begin{equation} m(x,t) = m_0[1+ \varepsilon \cos(kx-\omega t)]. \end{equation}
In the following, we will resort to the usual partial and complete elliptic integrals (for any parameter  $m<1$) defined as
 \begin{gather} \operatorname{E}(\phi\, |\, m) = \int_0^{\phi} \sqrt{1-m\sin^{2}x}\,\mathrm{d}\kern0.7pt x,\quad \operatorname{E}(m) = \int_0^{{\rm \pi}/2} \sqrt{1-m\sin^{2}x}\,\mathrm{d}\kern0.7pt x, \end{gather}
 \begin{gather}\operatorname{F}(\phi\, |\, m) = \int_0^{\phi} \frac{\mathrm{d}\kern0.7pt x}{\sqrt{1-m\sin^{2}x}}, \quad \operatorname{K}(m) = \int_0^{{\rm \pi}/2} \frac{\mathrm{d}\kern0.7pt x}{\sqrt{1-m\sin^{2}x}}. \end{gather}
B.2. Curvatures in the V-shaped case
In the case of a V-shaped substrate, at order one in  $\varepsilon$, we have, after tedious calculations,
 \begin{align} \ell_{{\textit{c}}}\mathcal{H}(x,\phi,m_0,\alpha,t)&= \mathcal{H}^{0}(\phi,m_0) + \varepsilon\cos (kx-\omega t) \nonumber\\ &\quad\times [\mathcal{H}^{1,0}(\phi,m_0) + \mathcal{H}^{1,1}(\phi,m_0,\alpha)k^{2} ] + \mathscr{O}(\epsilon^{2}), \end{align}
with
 \begin{equation} \mathcal{H}^{0}(\phi, m_0) = \sqrt{\frac{1-m_0\sin^{2}\dfrac\phi 2}{m_0}}, \quad \mathcal{H}^{1,0}(\phi,m_0)=\frac{-1}{2{m_0}^{3/2}\sqrt{1-m_0\sin^{2}\dfrac\phi 2}}. \end{equation}
The first term  $\mathcal {H}^{0}(\phi )$ corresponds to the static curvature
 $(\ell _{{\textit{c}}}/2 )\kappa ^{\textit{t}}(\phi ,m_0)$ of the interface at rest. The second term
 $\mathcal {H}^{1,0}(\phi )$ gives the non-dispersive contribution of the dispersion relation, namely the function
 $b(m)$ (with some prefactor) in Pham et al. (Reference Pham, Perrard and Le Doudic2020). Note that they are independent of the angle
 $\alpha$. The last quantity
 $\mathcal {H}^{1,1}$ will yield the first dispersive correction to the dispersion relation. It reads
 \begin{equation} \mathcal{H}^{1,1}(\phi,m,\alpha) = \frac{1}{8 {m}^{3/2}(1-m)}[\mathcal{A}_V(\phi,m,\alpha)\cos\phi + \mathcal{B}_V(\phi,m,\alpha) \sin\phi],\end{equation}
with
 \begin{align} \mathcal{A}_V(\phi,m,\alpha) &= 4 (1-m) \left(\frac{1}{\sqrt{1-m\sin^{2}\dfrac\alpha 2}}-\frac{1}{\sqrt{1-m\sin^{2}\dfrac\phi 2}}\right)\nonumber\\ &\quad + \tan\alpha\left\{\frac{ (m-2) m \sin\alpha}{\sqrt{1-m\sin^{2}\dfrac\alpha 2}} +2(1-m) \left[ \operatorname{F}\left(\left.\frac{2{\rm \pi}-\alpha}{2}\right|m\right)- \operatorname{F}\left(\left.\frac{\alpha}{2}\right|m\right)\right]\right.\nonumber\\ &\quad \left.+\,(2-m) \left[\operatorname{E}\left(\left.\frac{\alpha}{2}\right|m\right) - \operatorname{E}\left(\left.\frac{2{\rm \pi} -\alpha}{2}\right|m\right)\right]\right\} \end{align}
and
 \begin{align} \mathcal{B}_V(\phi,m,\alpha) &= 4 (m-1) \left[\operatorname{K}(m) - \operatorname{F}\left(\left.\frac{\phi}{2}\right|m\right)\right] +2 (m-2)\left[ \operatorname{E}\left(\left.\frac{\phi}{2}\right|m\right) - \operatorname{E}(m)\right] \nonumber\\ &\quad +\frac{ (2m-m^{2}) \sin\phi}{\sqrt{1-m\sin^{2}\dfrac\phi 2}}. \end{align}
We have the following asymptotics: for  $m\to 0$ (nearly circular section)
 \begin{equation} \mathcal{H}^{1,1}(\phi,m,\alpha)\underset{m\to 0 }{=} \frac{1}{8 \sqrt{m}} \left[ 1-\frac{\cos\phi}{\cos\alpha}\right] +\mathscr{O}(m^{3/2}), \end{equation}
and for  $m=1-\mu \to 1$ (flattened section)
 \begin{equation} \mathcal{H}^{1,1}(\phi,m=1-\mu,\alpha)\underset{\mu\to 0 }{=} \frac{1}{4\mu}[|{\sin\phi}| - \tan\alpha \cos\phi]+\mathscr{O}(\mu^{0}). \end{equation}
The function  $\mathcal {H}^{1,1}$ is depicted in figure 13 for two different angles
 $\alpha$ and various parameters
 $m$ together with the asymptotic expressions (B19) and (B20).
The V-shaped channel case. Plots of  $\mathcal {H}^{1,1}(\phi ,m,\alpha )$ for different
 $m$ (arbitrary vertical units) with respect to angle
 $\phi \in [\alpha ,2{\rm \pi} -\alpha ]$, for (a)
 $\alpha = {{\rm \pi} }/{30}$ and (b)
 $\alpha = {3{\rm \pi} }/{8}$. As
 $\alpha$ approaches
 ${\rm \pi} /2$, the loci of the maxima approach
 ${\rm \pi}$.

In the limit  $m\to 1$, in the interval
 $\phi \in [\alpha ,{\rm \pi} ]$, the function
 $\mathcal {H}^{1,1}$ reaches its maximum at
 $\phi _{max}={\rm \pi} /2 + \alpha$; hence its maximum is located in the upper neighbourhood of the tip of the drop for low angles
 $\alpha$, whereas it is located near the top of the drop for
 $\alpha$ approaching
 ${\rm \pi} /2$. Last, we have
 \begin{equation} \mathcal{H}^{1,1}(\phi_{\textit{max}}) = \frac{1}{4\mu \cos\alpha},\quad \mathcal{H}^{1,1}({\rm \pi}) = \frac{\tan\alpha}{4\mu}. \end{equation}
B.3. Curvatures in the L-shaped case
In the case of an L-shaped substrate, after even more tedious calculations, we can compute the mean curvature of the interface  $\mathcal {H}$. Its expression is the same as in the V-shaped case (B14), with
 $\mathcal {H}^{0}$ and
 $\mathcal {H}^{1,0}$ given by (B15). As for
 $\mathcal {H}^{1,1}$, it reads
 \begin{equation} \mathcal{H}^{1,1}(\phi,m,\alpha) =\frac{{1}}{8\, m^{3/2}}[\mathcal{A}_L(\phi,m,\alpha)\cos\phi - \mathcal{B}_L(\phi,m,\alpha) \sin\phi], \end{equation}
with
 \begin{align} \mathcal{A}_L(\phi,m,\alpha) &= {\frac{4}{\sqrt{1-m\sin^{2}\dfrac\phi 2}}} + \sqrt{2}\sin^{2}\alpha \left(\frac{1}{\sqrt{1-m\sin^{2}\dfrac{{\rm \pi}-2\alpha}{4}}} -\frac{{1}}{\sqrt{1-m\sin^{2}\dfrac\alpha 2}} \right) \nonumber\\ &\quad +\frac{2-m}{1-m}\sin 2 \alpha\left[\frac{m}{2}\left( \frac{ \cos \alpha} {\sqrt{1-m\sin^{2}\dfrac{{\rm \pi}-2\alpha}{4}}} +\frac{\sin\alpha} {\sqrt{1-m\sin^{2}\dfrac\alpha 2}}\right)\right. \nonumber\\ &\quad \left.+ \operatorname{E} \left(\left.\frac{2{\rm \pi} -\alpha}{2}\right|m\right) - \operatorname{E}\left(\left.\frac{{\rm \pi}-2\alpha}{4}\right|m\right)\right] \nonumber\\ &\quad -2 \sin 2 \alpha \left[\operatorname{F}\left(\left.\frac{{\rm \pi}-2\alpha}{4}\right|m\right)-\operatorname{F}\left({\rm \pi} -\left.\frac{\alpha}{2}\right|m\right)\right] \end{align}
and
 \begin{align}
\mathcal{B}_L(\phi,m,\alpha) &= \frac{2-m}{1-m}\!\left\{
m\!\left( -\frac{ \sin ^{3}\alpha } { \sqrt{1-m \sin
^{2}\dfrac{\alpha}{2}}} +\frac{ \cos ^{3}\alpha } {
\sqrt{1-m\sin^{2}\dfrac{{\rm \pi}-2\alpha}{4}}} {-\frac{ \sin
\phi} { \sqrt{1-m\sin^{2}\dfrac\phi 2}}} \right)\right.
\nonumber\\ &\quad+\left. 2\left[ -{ \cos ^{2}\alpha
\operatorname{E}\left(\left.\frac{{\rm \pi}-2\alpha}{4} \right|m\right)} -{ \sin
^{2}\alpha
\operatorname{E}\left({\rm \pi}-\left.\frac{\alpha
}{2}\right|m\right)} +{
\operatorname{E}\left(\left.\frac{\phi}{2}\right|m\right)}
\right]\vphantom{{\sin ^{3}\alpha } { \sqrt{1-m \sin
^{2}\dfrac{\alpha}{2}}}}\right\} \nonumber\\ &\quad + \sin 2
\alpha\left[m\left( -\frac{
2\sin^{2}\dfrac{{\rm \pi}-2\alpha}{4} }
{\sqrt{1-m\sin^{2}\dfrac{{\rm \pi}-2\alpha}{4}}} +\frac{
2\sin^{2}\dfrac\alpha 2 }{\sqrt{1-m\sin^{2}\dfrac\alpha
2}}\right)\right.\nonumber\\
&\quad+\left.2\left(-\sqrt{1-m\sin^{2}\frac{{\rm \pi}-2\alpha}{4}}
+\sqrt{1-m\sin^{2}\frac\alpha 2}\right)\vphantom{{
2\sin^{2}\dfrac{{\rm \pi}-2\alpha}{4} }
{\sqrt{1-m\sin^{2}\dfrac{{\rm \pi}-2\alpha}{4}}}}\right]\nonumber\\
&\quad +4 \left[\cos ^{2}\alpha
\operatorname{F}\left(\left.\frac{{\rm \pi}-2\alpha}{4}\right|m\right)
+ \sin^{2}\alpha
\operatorname{F}\left(\left.\frac{2{\rm \pi} -\alpha }{2}\right|m\right) -
\operatorname{F}\left(\left.\frac{\phi}{2}\right|m\right)\right].
\end{align}
We have the following asymptotics: for  $m\to 0$ (nearly circular section)
 \begin{equation} \mathcal{H}^{1,1}(\phi, m, \alpha)\underset{m\to 0}{=}\frac{1-\sin (\alpha +\phi )-\cos (\alpha +\phi )}{8 \sqrt{m}}+\mathscr{O}(\sqrt{m}), \end{equation}
and for  $m=1-\mu \to 1$ (flattened section)
 \begin{align} \mathcal{H}^{1,1}(\varphi,m=1-\mu, \alpha) \underset{\mu\to 0}{=} \frac{1}{4\mu}[ \sin 2\alpha\cos\varphi - (1\pm\cos 2\alpha)|{\sin\varphi}|],\quad\text{for }\varphi\gtrless{\rm \pi}. \end{align}
For both asymptotics, as expected, we recover the results of the V-shaped case at angle  $\alpha ={\rm \pi} /4$. Figure 14 shows illustrations of the skewed distribution of the curvature
 $\mathcal {H}^{1,1}$ with respect to
 $\phi$. The skewness is strong at low angle
 $\alpha$, as
 $m\to 1$.
The L-shaped substrate case. Plots of  $\mathcal {H}^{1,1}(\phi ,m,\alpha )$ for different
 $m$, with respect to angle
 $\phi \in [{\rm \pi} /2-\alpha ,2{\rm \pi} -\alpha ]$ (arbitrary vertical units) for (a) angle
 $\alpha = {\rm \pi}/30$ and (b) angle
 $\alpha = {\rm \pi}/6$.

B.4. Section-averaged pressure in the V-shaped case
We now turn to the question of the pressure term. The Saint-Venant equations are based on an averaging of the gradient of the hydrostatic pressure field. We will here focus on the V-shaped case.
As we need to compute
 \begin{equation} \langle\partial_x p\rangle (x,t) = \frac{1}{S(x,t)}\int_{S(x,t)}\partial_x p(x,y,z,t)\, \mathrm{d} y\, \mathrm{d} z, \end{equation}
with  $p(x,y,z,t)$ given by (B10), we will then start by computing
 \begin{equation} \partial_x p(x,y,z,t)=\rho g\ell_{{\textit{c}}} \frac{\partial}{\partial x} \left[ \frac{\tilde\zeta[\phi,m(x,t)]}{\ell_{{\textit{c}}}} + \ell_{{\textit{c}}} \kappa[\phi,m(x,t)]\right], \end{equation}
using (B3) and (B4), with  $m(x,t) = m_0[1+\varepsilon \cos (kx-\omega t)]$ (we recall that, here,
 $x$ is dimensionless; it has been renormalised in
 $\ell _{{\textit{c}}}$ units), so that we find
 \begin{align} &\frac{\tilde\zeta[\phi,m(x,t)]}{\ell_{{\textit{c}}}} + \ell_{{\textit{c}}} \kappa[\phi,m(x,t)] \nonumber\\ &\quad= \frac 2{m_0^{3/2}} \sqrt{1-m_0\sin^{2}\frac \alpha 2}\nonumber\\ &\qquad + \frac{\tan\alpha}{2m_0^{3/2}} \left\{ (2-m_0) \left[\operatorname{F}\left(\left.\frac{2{\rm \pi}-\alpha}{2}\right|m_0\right)- \operatorname{F}\left(\left.\frac\alpha 2\right|m_0\right)\right]\right.\nonumber\\ & \qquad-\left.2\left[ \operatorname{E}\left(\left.\frac{2{\rm \pi}-\alpha}{2}\right|m_0\right)- \operatorname{E}\left(\left.\frac\alpha 2\right|m_0\right)\right] \right\} \nonumber\\ &\qquad +\varepsilon \cos (kx-\omega t)[ b_{{\textit{eff}}}(m_0,\alpha)] \nonumber\\ &\qquad + 2\varepsilon k^{2}\cos (kx-\omega t)[ \mathcal{H}^{1,1}(\phi,m_0,\alpha)] + {{\mathscr{O}(\varepsilon^{2})}}, \end{align}
with
 \begin{align} &
b_{{\textit{eff}}}(m_0,\alpha) \nonumber\\
&\quad=\frac{-1}{{m_0^{3/2}}\sqrt{1-m_0\sin^{2}\dfrac\alpha
2}} + \frac{\tan\alpha}{4} \left[\frac{(2-m_0)
\sin\alpha}{m_0^{1/2}(1-m_0)\sqrt{1-m_0\sin^{2}\dfrac\alpha
2}}\right.\nonumber\\ &\qquad +\left. \frac{(2-m_0)\left[\operatorname{E}\left(\left.\dfrac{2{\rm \pi}-\alpha}{2}\right|m_0\right)
-\operatorname{E}\left(\left.\dfrac\alpha
2\right|m_0\right)\right] +2 (1-m_0)
\left[\operatorname{F}\left(\left.\dfrac\alpha
2\right|m_0\right)-\operatorname{F}\left(\left.\dfrac{2{\rm \pi}-\alpha}{2}\right|m_0\right)\right]}{(1-m_0)
m_0^{3/2} } \right].
\end{align}
All the terms of order  $k^{0}$ are independent of the variable
 $\phi$ and remain the same after an averaging in the section
 $S(x,t)$. Those terms yield the non-dispersive dispersion relation found by Pham et al. (Reference Pham, Perrard and Le Doudic2020).
We will now focus on the averaged value of  $\mathcal {H}^{1,1}$ over the section
 $S(x,t)$ and we will first discuss its definition. The function
 $\mathcal {H}^{1,1}$ is a function that is defined not in the interior of
 $S(x,t)$ but along its free interface. The presence of the
 $\mathcal {H}^{1,1}$ term stems from the capillary pressure term. Under the adiabatic hypothesis, the definition of the pressure field as a hydrostatic field is actually ill-posed, for it is multivalued in the region of coordinates
 $y$ where the interface has two values (that is, in the neighbourhood of both tips of the section), because of the presence of the longitudinal curvature
 $\kappa ^{\textit{l}}\equiv \mathcal {H}^{1,1}/\ell _{{\textit{c}}}$, which differs at the two corresponding angles
 $\phi$. By neglecting
 $\mathcal {H}^{1,1}$ in the non-dispersive regime, this problem was circumvented by Pham et al. (Reference Pham, Perrard and Le Doudic2020) (see the discussion above (3.14) in that reference).
In the following, we will use the quantity  $\varLambda _{{\textit{c}}}$ defined, in the
 $\mu =1-m\to 0$ limit, as
 \begin{equation} \varLambda_{{\textit{c}}}(\mu=1-m) \underset{\mu\to 0}{\simeq}\ell_{{\textit{c}}}[-\log\mu+4(\log 2-1)]. \end{equation}
It corresponds to the wetting length of a sessile cylinder on a horizontal superhydrophobic substrate. The height of such a cylinder is given by
 \begin{equation} D(\mu)\underset{\mu\to 0}{\simeq}2\ell_{{\textit{c}}}(1-\sqrt\mu) \end{equation}
(see Pham et al. Reference Pham, Perrard and Le Doudic2020, p. 9). Symbolically, the section-averaged term is supposed to be of the form
 \begin{equation} \langle \mathcal{H}^{1,1}\rangle = \frac{1}{S(x,t)}\iint_{S(x,t)} \mathcal{H}^{1,1} \,\mathrm{d} y\,\mathrm{d} z. \end{equation}
As a relevant geometrical ansatz of the section  $S(x,t)$, we will consider the drop as two trapezoidal parts, the free interface being flat, the capillary cap being a rectangle of width
 $W=\varLambda _{{\textit{c}}}(\mu )$ and height
 $D(\mu )$ and the liquid part in contact with the substrate being a symmetrical V-shaped triangle of angle
 $\alpha$ and height
 $(W\tan \alpha )/2$. Because of the symmetry, we will only consider half of the domain (see figure 15). The interface will be travelled from the right to the left, parametrised by the angle
 $\varphi$, from
 $\varphi =\alpha$ to
 $\alpha ={\rm \pi}$. Note that considering a simpler ansatz only consisting of a sole triangular section would have eventually yielded results in complete disagreement with the experimental measurements. The geometrical ansatz we chose to consider contains the minimum features to account for the experimental results.
Shape of half of the sessile drop on a V-shaped substrate, for  $\mu =5\times 10^{-5}$ and
 $\alpha = 20^{\circ }$ (in blue), along with the corresponding trapezoidal ansatz. We have
 $D=2\ell _{{\textit{c}}}(1-\sqrt \mu )$ and
 $W=\varLambda _{{\textit{c}}}$. The flat horizontal interface is travelled from the right to the left, for a parameter
 $\phi$ ranging from
 $\alpha$ to
 ${\rm \pi}$. The figure is scaled in
 $\ell _{{\textit{c}}}$ units.

Therefore, the section-averaged term reads
 \begin{equation} \langle \mathcal{H}^{1,1}\rangle(\mu,\alpha) = \frac{1}{S(x,t)} \int_{\varphi=\alpha}^{\varphi={\rm \pi}} \mathrm{d} \varphi \times\{\text{height of liquid at } y(\varphi)\}\times\{\mathcal{H}^{1,1} (\varphi)\}, \end{equation}
which yields the following expression, when using (B26):
 \begin{align} &\langle \mathcal{H}^{1,1}\rangle(\mu, \alpha)\nonumber\\ &\quad =\frac{ \left[\dfrac{1}{2} \varLambda_{{\textit{c}}}(\mu) \tan ^{2}\alpha +\dfrac{1}{2} ({\rm \pi}-\alpha) \varLambda_{{\textit{c}}}(\mu) \tan \alpha +2\ell_{{\textit{c}}} ({\rm \pi} -\alpha ) (1- \sqrt{\mu }) \left(1+\dfrac{1}{\cos\alpha}\right)\right] } {[ \varLambda_{{\textit{c}}}(\mu) \tan \alpha + 8 \ell_{{\textit{c}}}(1-\sqrt{\mu })]({\rm \pi} -\alpha )^{2} \mu }. \end{align}
B.5. Effective surface tension in the V-shaped case
Following the notation used in Pham et al. (Reference Pham, Perrard and Le Doudic2020), let us formally rewrite the dispersion relation as
 \begin{equation} \omega^{2}=a_{{\textit{eff}}}(m_0,\alpha)[b_{{\textit{eff}}}(m_0,\alpha) k^{2} + d_{{\textit{eff}}}(m_0,\alpha) \ell_{{\textit{c}}}^{2}k^{4}], \end{equation}
with  $a_{{\textit{eff}}}$ stemming from the continuity equation and
 $b_{{\textit{eff}}}$ stemming from the momentum equation and given by (B30). Those two terms yield the non-dispersive term so that we have
 $c_{{\textit{eff}}}^{2}=a_{{\textit{eff}}}b_{{\textit{eff}}}$. Last,
 $d_{{\textit{eff}}}=2\langle \mathcal {H}^{1,1}\rangle$ yields the dispersive contributions. We know that the dispersion relation reads
 $\omega ^{2}=(g_{{\textit{eff}}}\,k +({\sigma _{{\textit{eff}}}}/{\rho }) k^{3})\varPsi (({c_{{\textit{eff}}}^{2}}/{g_{{\textit{eff}}}}) k)$. In the case of the Saint-Venant expansion we are performing, the dispersion relation is an expansion of the dispersion relation obtained by considering
 $\varPsi (\xi )\equiv \xi$, and dropping the higher-order terms, as stated in Appendix A. This yields
 \begin{equation} \omega^{2}=c_{\textit{eff}}^2\, k^2 +\frac{c_{{\textit{eff}}}^{2}}{g_{{\textit{eff}}}} \frac{\sigma_{{\textit{eff}}}}{\rho} k^{4}, \end{equation}
so that we can identify  $\sigma _{{\textit{eff}}}$ from (B36) and (B37) as
 \begin{equation} \sigma_{{\textit{eff}}} = a_{{\textit{eff}}}(m_0,\alpha) d_{{\textit{eff}}}(m_0,\alpha) \frac{\rho}{g_{{\textit{eff}}}c_{{\textit{eff}}}^{2}}\ell_{{\textit{c}}}^{2}, \end{equation}
while  $g_{{\textit{eff}}}=g\sin \alpha$,
 $\ell _{{\textit{c}}}^{2}=\sigma /(\rho g)$ and
 $c_{{\textit{eff}}}^{2}=a_{{\textit{eff}}}(m_0,\alpha ) b_{{\textit{eff}}}(m_0,\alpha )$. Therefore, we obtain
 \begin{equation} \sigma_{{\textit{eff}}} = { \frac {{ 2} \sin\alpha\,\langle \mathcal{H}^{1,1} \rangle} {b_{{\textit{eff}}}(m_0,\alpha)} }\sigma. \end{equation}
A few numerical values are given in table 1 and compared with the experimental results obtained by fitting the spectra using the dispersion relation (1.1) (see figure 3). As can be seen in the case of the V-shaped substrate at different volumes, the values of  $\sigma _{{\textit{eff}}}$ from our toy model are slightly sensitive to the parameter
 $\mu$. These values undershoot the experimental values with an error of 15 %, which is satisfactory, given the approximations we made.
Note that if, at fixed  $\alpha$ and fixed
 $\mu$, we had chosen a uniform distribution of curvature along the interface, with the value of
 $\mathcal {H}^{1,1}(\phi )$ set at
 $\mathcal {H}^{1,1}(\phi _{max})$ (see (B21)), we would have obtained
 $\sigma _{{\textit{eff}}} = \sigma =72$ mN m
 $^{-1}$. Because of the non-uniform distribution of curvature along the curved interface, we have a renormalisation effect of the surface tension.
We have tested the dependence on the angle  $\alpha$ at fixed
 $\mu =10^{-6}$ and computed the numerical value of
 $\sigma _{{\textit{eff}}}$. The results can be found in table 3. The effective surface tension value grows with the angle
 $\alpha$ up to a value of
 $60.1$ mN m
 $^{-1}$, then, past
 $70^{\circ }$, it slowly decreases. One would have expected to find a monotonic behaviour, with
 $\sigma _{{\textit{eff}}}$ increasing up to 72 mN m
 $^{-1}$ as
 $\alpha$ approaches
 $90^{\circ }$: the substrate resembles a substrate with vertical walls, the curvature is maximum almost at the top of the drop. Moreover, the curvature is close to this maximum value in a wide region of almost flat interface. The averaged value of
 $\mathcal {H}^{1,1}$ should be really close to this maximum value. The choice of our ansatz is not suited for such a situation but still yields a fair value, with an error of 20 %.
Estimation of the dependence on the angle  $\alpha$ of the effective surface tension
 $\sigma _{{\textit{eff}}}$ via the toy model, at fixed
 $\mu =1-m=10^{-6}$, in the case of a V-shaped substrate. At angles
 $\alpha$ approaching
 $90^{\circ }$, one expects to recover the usual surface tension value
 $\sigma =72$ mN m
 $^{-1}$. The toy model is only suited for small angles
 $\alpha$.

In order to be accurate, we need to solve the full hydrodynamics equations through numerical calculations such as those based on the Ritz method (see e.g. Segel & Handelman Reference Segel and Handelman1987; Bostwick & Steen Reference Bostwick and Steen2018). This will be left for future work.
B.6. Effective surface tension in the L-shaped case
In our toy model, the effective surface tension is given by (B39) in the V-shaped case. It depends on the section-averaged value of the curvature distribution  $\mathcal {H}^{1,1}$ given by (B26). In the L-shaped case,
 $\mathcal {H}^{1,1}$ is defined along two intervals
 $[{\rm \pi} /2-\alpha , {\rm \pi}]$ and
 $[{\rm \pi} , 2{\rm \pi} -\alpha ]$, along which it has the shape of a sinusoidal arch, as in the V-shaped cases.
In the case of an L-shaped substrate, the shape of the capillary cap on the left-hand side ( $\varphi \in [{\rm \pi} , 2{\rm \pi} -\alpha ]$) corresponds to half a capillary cap in the V-shaped case at angle
 $\alpha$. In contrast, the capillary cap shape on the right-hand side (
 $\varphi \in [{\rm \pi} /2-\alpha , {\rm \pi}]$) corresponds to half a capillary cap in the V-shaped case at angle
 ${\rm \pi} /2-\alpha$. We will then use a geometrical ansatz of the actual system, by considering the capillary cap as a rectangle of width
 $W=\varLambda _{{\textit{c}}}(\mu )$ and height
 $D=2\ell _{{\textit{c}}}(1-\sqrt {\mu })$, placed upon a wedge of angles with the horizontal equal to
 $\alpha$ and
 $\beta ={\rm \pi} /2-\alpha$. The domain will then be split into three trapezoidal parts (see figure 16).
Shape of the capillary cap in blue, in the case of an L-shaped substrate, with a tilt angle  $\alpha =25^{\circ }$ and a geometric parameter
 $\mu =1-m=10^{-5}$ in
 $\ell _{{\textit{c}}}$ units. The ansatz of the section is given by a rectangle of width
 $W=\varLambda _{{\textit{c}}}(\mu )$ and height
 $D=2\ell _{{\textit{c}}}(1-\sqrt {\mu })$, on top of an L-shaped wedge of width
 $W$. The section can be partitioned into three trapezoids
 $S_1,\ S_2$ and
 $S_3$. The effective tension is calculated as the average of the values of the surface tension found in the V-shaped case (
 $\sigma _{{\textit{eff}}}^{V}$, see text).

In the following, instead of performing tedious calculations of  $\langle \mathcal {H}^{1,1}\rangle$ and
 $b_{{\textit{eff}}}$ counterpart in the L-shaped case, we will choose ad hoc effective values of the surface tension at the free interface of each part
 $S_i\ (1\leq i\leq 3)$. For the left-hand part
 $S_1$, of horizontal width equal to
 $W/2$, the surface tension will have the value
 $\sigma _1=\sigma _{{\textit{eff}}}^{V}(\alpha )$ given by our toy model for the same angle
 $\alpha$ as in the V-shaped case. In the two other parts
 $S_2$ and
 $S_3$, we will choose the value of
 $\sigma _2=\sigma _3=\sigma _{{\textit{eff}}}^{V}(\beta ,\mu )$ for an angle equal to
 $\beta ={\rm \pi} /2-\alpha$ (again, as in the V-shaped case). The resulting value
 $\sigma _{{\textit{eff}}}^{L}(\alpha ,\mu )$ we are looking for will be the averaged value with respect to the sections, namely
 \begin{equation} \sigma_{{\textit{eff}}}^{L} (\alpha,\mu) = \frac{\mathcal{A}(S_1)\sigma_{{\textit{eff}}}^{V}(\alpha,\mu) + \mathcal{A}(S_2\cup S_3) \sigma_{{\textit{eff}}}^{V}\left(\dfrac{\rm \pi} 2-\alpha,\mu\right)} {\mathcal{A}(S_1\cup S_2 \cup S_3)}, \end{equation}
where  $\mathcal {A}$ denotes the sectional area of a part, so that
 \begin{gather} \mathcal{A}(S_1) = \tfrac 12 W (D+\tfrac 14 W \tan\alpha), \end{gather}
 \begin{gather}\mathcal{A}(S_1\cup S_2\cup S_3) = W (D+\tfrac 14 W \sin 2\alpha). \end{gather}
A few numerical values are given in table 2 as a comparison with the experiments. The experimental values were obtained by fitting the spectra with the dispersion relation (1.1) (see figure 4). The agreement happens to be good, the error being less than 10 %. Note that the dependence on  $\alpha$ of the experimental values of
 $\sigma _{{\textit{eff}}}$ are not monotonic, contrary to the values given by the toy model. As in the V-shaped case, some experimental variabilities were encountered, which may be due to the aging of the substrate coating or the hysteresis of the contact angle.