Implications
Dietary P concentration can greatly affect pig’s growth performance and diet cost. Current NRC (2012) recommendations for digestible P need to be updated for nursery pigs with modern genetics and commercial diets. This study characterized the dose-response to increasing digestible P in diets without or with a high dose of phytase for 6 to 13 kg pigs. Results suggested that P requirement varied depending on the response criteria (e.g., growth rate, feed efficiency or bone ash concentration), statistical models and the addition of phytase. The requirement estimates and response equations developed from this study can be used to determine the optimum P feeding concentrations based on local production considerations.
Introduction
Phosphorus is the second most abundant mineral in the animal body after Ca, and its dietary concentration greatly affects pig’s growth performance, environmental impact and diet cost. The NRC (2012) estimates the standardized total tract digestible (STTD) P requirement of nursery pigs using a simple regression method based on a limited amount of published studies; thus, empirical data are needed to validate these STTD P requirement estimates. In a recent dose titration study, Vier et al. (Reference Vier, Wu, Dritz, Tokach, Goncalves, Orlando, Woodworth, Goodband and DeRouchey2017a) reported that feeding STTD P concentrations above the NRC (2012) requirement estimate improved growth performance and percentage bone ash in 11 to 25 kg nursery pigs. However, to our knowledge, limited research has been published that investigated the STTD P requirement of early nursery pigs from weaning to 13 kg BW.
Phytase is commonly added to the diet of pigs to increase the availability of phytate-bound P. Feeding high doses of phytase also promoted the growth performance of nursery pigs (Walk et al., Reference Walk, Srinongkote and Wilcock2013; Zeng et al., Reference Zeng, Li, Tian, Zhao, Xu, Yu and Piao2015; Patience et al., Reference Patience, Gould, Koehler, Corrigan, Elsbernd and Holloway2015) by reducing the anti-nutritional effects of phytate and increasing the availability of amino acids, trace minerals and energy (Cowieson et al., Reference Cowieson, Wilcock and Bedford2011). It is possible that the faster growth rate of pigs and additional dietary energy released by phytase may, in turn, alter pigs’ nutrient requirements. Therefore, there is an increasing interest in determining the dietary STTD P requirement of pigs fed diets containing phytase. The objective of this study was to determine the effects of increasing STTD P concentration in diets without or with high levels (2000 phytase units; FYT/kg) of phytase on the growth performance and percentage bone ash of nursery pigs from 6 to 13 kg BW.
Material and methods
All experimental procedures in this study were approved by the Kansas State University Institutional Animal Care and Use Committee (Manhattan, KS).
Diets and experimental design
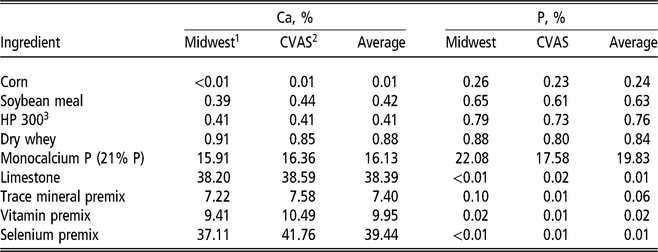
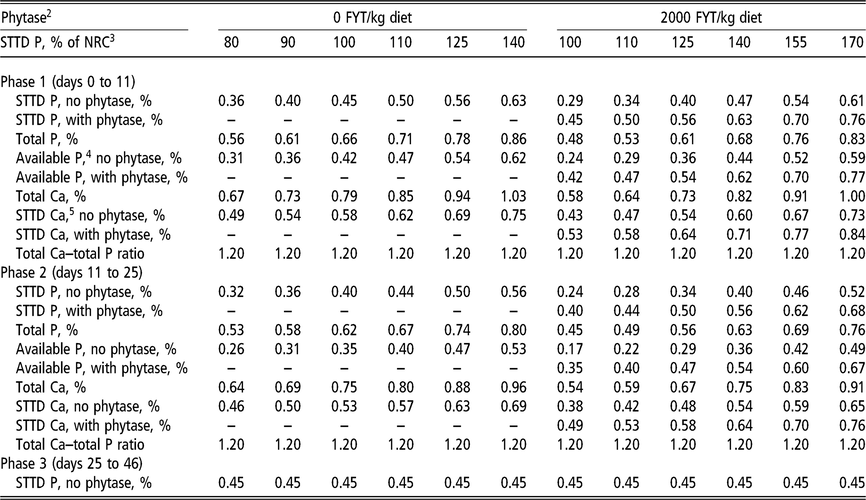
All ingredients that were used to manufacture the experimental diets containing Ca and P were sampled four times at the feed mill before the start of the study. Ingredient samples were sent to two labs (Ward Laboratories, Inc. Kearney, NE; Cumberland Valley Analytical Services Inc., Maugansville, MD) for the analysis of Ca and P in duplicate (Table 1). The average of 16 lab results for each sampled ingredient was used in the diet formulation. All diets were manufactured at a commercial feed mill (Kalmbach Feeds, Inc., Upper Sandusky, OH) following the same standard procedure for each treatment. The dietary treatments were arranged in two dose titrations with six levels of STTD P in diets that contained either 0 or 2000 FYT/kg of a novel microbial phytase from Citrobacter braakii expressed in Aspergillus oryzae (Ronozyme HiPhos 2500; DSM Nutritional Products, Inc., Parsippany, NJ). The STTD P levels were expressed as a percentage of the NRC (2012) requirement estimates (% of NRC) because two feeding phases were involved during the designated weight range, with different STTD P levels (0.45% and 0.40%, respectively) being recommended for 5 to 7, and 7 to 11 kg BW pigs (Table 16-1A; NRC, 2012). For diets without phytase, the experimental STTD P levels were: 80%, 90%, 100%, 110%, 125% and 140% of NRC, corresponding to 0.36%, 0.40%, 0.45%, 0.50%, 0.56% and 0.63% STTD P in phase 1 diets and 0.32%, 0.36%, 0.40%, 0.44%, 0.50% and 0.56% of STTD P in phase 2 diets (Table 2). For diets containing phytase, the experimental STTD P levels were: 100%, 110%, 125%, 140%, 155% and 170% of NRC; these STTD P levels included the manufacturer’s suggested release value of 0.158% STTD P and 0.105% STTD Ca for 2000 FYT/kg phytase in corn–soybean meal-based swine diets. Thus, STTD P levels corresponded to 0.45%, 0.50%, 0.56%, 0.63%, 0.70%, and 0.76% STTD P in phase 1 diets and 0.40%, 0.44%, 0.50%, 0.56%, 0.62% and 0.68% STTD P in phase 2 diets. The phytase-containing diets with the lowest STTD P dose (100% of NRC) were formulated with negligible (0.02%) amounts of inorganic P source. Phase 1 diets (Supplementary Table S1) were offered from days 0 to 11 and phase 2 diets (Supplementary Table S2) were offered from days 11 to 25. A common phase 3 diet containing 0.45% STTD P was then fed to all pigs from days 25 to 46. Ingredient loading values, standardized ileal amino acid digestibility coefficients and STTD coefficients for P were obtained from NRC (2012) for each ingredient. Diets were formulated to contain similar net energy and amino acid concentrations within phase. All diets were balanced for a total Ca–total P ratio of 1.20 : 1. Phase 1 diets were pelleted, and phases 2 and 3 diets were provided in meal form.
Analyzed Ca and P concentrations in swine feed ingredients (as-fed basis)

1 Midwest Laboratories (Omaha, NE); four samples per ingredient were analysed in duplicates and average values are reported.
2 Cumberland Valley Analytical Services Inc. (Maugansville, MD); four samples per ingredient were analysed in duplicates and average values are reported.
3 Enzymatically treated soy product (Hamlet Protein, Inc., Findlay, OH).
Swine dietary treatment structure (as-fed basis)1

STTD = standardized total tract digestible.
1 A total of 1080 barrows and gilts (PIC 280 × 1050, Hendersonville, TN) with an initial BW of 5.9 ± 1.08 kg were used in a 46-day trial with 10 pigs per pen and 9 replications (pen) per treatment to determine the effects of increasing STTD P concentrations in diets without and with phytase on growth performance and percentage bone ash.
2 Ronozyme HiPhos 2500; FYT/kg = phytase units.
3 Dietary STTD P levels expressed as a percentage of NRC (2012) requirement estimates. The NRC (2012) requirement estimates for nursery pigs from 5 to 7 kg and 7 to 11 kg are 0.45% and 0.40% STTD P, respectively. Therefore, treatment concentrations represented 80%, 90%, 100%, 110%, 125%, 140%, 155% and 170% of the NRC (2012) requirement.
4 Available coefficients of P content in feed ingredients are from NRC (1998).
5 Digestibility coefficients of Ca content are from Stein (Reference Stein2016).
Animals and housing
The study was conducted at the Cooperative Research Farm’s Swine Research Nursery (Kalmbach Feeds, Inc., Sycamore, OH). Each pen (1.52 × 1.83 m) had completely slatted metal floors and was equipped with a four-hole stainless steel feeder and a nipple-cup waterer. Five barrows and five gilts (PIC 280 × Camborough; Genus PIC, Hendersonville, TN) were housed in each pen and were allowed ad libitum access to feed and water throughout the experiment. Experimental diets were delivered in bags, weighed and added manually to the feeders.
A total of 1080 weaned pigs with an initial BW of 5.9 ± 1.08 kg were used in three rooms with 36 pens per room. Upon arrival, pigs were individually weighed and assigned to pens to achieve balanced pen weights within room. In each room, pens of pigs were allotted to 1 of 12 dietary treatments (nine replications per treatment) in a completely randomized manner. Pigs and feeders were weighed on days 0, 11, 25 and 46 to determine average daily gain (ADG), average daily feed intake (ADFI), and gain–feed ratio (G : F).
Bone ash analysis
At the end of treatment period (day 25), one median-weight gilt from each pen was euthanized using CO2 chamber, and the radius was collected. Bones were then transferred with dry ice to the Kansas State University Swine Laboratory, Manhattan, KS, and stored at −20°C until analysis. After thawing at room temperature (24°C) in plastic bags for 24 h, bones were autoclaved for 60 min; adhering tissue and cartilage caps were removed (without defatting), then dried at 105°C for 7 days. Dried radiuses were then ashed in a muffle furnace at 600°C for 24 h. Percentage bone ash was calculated as: bone ash (%) = ashed bone weight (g) / dried bone weight (g) × 100.
Chemical analysis
For each complete diet, subsamples were obtained from a minimum of six feeders during each week to form a composite sample. Diet samples were delivered to the Kansas State University Swine Laboratory and stored at −20°C until analysis. Ingredient and complete diet samples were analysed for DM, CP, Ca and P at Ward Laboratories, Inc. (Kearney, NE). Concentrations of Ca and P in complete diet samples were also analysed at Cumberland Valley Analytical Services Inc. (Maugansville, MD) and Midwest Laboratories (Omaha, NE) in duplicate. Diets containing phytase were submitted to DSM Technical Marketing Analytical Services Laboratory (Belvidere, NJ) for phytase analysis. The means of analysed nutrient values for complete diets are presented in Supplementary Tables S1 and S2. Standard procedures from AOAC (2006) were followed for the analysis of moisture (Method 934.01), CP (Method 990.03) and Ca and P (Method 985.01). At Cumberland Valley Analytical Services Inc. (Maugansville, MD), AOAC (2000) method (985.01) was used for Ca and P analyses, with modifications of ashing a 0.35 g sample for 1 h at 535°C, digestion in an open crucible for 20 min in 15% nitric acid on a hot plate, and sample dilution to 50 mL and analysis on an inductively coupled plasma spectrometer (PerkinElmer 3300 XL and 5300 DV ICP; PerkinElmer Inc., Shelton, CT).
Statistical analysis
Growth performance and bone ash data were analysed in a randomized complete block design using pen as the experimental unit and room as a random effect in all statistical models. Phytase and phytase × STTD P interaction effects were analysed in a 2 × 4 factorial treatment structure, with main effects of phytase (0 or 2000 FYT/kg) and STTD P levels (100%, 110%, 125% and 140% of NRC) that represented the dose treatments duplicated between the two titration sets. This analysis was conducted to determine the extra-phosphoric effect of feeding phytase on pig’s growth performance. Within each (without or with phytase) dose titration, the six STTD P doses were evaluated using single df linear and quadratic contrasts. Unequally spaced linear and quadratic contrast coefficients were derived using the IML procedure in SAS (version 9.4, SAS Institute Inc., Cary, NC). Statistical models accounting for heterogeneous residual variances were used when they improved model fit. All models were fit using the GLIMMIX procedure of SAS. Means were reported as least squares means and results were considered significant at P < 0.05 and marginally significant at 0.05 < P < 0.10.
Using procedures outlined by Gonçalves et al. (Reference Gonçalves, Bello, Dritz, Tokach, DeRouchey, Woodworth and Goodband2016), dose-response models were fit separately for each (without or with phytase) STTD P titration. Response criteria modeled were ADG, ADFI and G : F during the treatment period (days 0 to 25), as well as percentage bone ash. Competing statistical models included linear (LM), quadratic polynomial (QP), broken-line linear (BLL), and broken-line quadratic (BLQ). Dose-response models were compared based on the Bayesian information criterion (BIC), where the smaller the value, the better (Milliken and Johnson, Reference Milliken and Johnson2009). A decrease in BIC >3 was considered a significant improvement in fit. The 95% confidence interval of the estimated requirement to reach maximum performance or to reach plateau performance was computed. Results reported correspond to inferences yielded by the best fitting models.
Results
Diet analysis
Analyzed total P concentrations of dietary treatments were reasonably consistent with calculated levels and followed similar patterns as the designed treatment structure (Supplementary Tables S1 and S2). Analysis of total Ca was more variable than P, with analysed Ca–analysed P ratios in diets within an acceptable range from 1.1:1 to 1.6:1. This was expected because higher analytical variations within and among laboratories were often observed for Ca than P (Jones et al., Reference Jones, Woodworth, Vahl, Tokach, Goodband, DeRouchey and Dritz2018).
Growth performance
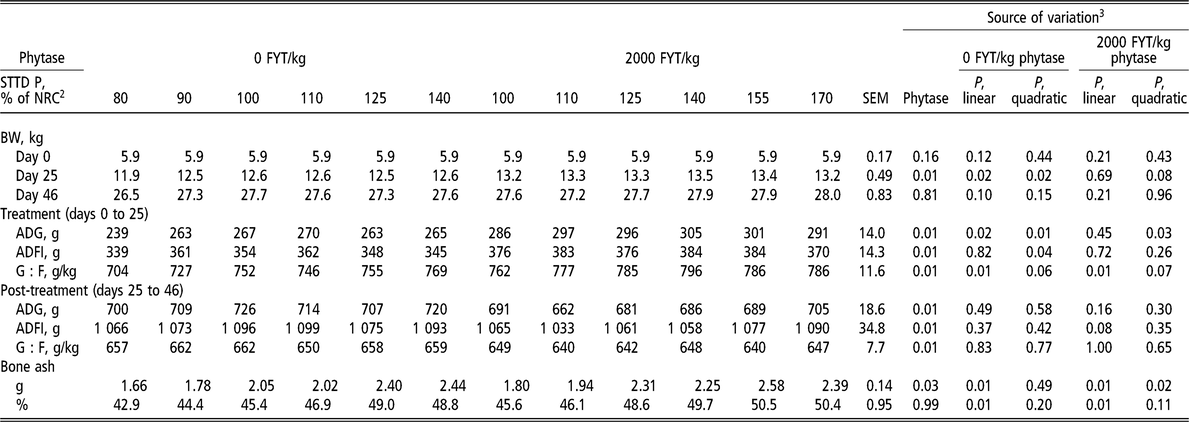
Phytase × STTD P interactions were assessed using the eight treatments with overlapping STTD P levels between the two dose titrations. No phytase × STTD P interactions were observed for any growth response or percentage bone ash except a tendency for ADG (P = 0.08) during the treatment period (days 0 to 25). This was the result of a linear increase (P < 0.05) in ADG for pigs fed increasing STTD P from 100% to 140% of NRC in diets containing phytase, but no evidence of difference for pigs fed diets without phytase (Table 3). Feeding phytase increased (P < 0.01) ADG from days 0 to 25 compared with diets without phytase, and the magnitude of this improvement enlarged as STTD P level increased from 100% to 140% of NRC. Due to this tendency for a phytase × STTD P interaction on ADG, STTD P requirements were modelled separately for diets without and with phytase.
Effects of STTD P and phytase on pig’s growth performance and percentage bone ash1

STTD = standardized total tract digestible; ADG = average daily gain; ADFI = average daily feed intake; G : F = gain–feed ratio; FYT/kg = phytase units.
1 A total of 1080 barrows and gilts (PIC 280 × 1050, Hendersonville, TN) with an initial BW of 5.9 ± 1.08 kg were used in a 46-day trial with 10 pigs per pen and 9 replications (pen) per treatment to determine the effects of increasing STTD P concentrations in diets without and with phytase on growth performance and percentage bone ash.
2 Dietary STTD P levels expressed as a percentage of NRC (2012) requirement estimates.
3 Phytase effect and P × phytase interaction were analysed in a 2 × 4 factorial with the main effects of P (100%, 110%, 125% or 140%) and phytase (0 or 2000 FYT/kg). No P × phytase interaction was observed for any response criteria (P>0.22) except for ADG of treatment period (P = 0.08), whereby ADG was increased (linear, P < 0.05) by increasing STTD P in diets containing phytase, but not in diets without phytase.
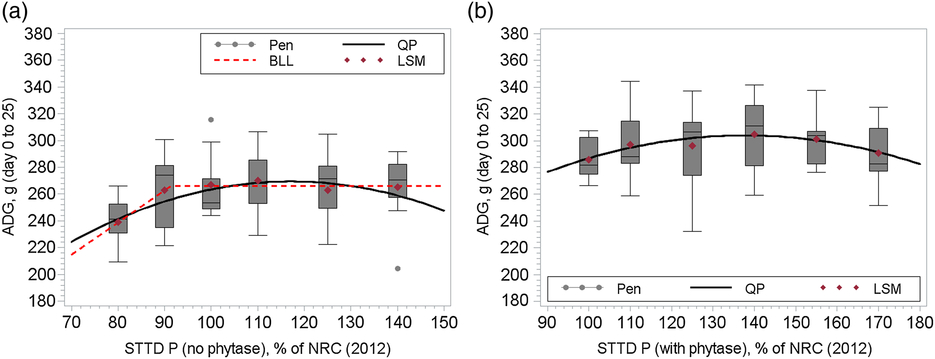
During the treatment period (days 0 to 25), increasing STTD P from 80% to 140% of NRC in diets without phytase increased ADG (quadratic, P < 0.01; Figure 1a) and day 25 BW (quadratic, P < 0.05). The best fitting models for ADG were QP and BLL. The QP model estimated that the maximum ADG was reached at 117% (95% CI 86% to >140%) of NRC and then decreased with greater STTD P, with 99% of maximum ADG achieved at 106% of NRC. The BLL model suggested that the ADG response plateaued at 91% (95% CI 76% to 107%) of NRC. When diets contained 2000 FYT/kg phytase, increasing STTD P from 100% to 170% of NRC increased ADG (quadratic, P < 0.05; Figure 1b) and tended to increase day 25 BW (quadratic, P = 0.08). The QP model estimated that ADG reached maximum at 138% (95% CI 110% to >170%) of NRC and then decreased with greater STTD P, with 99% of maximum ADG achieved at 122% of NRC.
Fitted regression models on days 0 to 25 ADG as a function of increasing STTD P as a percentage of NRC (2012) requirement estimate (% of NRC) in 6 to 13 kg pigs fed diets containing 0 (a) or 2000 (b) units of phytase. A. The QP model (BIC = 481.7) estimated the maximum mean ADG at 117% (95% CI 86% to >140%) of NRC, with 99% of maximum ADG achieved at 106% of NRC; the estimated QP regression equation was: ADG (g) = −8.45 + 4.74 × (STTD P, % of NRC) − 0.02 × (STTD P, % of NRC)2. The BLL (BIC = 479.0) plateau was estimated at 91% (95% CI 76% to 107%) of NRC. B. The QP model (BIC = 470.1) estimated the maximum mean ADG at 138% (95% CI 110% to >170%) of NRC, with 99% of maximum ADG achieved at 122% of NRC; the estimated QP regression equation was: ADG (g) = 76.18 + 3.31 × (STTD P, % of NRC) − 0.012 × (STTD P, % of NRC)2. ADG = average daily gain; STTD = standardized total tract digestible; QP = quadratic polynomial; BIC = Bayesian information criterion; BLL = broken-line linear; LSM = least square means.

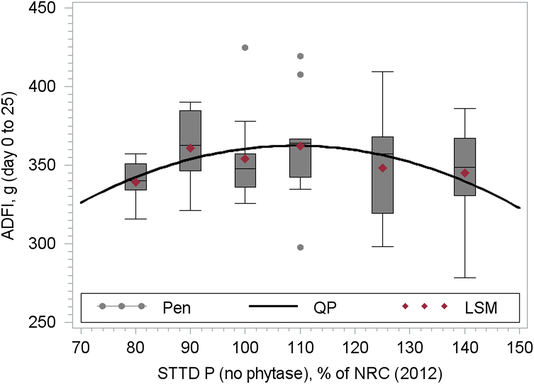
For ADFI during the treatment period, pigs fed diets containing phytase had greater (P < 0.01) ADFI than those fed diets without phytase regardless of STTD P levels (380 v. 352 g, respectively). Increasing STTD P from 80% to 140% of NRC increased (quadratic, P < 0.05) ADFI when phytase was not included in the diets (Figure 2). The QP model suggested that the maximum ADFI was achieved when diet contained STTD P of 109% (95% CI 80% to 140%) of NRC, with 99% of maximum ADFI achieved at 97% of NRC. When diets contained phytase, there was no evidence (P>0.26) of any STTD P dose effect on ADFI.
Fitted QP (BIC = 502.2) regression models on days 0 to 25 ADFI as a function of increasing STTD P as a percentage of NRC (2012) requirement estimate (% of NRC) in 6 to 13 kg pigs fed diets without phytase. The QP model estimated the maximum mean ADFI at 109% (95% CI 80% to 140%) of NRC, with 99% of maximum ADFI achieved at 97% of NRC; the estimated QP regression equation was: ADFI (g) = 80.91 + 5.16 × (STTD P, % of NRC) − 0.024 × (STTD P, % of NRC)2. QP = quadratic polynomial; BIC = Bayesian information criterion; ADFI = average daily feed intake; STTD = standardized total tract digestible; LSM = least square means.

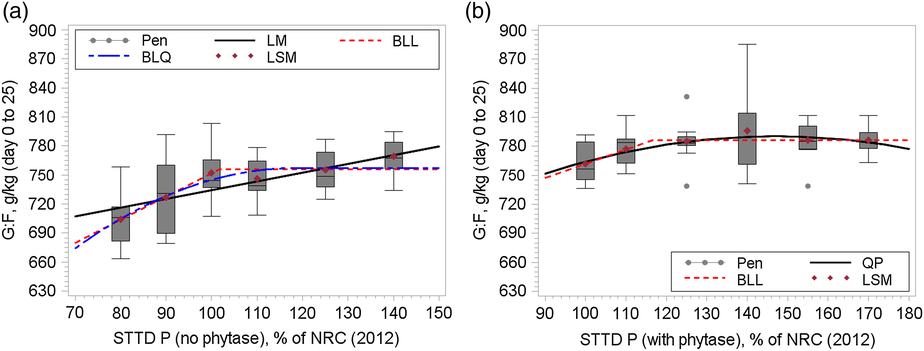
Gain–feed ratio during the treatment period was increased (P < 0.01) by adding phytase to diets regardless of STTD P levels (781 v. 758 g/kg, respectively; Table 3). Increasing STTD P from 80% to 140% of NRC in diets without phytase increased (linear, P < 0.01; quadratic, P = 0.06) G : F (Figure 3a), with LM (BIC = 505.2), BLL (BIC = 503.3), and BLQ (BIC = 504.5) as competing models. The LM model estimated the maximum G : F at >140% of NRC; the estimated LM regression equation was: G : F (g/kg) = 644.57 + 0.90 × (STTD P, % of NRC). The BLL and BLQ suggested that the plateau G : F was achieved at STTD P of 102% (95% CI 85% to 118%) and 119% (95% CI 24% to 213%) of NRC, respectively. Similarly, increasing STTD P from 100% to 170% of NRC in diets containing phytase also increased (linear, P < 0.01; quadratic, P = 0.07) G : F (Figure 3b). The best fit models were QP (BIC = 489.8) and BLL (BIC = 489.2). The QP model estimated the maximum G : F achieved at STTD P of 147% (95% CI 120% to >170%) of NRC, with 99% of maximum G : F achieved at 122% of NRC. The BLL plateau was estimated at 116.4% (95% CI 85.2% to 147.7%) of NRC.
Fitted regression models on days 0 to 25 G : F as a function of increasing STTD P as a percentage of NRC (2012) requirement estimate (% of NRC) in 6 to 13 kg pigs fed diets containing 0 (a) or 2000 (b) units of phytase. A. The LM (BIC = 505.2) estimated the maximum mean G : F at >140% of NRC; the estimated LM regression equation was: G : F (g/kg) = 644.57 + 0.90 × (STTD P, % of NRC). The BLL (BIC = 503.3) plateau was estimated at 102% (95% CI 85% to 118%) of NRC. The BLQ (BIC = 504.5) plateau was estimated at 119% (95% CI 24% to 213%) of NRC. B. The QP model (BIC = 489.8) estimated the maximum mean G : F at 147% (95% CI 120% to >170%) of NRC, with 99% of maximum G : F achieved at 122% of NRC; the estimated QP regression equation was: G : F (g/kg) = 534.32 + 3.48 × (STTD P, % of NRC) − 0.012 × (STTD P, % of NRC)2. The BLL (BIC = 489.2) plateau was estimated at 116% (95% CI 85% to 148%) of NRC. G : F = gain–feed ratio; STTD = standardized total tract digestible; LM = linear model; BIC = Bayesian information criterion; BLL = broken-line linear; BLQ = broken-line quadratic; LSM = least square means.

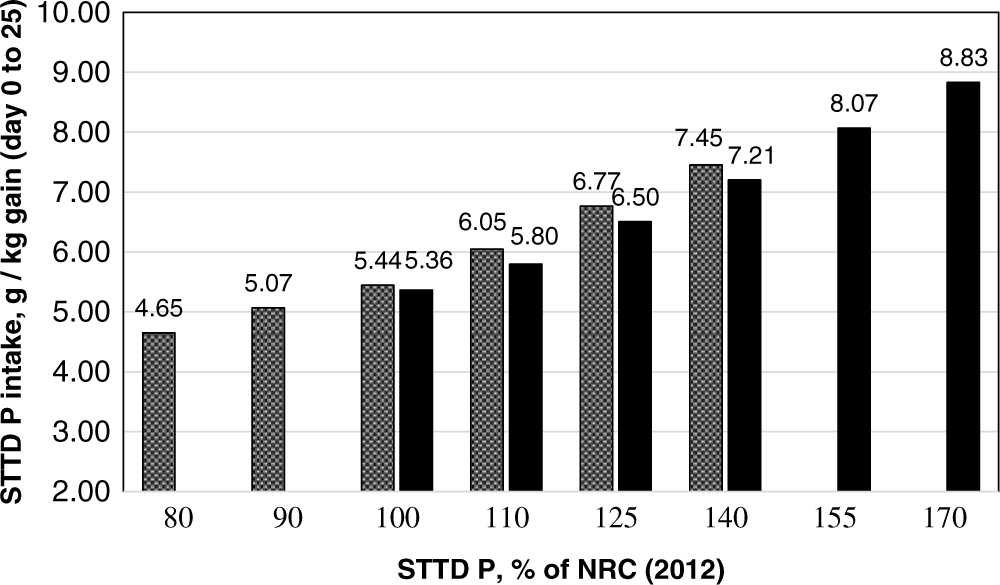
Intake of STTD P per kilogram of gain during the treatment period was increased (linear, P < 0.01) by increasing STTD P in both sets of formulations but was decreased (P < 0.01) by adding phytase to the diets (STTD P intake included the assumed P release by phytase; Figure 4).
Effects of STTD P and 2000 phytase units (FYT/kg) of Ronozyme HiPhos 2500 on pig STTD P intake (g) per kilogram gain during treatment period (days 0 to 25). Phytase main effect (analysed in a 2 × 4 factorial with the main effects of P (100%, 110%, 125% or 140%) and phytase (0 or 2000 FYT/kg)): P < 0.01; STTD P effect (0 FYT/kg phytase): linear P < 0.01, quadratic P = 0.38; STTD P effect (2000 FYT/kg phytase): linear P < 0.01, quadratic P = 0.16. STTD = standardized total tract digestible.

During the post-treatment period (days 25 to 46), all pigs were fed the same common diet without phytase containing 0.45% STTD P (136% of NRC requirement estimate). Pigs previously fed diets containing phytase had decreased (P < 0.05) ADG (680 v. 717 g, respectively), ADFI (1054 v. 1091 g, respectively) and G : F (645 v. 657 g/kg, respectively) compared with pigs previously fed diets not containing phytase. The STTD P content of diets fed previously did not affect the growth performance except for ADFI of pigs previously fed phytase diets, whereby ADFI tended to increase (linear, P = 0.08) as more STTD P was fed previously.
Percentage bone ash
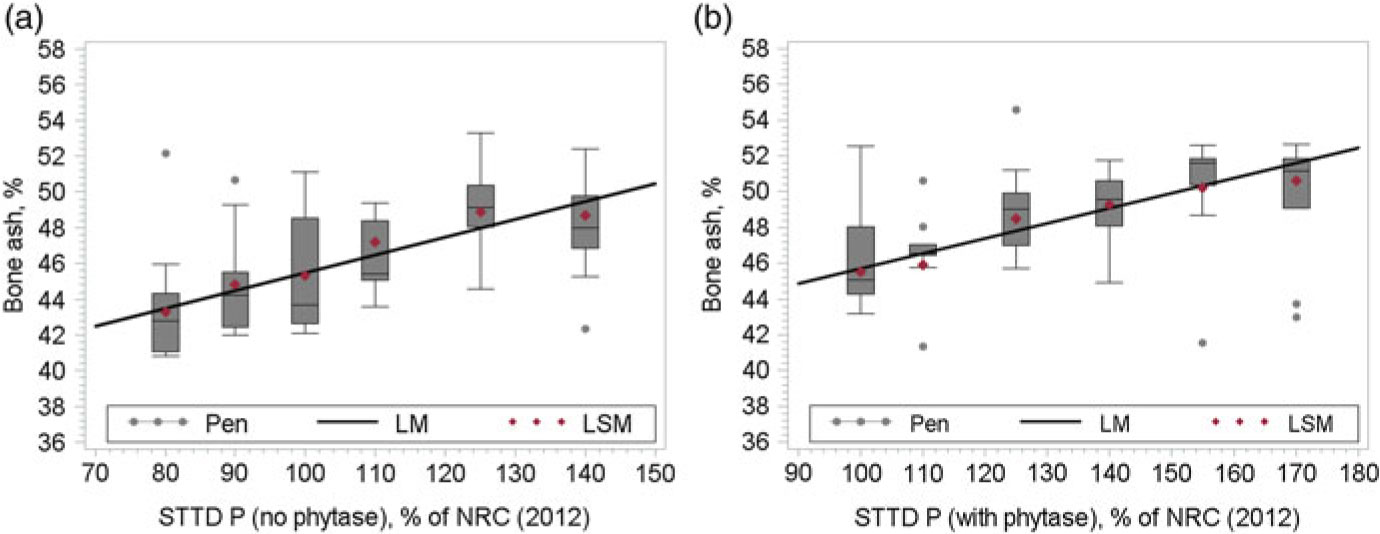
Pigs fed diets containing phytase had decreased (P < 0.05) bone ash weight, but similar percentage bone ash, compared with those fed diets without phytase. Both bone ash weight (quadratic, P < 0.05) and percentage bone ash (linear, P < 0.01) increased with increasing STTD P. When diets contained no phytase, the LM model (BIC = 264.3) estimated the maximum percentage bone ash achieved at >140% of NRC (Figure 5a). When diets contained phytase, the LM model (BIC = 257.6) estimated the maximum percentage bone ash achieved at >170% of NRC (Figure 5b).
Fitted regression models on percentage bone ash as a function of increasing STTD P as a percentage of NRC (2012) requirement estimate (% of NRC) in 6 to 13 kg pigs fed diets containing 0 (a) or 2000 (b) units of phytase. A. The LM (BIC = 264.3) estimated the maximum mean percentage bone ash at >140% of NRC; the estimated LM regression equation was: bone ash (%) = 28.79 + 0.095 × (STTD P, % of NRC) + 0.56 × (BW). B. The LM model (BIC = 257.6) estimated the maximum mean percentage bone ash at >170%; the estimated LM regression equation was: bone ash (%) = 32.27 + 0.084 × (STTD P, % of NRC) + 0.37 × (BW). STTD = standardized total tract digestible; LM = linear model; BIC = Bayesian information criterion; LSM = least square means.

Discussion
The present study characterized the dose-response to increasing STTD P in diets without or with a high dose of phytase. The dose levels were structured to capture the potential response plateau suggested by literature (NRC, 2012). The phytase-containing diets with the lowest STTD P dose (100% of NRC) only contained negligible (0.02%) amounts of inorganic P source, which prevented us from testing the 80% or 90% of NRC doses in diets containing phytase.
The STTD P requirements estimated in the present study varied depending on the response criteria and statistical models. In diets without phytase, QP and BLL models resulted in numerically different STTD P requirement estimates for ADG. Based on our experience with modelling nutrient requirements using the method described by Gonçalves et al. (Reference Gonçalves, Bello, Dritz, Tokach, DeRouchey, Woodworth and Goodband2016), the QP model tended to be more sensitive to detecting the maximum response and, therefore, resulted in a numerically higher STTD P requirement estimate of 117% (95% CI 86% to >140%) of NRC in contrast to 91% (95% CI 76% to 107%) of NRC suggested by the BLL model. However, given the wide confidence interval, these requirement estimates are not statistically different. Smaller increments of titration doses and more advanced modelling techniques are needed in future research to verify our observation. In a QP model, the STTD P level that maximized growth performance may not be economically optimal, and a large proportion of the maximum performance can be achieved at a considerably lower STTD P level for the majority of pigs. In this case, 95% and 99% of the maximum ADG can be achieved at STTD P levels of 92% and 106% of NRC, respectively. These results suggest that the NRC (2012) recommendations are reasonably accurate for ADG response when diets do not contain phytase. Likewise when using ADFI and G : F as the response criteria, the estimated STTD P requirements in diets not containing phytase ranged from 102% to >140% of NRC depending on statistical models.
When 2000 FYT/kg phytase was added in the diets, the estimated plateau doses of STTD P for ADG (138% of NRC) and G : F (147% and 116% of NRC using QP and BLL models, respectively) numerically increased compared with diets without phytase. Caution is needed when comparing the requirement estimates between diets without and with phytase given the wide confidence interval of the estimates and because different dose ranges were tested for the two titrations. It is possible that the STTD P requirements might have been increased to support the improved ADG and G : F and potentially higher dietary energy when phytase was added to diets. However, it is worth noting that the dietary STTD P concentrations tested herein were derived from assumed digestibility coefficients that are determined mostly using growing pigs, but in fact, P digestibility increased with greater piglet BW (Kemme et al., Reference Kemme, Jongbloed, Mroz and Beynen1997). Therefore, adjustments in STTD P requirement estimates may be needed for young pigs.
Comparing diets that contained the same STTD P contents, positive effects of feeding 2000 FYT/kg phytase were observed for ADG, ADFI and G : F. Additionally, STTD P intake per kilogram of gain was reduced (P < 0.01) by adding phytase to diets, indicating a better efficiency of utilizing P for growth. This extra-phosphoric effect of phytase on growth performance has also been observed in other studies (Walk et al., Reference Walk, Srinongkote and Wilcock2013; Zeng et al., Reference Zeng, Li, Tian, Zhao, Xu, Yu and Piao2015; Patience et al., Reference Patience, Gould, Koehler, Corrigan, Elsbernd and Holloway2015). Walk et al. (Reference Walk, Srinongkote and Wilcock2013) observed 9%, 11% and 3% improvements in ADG, ADFI and G : F, respectively, when 2500 FYT/kg phytase was fed to nursery pigs from 7 to 12 kg BW. The magnitude of phytase effects observed by Walk et al. (Reference Walk, Srinongkote and Wilcock2013) was in close agreement with the present study where averagely 11%, 8% and 3% improvements in ADG, ADFI, and G : F, respectively, were observed. Using pigs with BW ranging from 6 to 22 kg, Patience et al. (Reference Patience, Gould, Koehler, Corrigan, Elsbernd and Holloway2015) reported 2% and 3% increase in ADG and G : F, respectively, by feeding 2500 FTU/kg phytase. The proposed mechanisms of the growth-promoting effects of high-dose phytase include the near-complete destruction of anti-nutritional effects of phytate and the generation of other nutrients such as inositol, as well as increased availability of other nutrients such as amino acid, minerals or energy (Adeola and Cowieson, Reference Adeola and Cowieson2011).
Dietary Ca concentration is an important factor when investigating the effect of P and phytase on pig performance because excess dietary Ca impairs P absorption and the efficacy of phytase (Reinhart and Mahan, Reference Reinhart and Mahan1986; Dersjant-Li et al., Reference Dersjant-Li, Awati, Schulze and Partridge2015; Wu et al., Reference Wu, Tokach, Dritz, Woodworth, DeRouchey, Goodband, Gonçalves and Bergstrom2018). A constant total Ca–total P ratio of 1.2:1 was maintained when formulating the experimental diets, resulting in analysed Ca–analysed P ratios ranging from 1.1:1 to 1.6:1. However, an arguably low release value (0.105%) for STTD Ca was recommended by the phytase manufacturer and used in diet formulation. Cowieson et al. (Reference Cowieson, Wilcock and Bedford2011) suggested that more Ca than P release should be expected at a given dose of phytase. Therefore, it is possible that more digestible Ca was available for pigs fed diets containing phytase. However, a previous study conducted in the same facility involving pigs of similar BW range and the same phytase source suggested that total Ca–total P ratios ranging from 0.8:1 to 1.6:1 can be fed without a change in growth performance (Wu et al., Reference Wu, Tokach, Dritz, Woodworth, DeRouchey, Goodband, Gonçalves and Bergstrom2018).
Interestingly, during the post-treatment period, we observed a detrimental effect of withdrawing phytase on the growth performance of pigs previously fed phytase diets compared with those fed diets without phytase. In addition, the magnitude of such effect diminished over time; specifically, 17%, 9% and 10% decrease in ADG, ADFI, and G : F, respectively, were observed during the first week post-treatment, in contrast to 6%, 3% and 2%, respectively, for the second week post-treatment, and no performance difference during the third week post-treatment among pigs previously fed diets without or with phytase (data not shown). To our knowledge, this observation has not been reported in other studies on nursery pigs. Because the common feed did not contain phytase, we hypothesized that pigs previously fed high phytase diets had not been exposed to phytate as an anti-nutritional factor; thus, when switched to a diet without phytase, the digestive function of these pigs may have been compromised and required a period of adaptation to the high-phytate diets. In commercial pig production, phytase inclusion is often reduced from nursery to grower and finisher diets. Therefore, further research is needed to investigate the effects of complete or step-down removal of dietary phytase on pig’s growth performance.
Percentage bone ash values reported in the present study agreed with other studies (Brana et al., Reference Brana, Ellis, Castaneda, Sands and Baker2006; Gourley et al., Reference Gourley, Woodworth, DeRouchey, Dritz, Tokach and Goodband2018) where bones were not defatted during the analysis and pigs of similar BW range were utilized. Regardless of phytase addition, increasing STTD P concentration linearly increased percentage bone ash, suggesting a STTD P requirement >140% of NRC in diets without phytase, and 170% of NRC in phytase-containing diets is needed for maximizing bone mineralization. This observation is consistent with other studies (Ekpe et al., Reference Ekpe, Zijlstra and Patience2002; Saraiva et al., Reference Saraiva, Donzele, Oliveira, Abreu, Silva, Guimarães and Kim2012; Vier et al., Reference Vier, Wu, Menegat, Cemin, Dritz, Tokach, Goncalves, Orlando, Woodworth, Goodband and DeRouchey2017b) where Ca and P required to maximize bone ash content was greater than that required to maximize growth. The NRC (2012) requirement estimates for P and Ca are based on maximizing growth and optimizing mineral retention. Greater P requirement for bone development is particularly important for gilts that are intended for future sows. It is surprising that when diets contained the same STTD P levels (100%, 110%, 125% and 140% of NRC diets), pigs fed phytase had decreased bone ash weight, even though percentage bone ash was similar, compared with those fed diets without phytase. A possible explanation is that the releasing ability of 2000 FYT/kg phytase used in the present study was overestimated, which, however, contradicted the growth performance results. An overestimation of phytase release ability could contribute to an increase in STTD P requirement estimates for diets containing phytase. Most frequently, the digestibility of P and growth responses have been used to establish the release values of phytases. It is possible that the release values of 2000 FYT/kg phytase used in the present study were adequate for maximum growth but were suboptimal for maximum bone development. The increased rate and efficiency of whole-body growth when fed a high dose of phytase may require additional dietary STTD P for maximum bone ash weight.
In conclusion, increasing dietary STTD P improved ADG, ADFI, G : F and percentage bone ash. The estimated STTD P requirements varied based on the growth response criteria and statistical models and ranged from 91% to >140% of the NRC (2012) requirement estimates (corresponding to 0.41% to >0.63% of phase 1 diet and 0.36% to >0.56% of phase 2 diet) in diets containing no phytase, and from 116% to 147% of NRC (corresponding to 0.52% to >0.77% of phase 1 diet and 0.46% to 0.59% of phase 2 diet) for diets containing 2000 FYT/kg phytase. A higher dietary concentration of STTD P (>140% and >170% of NRC for diets without and with phytase, respectively) is needed for maximizing bone mineralization than for growth performance. In addition, the high dose of phytase appeared to exert an extra-phosphoric effect on promoting growth performance and improved the dose-responses of ADG and G : F to dietary STTD P in 6 to 13 kg nursery pigs.
Acknowledgements
This research was conducted with contribution from the Kansas Agric. Exp. Stn. (Manhattan, KS, 66506–0210; contribution number 18-355-J). Appreciation is expressed to DSM Nutritional Products, Inc. (Parsippany, NJ) for their technical support and partial funding. Special appreciation is also expressed to Julie Salyer and Lorene Parkhurst from Kalmbach Feeds, Inc. (Sycamore, OH) for their technical support and expertise in conducting the experiment. The authors also acknowledge Dr. Christopher Vahl and Hilda Cartagena for their support and expertise in statistical analysis.
F. Wu, 0000-0001-5993-7955
Declaration of interest
The authors declare no conflict of interest.
Ethics statement
All experimental procedures in this study were approved by the Kansas State University Institutional Animal Care and Use Committee (Manhattan, KS).
Software and data repository resources
Data from this study are available as an MS Excel file located in Dropbox (https://www.dropbox.com/s/ggvtg8tuh6vc08e/Wu_P%20titration%20data.xlsx?dl=0).
Supplementary material
To view supplementary material for this article, please visit https://doi.org/10.1017/S1751731119000922