INTRODUCTION
In the natural world, many things are not evenly or randomly distributed among individuals in populations. This pattern is clearly demonstrated in many animal species where a few dominant males sire the majority of offspring (Clutton-Brock, Reference Clutton-Brock1990) as well as in human economics where the majority of material wealth is aggregated in an ever-shrinking minority of people (e.g. Davies et al. Reference Davies, Sandstroem, Shorrocks and Wolff2007). Thus, in many natural systems the majority of results are derived from a minority of inputs, a pattern referred to as the Pareto principle or the 20/80 rule (Juran et al. Reference Juran, Seder and Gryna1962). The degree of aggregation of organisms across their potential environments can have fundamental consequences on ecosystem dynamics. For example, the abundance of many parasites is often a function of their distribution in time, in space, and among hosts. Further, highly aggregated distributions of macroparasites that vector microbial pathogens can increase the probability of persistence of the pathogen (Woolhouse et al. Reference Woolhouse, Dye, Etard, Smith, Charlwood, Garnett, Hagan, Hii, Ndhlovu, Quinnell, Watts, Chandiwana and Anderson1997; Perkins et al. Reference Perkins, Cattadori, Tagliapietra, Rizzoli and Hudson2003). Identifying the factors that result in parasite aggregation is a fundamental step towards understanding the natural causes of high parasite abundances (Woolhouse et al. Reference Woolhouse, Dye, Etard, Smith, Charlwood, Garnett, Hagan, Hii, Ndhlovu, Quinnell, Watts, Chandiwana and Anderson1997; Lloyd-Smith et al. Reference Lloyd-Smith, Schreiber, Kopp and Getz2005).
Highly aggregated distributions of parasites on their hosts have been observed in several natural systems (reviewed by Shaw et al. Reference Shaw, Grenfell and Dobson1998; Krasnov et al. Reference Krasnov, Stanko and Morand2010; Sanchez et al. Reference Sanchez, Devevey and Bize2011; discussed by Poulin, Reference Poulin2007 in chapter 6). Although host characteristics have been investigated to explain this (e.g. Folstad and Karter, Reference Folstad and Karter1992; Ezenwa et al. Reference Ezenwa, Price, Altizer, Vitone and Cook2006; Bize and Roulin, Reference Bize and Roulin2009), aggregation on hosts can result from other factors such as the intricacies of the biology of the parasite or interactions with a heterogeneous environment. Indeed, theoretical models suggest that aggregated spatial distributions of host-seeking parasites are sufficient to generate aggregated distributions of parasites among identical hosts (Leung, Reference Leung1998; Hansen et al. Reference Hansen, Jeltsch, Tackmann, Staubach and Thulke2004). Thus, the spatial distribution of host-seeking parasites may be a dominant factor determining the subsequent distribution of parasites on hosts yet has received surprisingly little empirical attention. The distribution of the host-seeking stages of many parasites is either virtually absent (e.g. fleas and lice) or is difficult to define (e.g. in the case of microscopic parasites). However, many tick species have extensive host-seeking stages and are ideally suited to simultaneously quantify the contribution of host-seeking parasite behaviours and host identity – defined here as the complex of host characteristics – to the aggregation of parasites on a minority of hosts. For example, it has been previously shown that ticks in the genus Ixodes aggregate on different vertebrate species due in part to the spatial distribution of host-seeking ticks (Randolph, Reference Randolph1975; Ostfeld et al. Reference Ostfeld, Hazler and Cepeda1996a, Reference Ostfeld, Miller and Hazlerb; Shaw et al. Reference Shaw, Keesing, McGrail and Ostfeld2003; Perkins et al. Reference Perkins, Cattadori, Tagliapietra, Rizzoli and Hudson2003; Krasnov et al. Reference Krasnov, Stanko and Morand2007, Reference Krasnov, Stanko and Morand2010). Extensive studies have shown that white-footed mice (Peromyscus leucopus) feed more ticks than eastern chipmunks (Tamias striatus) (Schmidt et al. Reference Schmidt, Ostfeld and Schauber1999; Shaw et al. Reference Shaw, Keesing, McGrail and Ostfeld2003; Brunner and Ostfeld, Reference Brunner and Ostfeld2008) because mice are much more likely to use tick-infested microhabitats (Shaw et al. Reference Shaw, Keesing, McGrail and Ostfeld2003). The variation of parasite burdens among hosts within species is also striking (Randolph, Reference Randolph1975; Brunner and Ostfeld, Reference Brunner and Ostfeld2008) and assessing the factors affecting aggregation on individuals within species is essential to understanding the natural causes of variation in parasite abundances.
In this study we examined the aggregation of immature I. scapularis ticks (larvae and nymphs) both while seeking a host and while attached to white-footed mice. These data were used to quantify the effects of the spatio-temporal aggregation of host-seeking ticks and of heterogeneity among mice on the aggregation of ticks on hosts. Aggregation of ticks on hosts driven by spatial heterogeneity in host-seeking ticks is expected to result in the aggregation of ticks on mice in specific locations with strong spatial autocorrelation. Alternatively, aggregation of ticks on hosts driven by host heterogeneity is expected to result in the aggregation of ticks on a consistent set of mice over time regardless of the spatial location. We conducted this study in 2 sites in southeastern Pennsylvania, a region endemic for several tick-borne diseases such as human babesiosis, Bartonellosis, Lyme disease, and human granulocytic anaplasmosis (Steiner et al. Reference Steiner, Pinger, Vann, Grindle, Civitello, Clay and Fuqua2008; Yeagley et al. Reference Yeagley, Reichard, Hempstead, Allen, Parsons, White, Little and Meinkoth2009; Dubey et al. Reference Dubey, Bhatia, Lappin, Ferreira, Thorn and Kwok2009) which has been largely ignored in previous studies of tick-borne pathogens.
MATERIALS AND METHODS
Study site
We monitored the abundance of larval and nymphal I. scapularis both while host seeking and while attached to white-footed mice from mid-April to mid-September in 2009 and 2010 at 2 sites in Southeastern Pennsylvania, USA. The 2 sites, called Monocassy and Northside, are located in Crow's Nest Preserve (Natural Lands Trust), Chester County (40°11′N, 75°17′W), a deciduous mid-Atlantic forest with interspersed agricultural lands. The Monocassy and Northside sites have similar underlying geology and weather conditions but differ slightly in forest type: Monocassy is dominated by oaks (Quercus ssp.) with limited understory; Northside is dominated by maples (Acer ssp.) and tulip trees (Liriodendron tulipifera) with a well-developed understory. At each site, 2 study plots (225×225 m each) were established and separated by 200 m. The Monocassy and Northside sites were separated by 500 m of agricultural lands, dwellings, roads, and a creek.
Aggregation of host-seeking ticks in time and space
The abundance of host-seeking immature ticks was monitored weekly on four 20 m2 transects per plot. Transects were randomly distributed on the margins of each study plot and sampled between 09:00 and 21:00 in dry conditions. A 1-m2 panel of fabric was dragged at a slow, steady pace over bare ground and vegetation and was repeated forward and backward on each transect. The panel was checked for ticks every 10 m, and all ticks were identified visually and stored in 70% ethanol. To control for variance caused by surveys occurring at different times of day, operators simultaneously surveyed transects at each plot. To control for variance caused by operator technique, each operator sampled transects on each plot at each session. The study plots were thus simultaneously sampled, and the 4 transects in each plot were dragged by 4 different operators at each session. The spatial distribution of host-seeking ticks was assessed using the index of dispersion D=σ 2/μ, a common metric of the aggregation (Randolph and Steele, Reference Randolph and Steele1985; Ostfeld et al. Reference Ostfeld, Hazler and Cepeda1996a; Poulin, Reference Poulin2007; Brunner and Ostfeld, Reference Brunner and Ostfeld2008), where μ and σ 2 are respectively the mean and the variance of larvae and nymphs among transects of a site during a session. Values of D significantly greater than 1 indicate aggregation and significantly less than 1 indicate over-dispersion. The confidence intervals were computed by non-parametric bootstrapping in R 2.13.0 (R Development Core Team, 2010).
Aggregation of feeding ticks on mice and in space
Trapping grids were established on each study plot to assess the distribution of ticks attached to white-footed mice. Two trapping grids were established in 2009 and an additional 2 were added in 2010 for 4 total. Each trapping grid contained 64 trapping stations spaced every 15 m with 1 Sherman live-trap per locality (Sherman Traps, Inc., Tallahassee, FL, USA). Traps were baited with rolled-oats, set at 17:00, and checked the following morning before 10:00. Each captured mouse was fitted with a unique 4-digit ear tag and the sex, age according to pelage (juvenile, subadult, adult), body mass, and the number of larval and nymphal ticks attached to the ears and the head were recorded once per week. Importantly, the entire cohort of ticks feeding on a mouse is replaced every 4 days (Brunner et al. Reference Brunner, Cheney, Keesing, Killilea, Logiudice, Previtali and Ostfeld2011) suggesting that ticks are not counted multiple times. The number of ticks on the ears and head of mice was correlated with the total number of ticks per mouse using identical methods employed here (Brunner and Ostfeld, Reference Brunner and Ostfeld2008). While ear tags may affect tick burdens on the affected ear, ear tags do not affect the relative tick burdens among mice (Ostfeld et al. Reference Ostfeld, Miller and Schnurr1993). The relative home range size of each mouse trapped on 3 or more occasions was estimated using Minimum Convex Polygons in Ranges VII (Anatrack Ltd, Wareham, Dorset, UK). The minimum convex polygon – the area enclosed by the localities where a mouse was caught – provides an estimate of the relative space used by each mouse which is correlated with, but are not a precise estimate of, the true home range size. However, the home range size estimates acquired by the minimum convex polygons in this study are very similar to estimations obtained previously by radiotelemetry (Wolff, Reference Wolff1985). All experiments were conducted in compliance with the Institutional Animal Care and Use Committee of the University of Pennsylvania.
The distribution of attached larvae and nymphs on mice or associated with each trap locality was assessed using the index of dispersion D and the dispersion parameter, k, of the negative binomial distribution (Randolph, Reference Randolph1975; Shaw et al. Reference Shaw, Grenfell and Dobson1998; Brunner and Ostfeld, Reference Brunner and Ostfeld2008). The best model describing the distribution of ticks on mice in each trapping session was determined using the nls library for non-linear models under R 2.13.0 (R Development Core Team, 2010). This model was compared to a model assuming a random distribution of ticks on mice created by sampling from the empirical data (code in the supplemental file). The 95% confidence intervals of the model were determined by non-parametric bootstrapping.
Factors affecting aggregation
We assessed whether larval and nymphal ticks were consistently aggregated at the same trap locations or on the same mice – indicating that factors unique to those locations or those mice results in greater tick burdens – by calculating the coefficient of repeatability, r, on standardized larval and nymphal burden data (see Lessells and Boag, Reference Lessells and Boag1987; Falconer and MacKay, Reference Falconer and Mackay1996). The standardized tick burden was calculated as zi=(xi−μ)/σ where xi is the tick burden of the ith mouse or trap station, μ is the mean tick burden within each plot, and σ is the standard deviation in tick burden within each plot (Sokal and Rohlf, Reference Sokal and Rohlf1995). Standardizing tick burdens accounts for seasonal and among-plot heterogeneity of raw tick burdens (ANOVAs testing the effect of plot and season, P>0·98). Standardization was essential due to the aggregation of tick activity in both time and space (see results).
We quantified the effect of spatial heterogeneity and mouse identity on the variance in tick burdens among mice using mixed-effect models following the Residual Maximum Likelihood method for each tick life stage. The analyses modelled standardized tick burdens as a function of 2 random factors, trapping locality and mouse identity, and a random error term. The dataset analysed was restricted to mice trapped at multiple localities and to localities where several mice were observed in order to parse the effects of mouse identity and spatial location. This procedure partitions the proportion of the total variance explained by each random factor.
Variance that can be attributed to properties specific to a location are expected to be spatially and temporally correlated. Spatial autocorrelation among trapping localities was analysed in PASSaGE software (Rosenberg and Andersen, Reference Rosenberg and Anderson2011) using Moran's I. A value of zero for Moran's I indicates a random spatial pattern, whereas values of 1 indicate a perfect spatial autocorrelation and −1 perfect dispersion (Räty and Kangas, 2007). Temporal autocorrelation was tested by correlating average standardized tick burdens of localities visited in 2009 and in 2010.
The proportion of the variance that can be attributed to mouse identity was further investigated using mixed-effects models. The larval and nymphal burdens were modelled as a function of 4 mouse traits (sex, age, mass, home range size) using mouse ear tag number as a random factor. We followed a backward stepwise procedure starting with all second-degree interactions.
In all analyses, continuous variables were log-transformed when necessary to achieve normality and homoscedasticity. Values are presented as mean±s.e. unless otherwise noted, analyses were performed using JMP 9.0 (SAS institute Inc., Cary, NC, USA).
RESULTS
Aggregation of host-seeking ticks in time and space
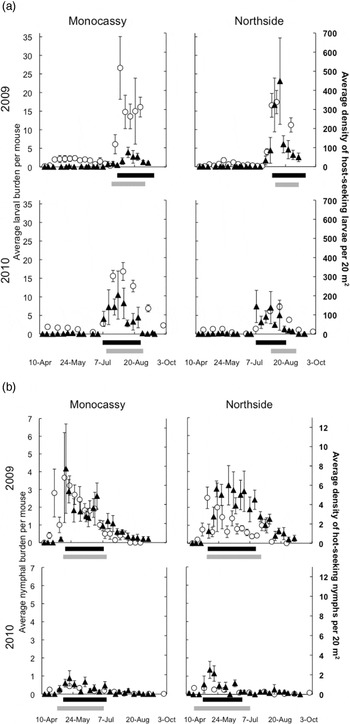
The activity periods of larval and nymphal ticks were strongly aggregated in time and were restricted to the periods between July and early September (Fig. 1A) and early May and July (Fig. 1B), respectively. The larval and nymphal peak activity periods were not overlapping. We restricted all subsequent analyses to the time-frame that comprised 80% of the larvae or 80% of the nymphs observed as times when few ticks would likely have a strong and potentially misleading effect of analyses of distributions due to random sampling effects. Host-seeking larval abundances were significantly different among sites. Interestingly the rank ordering of larval densities among sites varied among years such that sites did not retain consistently high or low larval densities across years (ANOVA, F3,248=4·9, P=0·003, interaction year*site F1,248=7·51, P=0·007). The densities of host-seeking larvae were lower in Monocassy than in Northside in 2009, whereas densities were lower in Northside than in Monocassy in 2010 (Fig. 1A). The density of host-seeking nymphs was much lower in 2010 than in 2009, without significant difference between sites (ANOVA, F2,305=71·7, P<0·001; Year: F1,305=140·4, P<0·001).
Blacklegged ticks have highly seasonal activity patterns with densities varying between sites and between years. The activity period of both (A) larval and (B) nymphal ticks were strongly aggregated in time. The average densities of host-seeking ticks (closed triangles±s.e.) and the average burdens on mice (open circles±s.e.) vary between sites and between years. The densities of host-seeking nymphs (closed triangles±s.e.) and the average nymphal burdens on mice (open circles±s.e.) were drastically lower in 2010 than in 2009. The black bars denote the peak period of host-seeking ticks (ca. 80% of collected ticks) and the grey bars figure the peak period of attached ticks (ca. 80% of counted ticks).

Within each plot, host-seeking larvae and host-seeking nymphs were significantly aggregated in space (larval average D=201·4±31·0, P<0·05, nymphal average D=2·89±0·6, P<0·05) such that 81·5±1·1% of larvae and 81·9±1·3% of nymphs were collected on 33·6±2·5% and 39·9±17·7% of the sampled transects at each session.
Aggregation of feeding ticks on mice and in space
The average larval burden on mice differed significantly among sites and between years (F2,20=8·98, P=0·002; site: F1,20=7·33, P=0·014; year: F1,20=8·93, P=0·007) (Fig. 1A). Likewise, the average nymphal burden on mice differed significantly among sites and among years (F2,39=43·22, P<0·001; site: F1,39=4·47, P=0·041; year: F1,39=82·14, P<0·001) (Fig. 1B). The seasonality of attached larvae and nymphs is consistent with the seasonality of the host-seeking activity patterns of each life stage.
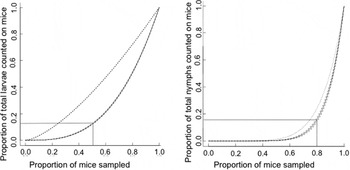
Within each plot, the majority of larvae and the majority of nymphs were aggregated on a minority of mice at each session (larval average D=11·0±2·0, P<0·05; nymphal average D=1·97±0·3, P<0·05). The cumulative distributions of larvae on mice and nymphs on mice were best described by power functions (cumulative distribution of larvae=mice3·02, R2=0·96; cumulative distribution of nymphs=mice8·31, R2=0·81). These analyses demonstrate that most larvae (79·6±0·0%) and most nymphs (79·8± 0·9%) were attached to a minority of mice (46·9±1·8% and 25·4±2·5% for larval and nymphs, respectively). The distribution of ticks on mice is more aggregated than expected given a random distribution of ticks on mice (Fig. 2A and B). The distribution of ticks on mice follows a negative binomial distribution (larval distribution, k=0·862, Χ 283=70·33, P=0·84; nymphal distribution, k=0·299, Χ 214=19·6, P=0·14) that strongly supports a non-random distribution.
The majority of ticks parasitized a minority of mice. Data are plotted as the cumulative frequency distribution of attached larvae (A) and attached nymphs (B) on mice that are ranked from lowest to highest burden. The black curve represents the model that best explains the distribution of tick burdens on mice from all trapping sessions surrounded by the 95% confidence interval for this model (dashed curves). The dotted line represents the cumulative distribution of ticks on mice assuming ticks are randomly distributed among mice. The grey lines demonstrate that half of the mice host only 16% of the larvae, while the remaining mice host 84% of attached larvae. Similarly, 80% of the mice host only 17% of all attached nymphs while the remaining 20% of the mice host 83% of the nymphs.

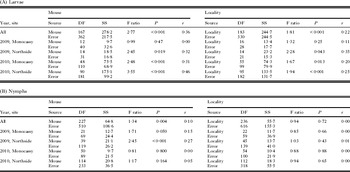
Importantly, the burdens of ticks on mice were significantly repeatable between captures in both the larval and nymphal datasets (Table 1A and B) such that mice with high tick burdens in one week had high tick burdens at all subsequent captures. That is, ticks were aggregated on a consistent subset of mice throughout the larval- or nymphal-activity seasons. The repeatabilities of nymphal burdens on mice were less distinct in 2010 due to the low numbers of observed nymphs (Table 1B).
The tick burdens observed on mice and in specific localities are consistent across repeated observations

The larval burden of mice in specific localities was also repeatable over the season (Table 1A), albeit weakly, suggesting that mice in some localities had more ticks than in others. On the contrary, we did not observe repeatability of the nymphal burden at localities (Table 1B).
Mouse identity, not the distribution of host-seeking ticks, explains the observed aggregation on mice
A large proportion of the variance in standardized larval burden in each session was explained by mouse identity and only a small proportion by the trapping locality (GLM-REML: R2=0·53; Mouse: 35·1% of total variance; Locality: 3·7% of total variance) suggesting that mouse traits and not location determine larval burden. Likewise, variance in standardized nymphal burdens could be attributed to mouse identity while none was due to trapping locality (GLM-REML: R2=0·19; Mouse: 10·9% of total variance; Locality: 0·0% of total variance).
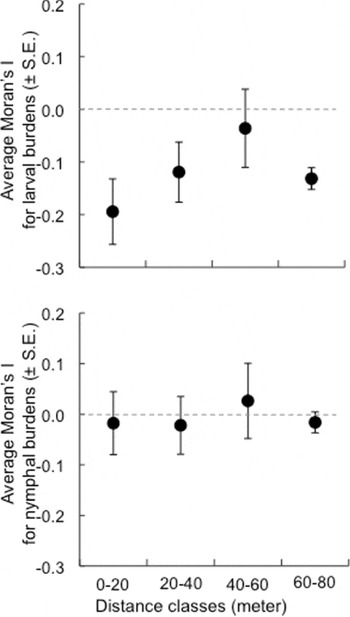
Spatial auto-correlation in larval and nymphal burdens was not detected among the trapping locations. Moran's I was not significantly different from 0 for either the larval or the nymphal datasets (Fig. 3A and B). The absence of spatial auto-correlation in tick burdens despite the inherent territoriality of mice suggests that meso-scale habitat factors cannot account for the variance in tick burden. Furthermore, neither larval nor nymphal burdens at specific localities were repeatable between years (Larvae: F1,61=0·05, P=0·83; Nymphs: F1,68=0·07, P=0·80). That is, localities that had high tick burdens in 2009 were not more likely to have high tick burdens in 2010 (Fig. S1A and B-online version only).
Tick burdens are not spatially auto-correlated. No spatial auto-correlation in standardized larval burdens (A) nor in standardized nymph burdens (B) were detected among the trapping locations as none of the Moran's I values were significantly different from 0 (P>0·12).

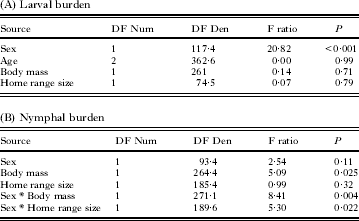
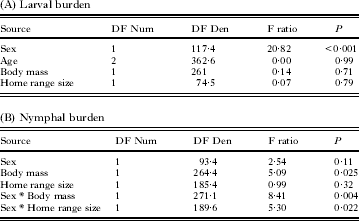
Among the analysed mouse traits, only gender was significantly correlated with larval burdens (Males>Females) (Table 2A). Mouse age, mass, and home range size were not significantly correlated with larval burdens. Nymphal burdens were significantly and positively correlated with body mass and with the size of home range, but only in male mice (Table 2B). Mouse age was not included as a factor to explain nymphal burdens due to insufficient numbers of juveniles and subadults observed during the nymphal activity period.
Different mouse-specific traits are correlated with larval and nymphal tick burdens
DISCUSSION
Immature blacklegged ticks are highly aggregated in time and in space while seeking a host and are also highly aggregated on a subset of mice. During their activity season, host-seeking larvae and nymphs are aggregated on a fraction of the sampled space at both large and local scales. Substantial inter-individual heterogeneity in burdens on mice was observed even after accounting for the strong seasonal and spatial heterogeneity in host-seeking ticks. Indeed, very little of the variation in burdens among mice could be explained by the areas where the mouse was captured, suggesting that the observed aggregation of host-seeking ticks in space has little effect on the observed aggregation of ticks on mice. The identity of the mouse, however, explained a substantial proportion of the variation in tick burdens suggesting that variation in individual mouse characteristics results in greater or fewer ticks per mouse. This result was further supported by the repeatability of ticks on mice over time such that highly parasitized mice remain highly parasitized throughout the season. This study suggests that the aggregation of ectoparasites on specific hosts, even parasites that are generalist with low dispersal rates, is not a byproduct of parasite ecologies but originate primarily from heterogeneity among individual hosts.
Aggregation of host-seeking ticks in time and in space
As expected, season was the most important factor predicting the density of host-seeking ticks and variation of burdens between April and October. These data correspond in time with several other studies in the Northeastern US that describe the seasonal peaks in tick host-seeking activity and tick burdens on wildlife (Wilson and Spielman, Reference Wilson and Spielman1985; Fish, Reference Fish and Ginsberg1993; Ostfeld et al. Reference Ostfeld, Hazler and Cepeda1996a, Reference Ostfeld, Miller and Hazlerb; Goodwin et al. Reference Goodwin, Ostfeld and Schauber2001; Brunner and Ostfeld, 2008). The factors that affect host-seeking tick densities on a coarse scale are not permanent environmental characteristics. For example, the greatest larval densities in 2009 were reported from the Northside site, which had significantly lower densities than Monocassy in 2010. The factors that resulted in the observed differences in tick densities among sites are not discernable from the current data but are likely due to complex interactions between large- and local-scale factors (Wilson, Reference Wilson1998; Jones et al. Reference Jones, Ostfeld, Richard, Schauber and Wolff1998; Randolph, Reference Randolph2004; Ostfeld et al. Reference Ostfeld, Canham, Oggenfuss, Winchcombe and Keesing2006; Gern et al. Reference Gern, Cadenas and Burri2008; Dobson et al. Reference Dobson, Taylor and Randolph2011).
The mechanisms that result in the fine-scale aggregation of host-seeking larvae are likely different than the mechanisms resulting in the observed aggregation of host-seeking nymphs. It is commonly postulated that larvae are highly aggregated as a natural consequence of the emergence of several thousand larvae from the single egg-mass produced by one fertilized female (for example Randolph and Steele, Reference Randolph and Steele1985; Daniels and Fish, Reference Daniels and Fish1990; Stafford, Reference Stafford1992). However, the spatial aggregation observed in the host-seeking nymphs must result from more complex mechanisms as the spatial location of nymphs is determined primarily by where they fall from a host after the larval bloodmeal (Ostfeld et al. Reference Ostfeld, Hazler and Cepeda1996a). Potential hypotheses are that structural differences in microhabitats influence the spatial distribution of nymphs by causing nymphs to cluster in areas where they have better overwintering success or by engorged larvae dropping simultaneously from their hosts (Ostfeld et al. Reference Ostfeld, Hazler and Cepeda1996a). The clustering of larvae and nymphs on a few of the 20 m2 transects assessed in this study suggests that the phenomena concordant with these biological mechanisms occur at a very fine scale. Interactions among large- and local-scale environmental factors may be important to future research aimed at discovering characteristics that affect focal tick densities.
It is important to note that all measures of spatial aggregation are extremely sensitive to scale (size and number of transects; Bohan, Reference Bohan2000), which could result in the numerical differences in the degree of aggregation observed among studies (Randolph and Steele, Reference Randolph and Steele1985; Ostfeld et al. Reference Ostfeld, Hazler and Cepeda1996a). Further, metrics of aggregation are sensitive to the mean number of organisms observed (Poulin, Reference Poulin2007) suggesting extreme caution when comparing the degree of aggregation among studies. For example, the degree of aggregation of nymphs attached to hosts in the current study is lower than that of attached larvae when assessed by the index of dispersion (D=1·97 vs 11·0 for nymphs and larvae, respectively, where greater numbers indicate greater aggregation) but greater when considering the aggregation parameter in the negative binomial (k=0·299 vs 0·862 where smaller numbers indicate greater aggregation) or the proportion of mice that host 80% of the ticks (25·4% vs 46·9% for nymphs and larvae). Thus, metrics of aggregation can be used to statistically determine the presence of a non-random distribution but are of limited use in comparing the degree of aggregation among studies with different sampling. Finally, like all statistical tests, the power to detect aggregated distributions is correlated with the sample size of hosts, which often results in an underestimate of the true aggregation levels in the population (Poulin, Reference Poulin2007).
Aggregation of attached ticks in space and on mice
Heterogeneity in the tick burdens among mice within plots was strongly apparent after accounting for spatial heterogeneity. At each trapping session, the number of ticks feeding on each mouse was highly variable (up to 85 larvae and 16 nymphs) with a minority of mice hosting the majority of ticks. These data are consistent with previous reports from the USA (Siegel et al. Reference Siegel, Kitron and Bouseman1991; Schmidt et al. Reference Schmidt, Ostfeld and Schauber1999; Brunner and Ostfeld, Reference Brunner and Ostfeld2008) and from reports on other Ixodes species on a variety of mammals in Europe (Cotton and Watts, Reference Cotton and Watts1967; Randolph, Reference Randolph1975; Randolph and Steele, Reference Randolph and Steele1985; Randolph et al. Reference Randolph, Miklisova, Lysy, Rogers and Labuda1999; Perkins et al. Reference Perkins, Cattadori, Tagliapietra, Rizzoli and Hudson2003; Bown et al. Reference Bown, Lambin, Telford, Ogden, Telfer, Woldehiwet and Birtles2008; Kiffner et al. Reference Kiffner, Loedige, Alings, Vor and Ruehe2011a, Reference Kiffner, Vor, Hagedorn, Niedrig and Rueheb). These observations could result from 3 phenomena, each resulting in fundamentally different temporal patterns of tick burdens on mice and in localities. First, at each session a random subset of mice could utilize areas with ephemerally high host-seeking tick densities leading to an aggregation of ticks on different subsets of mice and at different subsets of locations at each trapping session. Second, spatial heterogeneity in the environment could lead to areas with permanently high host-seeking tick densities resulting in highly repeatable tick burdens within localities and strong autocorrelation among localities. Lastly, heterogeneity in mouse characteristics or behaviours would lead to highly repeatable tick burdens on mice without regard to locality. Our data strongly support the last hypothesis as larvae and nymphs were highly aggregated on a consistent set of mice throughout the activity seasons.
Larval, but not nymphal, burdens were also significantly repeatable in localities within each year. However, the majority of the repeatability in localities was caused by resident mice visiting a consistent set of traps. That is, larval burdens of mice captured in the same localities were uncorrelated while the larval burdens of individual mice captured in different locations were strongly correlated. Further, we found no evidence of spatial autocorrelation of tick burdens among localities between years, nor evidence of temporal correlations of tick burdens at the same localities among years. These data strongly support the hypothesis that the spatial aggregation of host-seeking ticks is not responsible for the aggregation of ticks on individual mice.
Tick burdens on individual mice were repeatable throughout the seasons suggesting that ticks were consistently aggregated on the same subset of mice. For example, of the mice with the highest larval burden (top 20%) in July 2010, half remained in the group of mice with the greatest burden a month later while the remaining were more parasitized than the average. The repeatability of the tick burden on mice was significantly greater than random in all but 3 of the analyses likely due to the very small number of ticks observed in 1 larval and 2 nymphal datasets. Interestingly, these results are consistent with previous observations, suggesting that some mice with high nymphal burdens also have high larval burdens (Randolph et al. Reference Randolph, Miklisova, Lysy, Rogers and Labuda1999; Randolph, Reference Randolph2004; Brunner and Ostfeld, Reference Brunner and Ostfeld2008). The repeatability values of the tick burdens on mice measured in this study (r=0·10–0·46) are similar to repeatability values reported for heritable behavioural traits such as the exploratory behaviour of great tits (r=0·27–0·48; Dingemanse et al. Reference Dingemanse, Both, Drent, Van Oers and Van Noordwijk2002) or the risk-sensitivity of the three-spined stickle back (r=0·05–0·7; Dzieweczynski and Crovo, Reference Dzieweczynski and Crovo2011). These data are especially intriguing as the entire cohort of ticks feeding on a mouse is replaced every 3–5 days (Brunner et al. Reference Brunner, Cheney, Keesing, Killilea, Logiudice, Previtali and Ostfeld2011) suggesting that the variation among mice in tick burden results from perennial or slow-changing behavioural or physiological traits of individual mice.
Gender, age, mass, and home-range size are among the host traits that have been noted to affect ectoparasite burdens in other systems (for example Behnke and Wakelin, Reference Behnke and Wakelin1973; Brown et al. Reference Brown, Macdonald, Tew and Todd1994; Perkins et al. Reference Perkins, Cattadori, Tagliapietra, Rizzoli and Hudson2003; Randolph, Reference Randolph2004; Sanchez et al. Reference Sanchez, Devevey and Bize2011). Of these traits, only gender significantly explained differences in larval burden with males more parasitized than females, a common trend in many ectoparasites (Randolph, Reference Randolph2004; Morand et al. Reference Morand, Krasnov and Poulin2006; Krasnov et al. Reference Krasnov, Morand, Hawlena, Khokhlova and Shenbrot2005; Hillegess et al. Reference Hillegass, Waterman and Roth2008; Kiffner et al. Reference Kiffner, Loedige, Alings, Vor and Ruehe2011a, Reference Kiffner, Vor, Hagedorn, Niedrig and Rueheb; Davidar et al. Reference Davidar, Wilson and Ribeiro1989; Ostfeld et al. Reference Ostfeld, Miller and Hazler1996b; Brunner and Ostfeld, Reference Brunner and Ostfeld2008). However, gender does not completely explain the variation among hosts as there was considerable inter-individual heterogeneity within each sex and there were no significant differences among the genders in nymphal burdens. Nymphal burdens were positively correlated with body mass and home range sizes in males but not in females. Unlike other rodents, the white-footed mouse is not sexually dimorphic for body mass (P>0·6) suggesting that size cannot account for the differences in tick burdens among the genders as it does in wood mice (Apodemus sylvaticus; Harrison et al. Reference Harrison, Scantlebury and Montgomery2010). Similarly, the larger home-range size of males is often evoked as a cause of higher burden (Zuk and McKean, Reference Zuk and McKean1996; Robinson et al. Reference Robinson, Forbes and Hebert2009) but it is not consistent with the data from our study as the home ranges of males were not larger than those of females (P>0·14). However, differences among the sexes may become apparent using more accurate methods to estimate home range size such as radiotelemetry.
We expect that a complex combination of unmeasured factors such as ranging behaviour, timing and duration of activity, microhabitat use, grooming behaviours, hormones and immunological responses affect tick encounter rates and burdens. For example, testosterone, which experimentally reduces resistance to tick feeding and increases tick burden in wood mice and bank voles (Myodes glareolus) parasitized by I. ricinus (Hughes and Randolph, Reference Hughes and Randolph2001), may also affect space use behaviours (Ellis and Turek, Reference Ellis and Turek1983; Rosemitt, Reference Rowsemitt1989; Lynn et al. Reference Lynn, Houtman, Weathers, Ketterson and Nolan2000; Seivwright et al. Reference Seivwright, Redpath, Mougeot, Leckie and Hudson2005; Grear et al. Reference Grear, Perkins and Hudson2009; but see also Minerly et al. Reference Minerly, Russo, Kemen, Nazarian, Wu, Weierstall, Akhavan, Jenab and Quinones-Jenab2008) which can affect encounter rates with ticks (Boyer et al. Reference Boyer, Reale, Marmet, Pisanu and Chapuis2010). Future studies, which can exclude the spatial heterogeneity of host-seeking ticks as an explanatory factor, are needed to experimentally assess the potentially complex combination of behavioural, immunological, and physiological mechanisms underlying heterogeneity in tick burdens among individuals within populations. Understanding the mechanisms that lead to aggregation of ticks on specific hosts is particularly important for human disease risk as those hosts responsible for feeding many ticks are highly likely to be infected by pathogens, and to subsequently infect many naïve ticks. Therefore, a key element in understanding and controlling the transmission of these diseases is identifying the combination of characteristics of individuals that result in disproportionately large tick burdens.
ACKNOWLEDGMENTS
Authors want to acknowledge the field technicians, Maria Gomez-Solecki and Rick Ostfeld. Pierre Bize, Erica Foley, Chris Graves, Camillo Khatchikian, Jamie McKay and Maarten Voordouw gave very insightful comments. Finally, authors want to thanks two anonymous referees who greatly helped to improve the manuscript.
FINANCIAL SUPPORT
The study was supported by grant AI076342 from the National Institute of Health and grant CK000170 from the Center for Diseases Control and Prevention. G. D. was supported by the Swiss Science Foundation Fellowship for Prospective Researcher PBLAP3-127724/1.