Introduction
Metal and metal oxide surfaces provide unique sites for adsorption, surface reactions, and diffusion processes, and a variety of methods have been developed to enhance the physical and chemical properties of these surfaces. These techniques have typically been based on modifications to geometric structures on the nano- (meaning dispersed atoms or clusters) and macroscopic (various single crystals) scales. Electronic surface structures have been modified via doping with electronegative or electropositive elements, or by the addition of different components. Both the geometric and electronic surface characteristics are determined by the lattice atom arrangement at the surface. Thus, a technique that permits significant lattice distortion such that the atomic arrangements are modified would allow tuning of the surface properties. As an example, this technique could produce metal surfaces that are remarkably active during certain chemical reactions.
The application of an electric field to a nonsymmetric crystal such as a ferroelectric material is known to deform the crystal.Reference Lines and Glass1,Reference Ikeda2 This is referred to as the piezoelectric effect. When an alternating voltage is imposed, the piezoelectric effect results in periodic crystal distortions and so generates acoustic waves. If thin films of metal or metal oxide catalysts are attached to the ferroelectric surface undergoing lattice distortion, the distortion can be transferred to the film. This process can produce unique surface sites with different atomic arrangements, since the thin-film surface is more vulnerable to lattice distortion compared to the bulk material. The manner in which the physical and chemical properties of metal and metal oxide surfaces are affected by dynamic lattice distortions induced by acoustic waves has been previously reviewed.Reference Inoue3 However, it is extremely important to have a detailed understanding of the manner in which acoustic waves are able to enhance various surface phenomena, and this article focuses on the acoustic enhancement of adsorption and surface reactions.
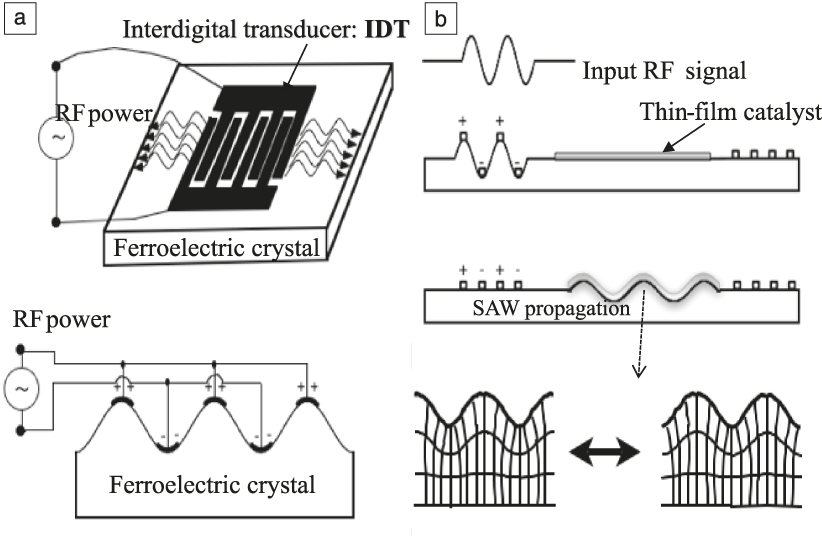
Two types of acoustic waves are typically used in such processes. One is a surface acoustic wave ([SAW]; Rayleigh or shear horizontal leaky types, whose lattice displacement is perpendicular or parallel to the surface, respectively) and the other is a bulk acoustic wave, otherwise known as resonance oscillation (RO). The basic concepts associated with the acoustic activation of metal surfaces by SAWs are depicted in Figure 1. For the application of ferroelectric crystals as substrates, the most promising candidates are lithium niobate (LiNbO3; LN) and lithium tantalate (LiTaO3; LT) single crystals. In addition to single crystals, highly sintered polycrystalline materials are also available. One such material is lead zirconate tantalate, Pb(Zr,Ti)O3.
(a) Generation of surface acoustic waves (SAWs) on a ferroelectric crystal by applying radio frequency (RF) electric power, and (b) its propagation causing lattice distortions in a thin-film catalyst deposited on the ferroelectric surface.Reference Inoue3

SAWs
SAW generation
For the generation of SAWs, interdigital transducer (IDT) metal electrode “fingers” are used—these are fabricated using photolithography on the surface of a disc composed of a ferroelectric single crystal. The space between each finger determines the SAW frequency, f.Reference Ikeda2,Reference Auld4 This value is given by f = v/δ, where v is the propagation velocity of the SAW and δ is one unit length of the IDT electrodes. In a trial employing a LN single crystal with a propagation velocity of v = 3980 ms–1 as the ferroelectric substrate, in conjunction with an IDT having a double finger structure with a width and spacing of δ = 200 μm fabricated on both ends of its surface, a central SAW frequency of 19.4 MHz was observed.Reference Saito, Nishiyama, Sato and Inoue5 This frequency was in good agreement with the calculated value of 19.9 MHz.
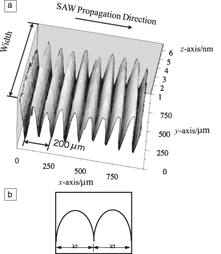
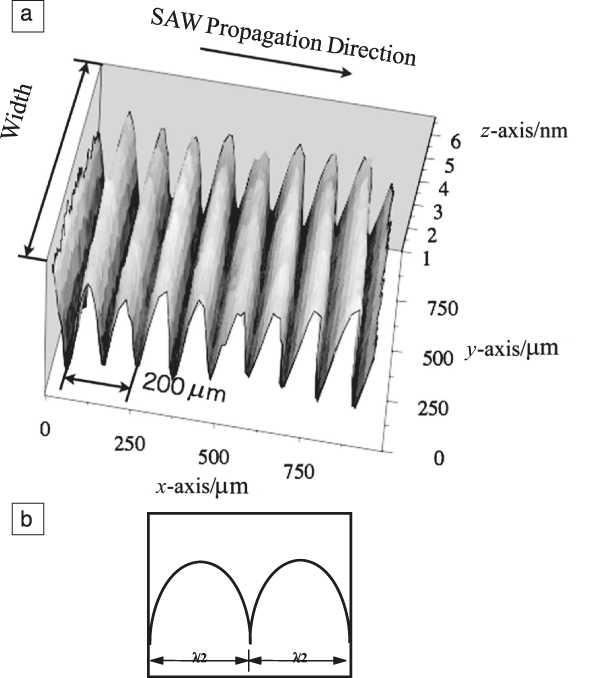
The resulting acoustic waves can be imaged in the form of a standing wave using a Doppler method. In this technique, the Doppler shift of a reflected beam is monitored by a vibrometer, while the sample is irradiated with a He-Ne laser beam.Reference Saito, Nishiyama, Sato and Inoue5 Employing a sample stage that moves in the x and y directions, three-dimensional images can be obtained. Figure 2 presents the Doppler pattern generated by a LN single crystal.Reference Nishiyama and Inoue6 The pattern shows a regular wave with a constant top-to-top distance of 100 μm. This value is equal to half the wavelength, which confirms that the acoustic wave is due to Rayleigh SAW (R-SAW) propagation.
(a) The Doppler pattern generated by an acoustic wave with a wavelength of 200 μm on a LiNbO3 ferroelectric crystal, and (b) a model of the standing wave. The peak-to-peak distance is one-half of the standing wave. The results show that the wave is due to a Rayleigh SAW. Note: SAW, surface acoustic wave; λ, wavelength.Reference Inoue3,Reference Nishiyama and Inoue6
To understand the acoustic enhancement of adsorption and surface reactions, it is essential to study the manner in which the electronic properties of metal surfaces are affected by acoustic waves. The work function of the metal is an important physical property associated with the surface, and this property is significantly affected by the crystallographic orientations. In one possible model explaining the work function, the free electrons of the metal spill out toward the exterior (i.e., the vacuum) at the topmost surface. Pairs composed of these “spill out” electrons and positive charges remaining inside near the surface form an electric double layer. The barrier of the electric double layer is correlated with the work function of the metal.Reference Lang and Kohn7,Reference Skriver and Rosengaard8 Since the spill out electron density is dependent upon the surface atom arrangement, the work function of a close-packed smooth metal surface is generally greater than that of a rough surface (i.e., a less close-packed surface) on the atomic scale. The work function is sensitive to surface structure, and thus it is interesting to examine the manner in which the work function of a metal is influenced by dynamic lattice distortion resulting from acoustic waves.
The work function during SAW propagation can be measured using photoelectron emission microscopy (PEEM), which detects the electrons emitted from metals as a function of photon energy. In this technique, the electrons ejected in response to irradiation by ultraviolet light are captured by a phosphor screen and recorded as an image monitored with a cooled CCD camera. The brightness (intensity) of the PEEM image is associated with the magnitude of electron emission, which in turn is related to the work function.
Work-function changes
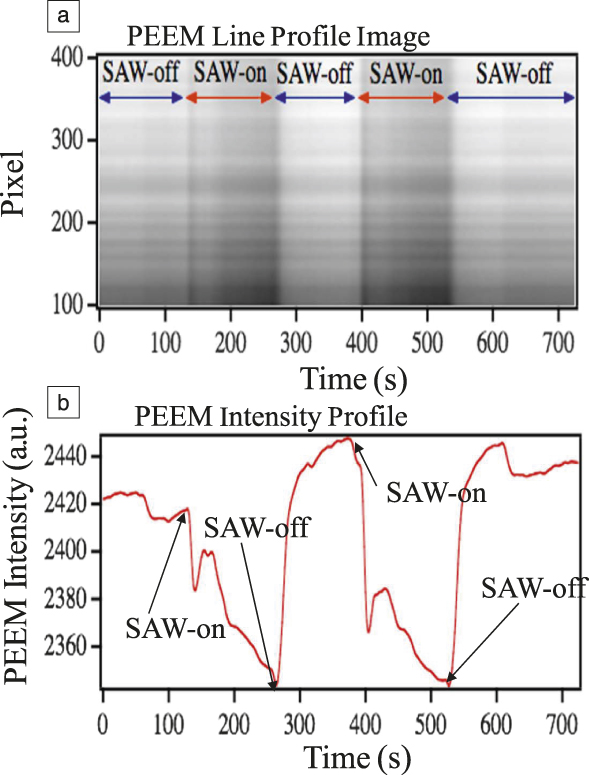
Two types of thin Cu films were used to assess the effects of R-SAWs on the work functions of metals having different structures on the atomic scale. These comprise Cu films annealed after deposition (referred to as annealed Cu surfaces) and Cu films deposited by Ar ion sputtering and then heated (sputtered Cu surfaces). Figure 3 shows the two-dimensional PEEM images acquired from an annealed Cu surface.Reference Nishiyama and Inoue9 With the SAW on, the images become darker and these dark images are maintained during the R-SAW propagation. When the SAW ceases, the images become brighter, and alternating applications of the SAW repeat the occurrences of the dark and bright images. A quantitative analysis of the PEEM intensity demonstrates that the R-SAW propagation causes a sharp drop in the intensity after an initial transient increase and gradual decrease. After ceasing application of the R-SAW, the intensity increases to a slightly higher level than the original value.
(a) Photoelectron emission microscope (PEEM) image and (b) PEEM intensity of an annealed Cu surface with the cyclic application of a Rayleigh surface acoustic wave (R-SAW) at a radio frequency power of 0.2 W and ambient temperature. The propagation of the SAW caused the dark images and a reduction in PEEM intensity, which indicate increases in the work function of the Cu surface in the presence of the SAW.Reference Nishiyama and Inoue9
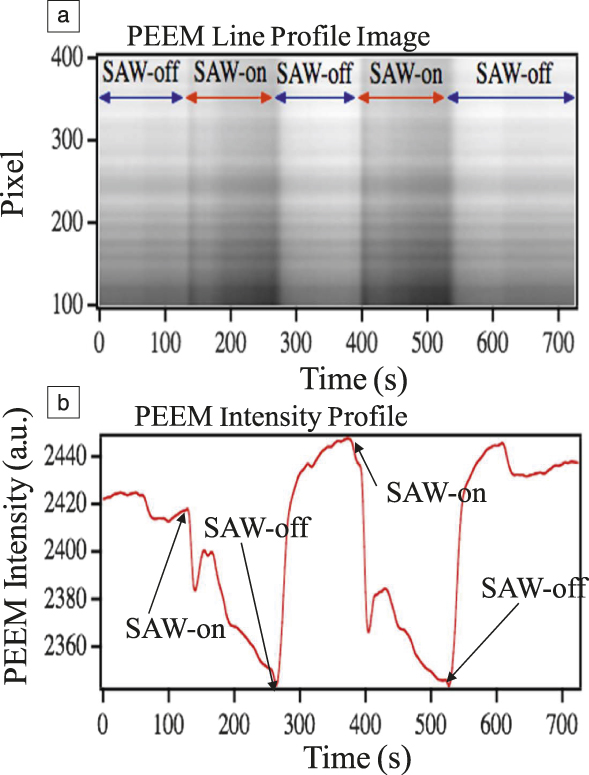
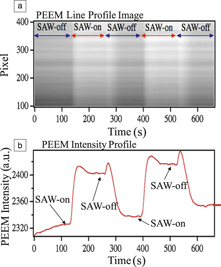
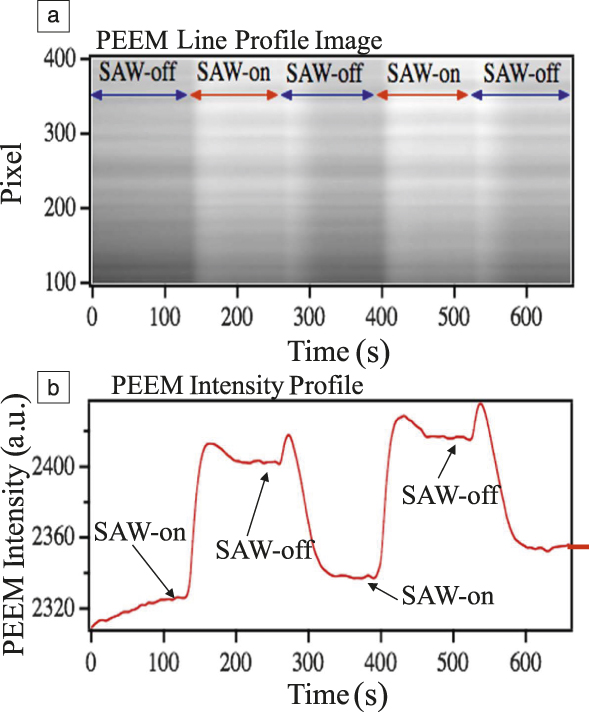
Figure 4 presents PEEM images obtained from a sputtered Cu surface.Reference Nishiyama and Inoue9 When the R-SAW propagates through the Cu surface, the images become brighter and maintain this brightness as long as the wave is applied. With the SAW off, the images become dark, and this cycle of bright and dark can be reproducibly repeated. After an initial transient fluctuation following the onset of the SAW, the PEEM intensity rapidly increased to a constant level, and then fell to nearly the original level after a reverse fluctuation with the SAW off. Similar intensity changes occur during a subsequent application of the SAW.
(a) Photoelectron emission microscope (PEEM) image and (b) PEEM intensity of a sputtered Cu surface with the cyclic application of a Rayleigh surface acoustic wave (R-SAW) at a radio frequency power of 0.2 W and ambient temperature. The propagation of the SAW caused the bright image and enhancement of the PEEM intensity, which indicate decreases in the work function of the Cu surface in the presence of the SAW. Note that the results obtained here are just opposite to those for an annealed Cu surface shown in Figure 3.Reference Nishiyama and Inoue9
The effects of a R-SAW on the PEEM intensities of other metals have also been confirmed.Reference Nishiyama and Inoue9 In the case of both annealed and sputtered Au surfaces, dark and bright images appear with alternating applications of the R-SAW, in a manner similar to the trends observed for Cu surfaces. Sputtered Pd metal also yielded the same results.Reference Nishiyama and Inoue9 It is of significant interest that an R-SAW has a marked effect on the photoemission properties of metal surfaces, and this effect varies greatly based on the atomic-scale surface structure. The observed variations in PEEM contrast (i.e., intensity) are associated with changes in the work function of the metal surface. As described later, annealed and sputtered Cu surfaces have exposed low-index Cu(111) planes and a high density of high-index planes/step sites, respectively. Based on a comparison of the PEEM intensities of such surfaces, it is evident that an R-SAW increases the work function of a low-index metal surface, but decreases that of a surface containing high-index planes and steps.
The work function of a metal depends on its surface structures. As an example, the work functions of Cu(111), (100), and (110) plane surfaces are 4.94, 4.59, and 4.48 eV, respectively,Reference Gartland, Berge and Slagsvold10 while the values for the same Ag planes are 4.74, 4.64, and 4.52 eV,Reference Dweydari and Mee11 respectively. Thus, a densely packed surface provides a larger work function. As noted, an R-SAW produces opposite changes in the work function for high- and low-index metal surfaces. High-index surfaces and step sites consist of loosely bound atoms in low coordination states. Therefore, it is likely that the SAW-induced vertical lattice displacement forces the surface metal atoms (i.e., the metal ion cores) to protrude into the electric double layer. These protruding surface metal atoms reduce the electric double layer, which results in a decrease in the work function. This phenomenon is quite important when assessing acoustic wave effects on chemisorption and catalysis at step sites composed of metal atoms.
Conversely, an R-SAW affects smooth Cu and Au surfaces oppositely, by increasing their work functions. In these low-index metal surfaces, the atoms are packed closely and so lattice displacement by the SAW is difficult. This positive work-function shift is discussed in more detail later, in relation to RO effects.
Effects of a SAW on adsorption
CO adsorption on Cu
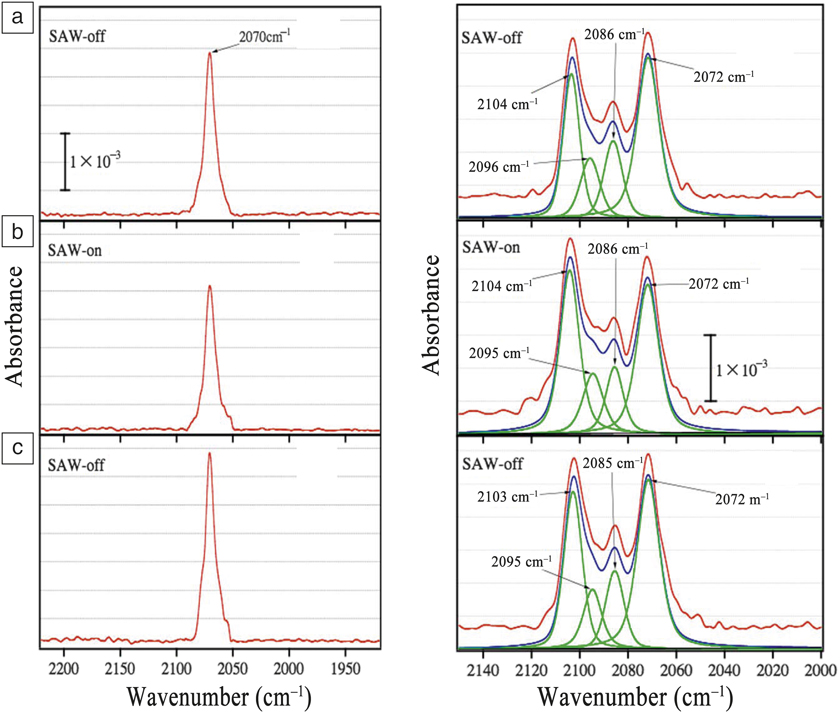
The effects of a SAW on chemisorption have been studied in experiments involving CO adsorption on Cu surfaces, using Fourier transform infrared (FTIR) spectroscopy. In conjunction with PEEM studies, such research has examined SAW effects on the adsorption of CO on annealed (low-index planes) and sputtered (exposed high-index planes) Cu surfaces. As shown in Figure 5, a strong single peak appears in the FTIR spectrum at 2070 cm–1 without a SAW following CO adsorption on an annealed Cu surface.Reference Nishiyama and Inoue12 In contrast, in the presence of a SAW, the peak intensity is decreased considerably, but recovers its initial value after the SAW is removed. This same figure also presents results for CO adsorption on a sputtered Cu surface.Reference Nishiyama and Inoue12 Without a SAW, the spectrum consists of four peaks at 2072, 2086, 2096, and 2104 cm–1. The application of the SAW modifies the spectrum. The intensity of the peak at 2072 cm–1 decreases considerably, in the same manner as observed for the annealed surface spectrum. However, the intensity at 2104 cm–1 is increased significantly, while the 2086 cm–1 peak shows a decrease. These SAW effects are reversible, and the original intensities are recovered when the SAW is turned off. Only minimal shifts in the frequencies of the four peaks appear with SAW propagation, irrespective of the intensity changes. These results are not unexpected, since previous infrared-absorption spectroscopy (IRAS) studies have shown that the CO vibrational frequencies are nearly independent of the density (i.e., the surface coverage) of CO on Cu metal surfaces.Reference Ryberg13–Reference Hollins and Pritchard15
Infrared-absorbtion spectra of CO adsorbed on (left) annealed and (right) sputtered Cu surfaces at 123 K at a CO pressure of 1.4 × 10⁻⁵ Pa with the Rayleigh surface acoustic wave (R-SAW) (a) off, (b) on, and (c) off again. In the right figures, red, green, and blue colors show the measured spectrum, the component peaks, and the spectrum synthesized from the component peaks, respectively. Note that (left) the annealed surface produces a single peak whose intensity decreases with SAW-on. (Right) The sputtered surface provides four peaks whose intensities vary in different ways with SAW-on.Reference Nishiyama and Inoue12
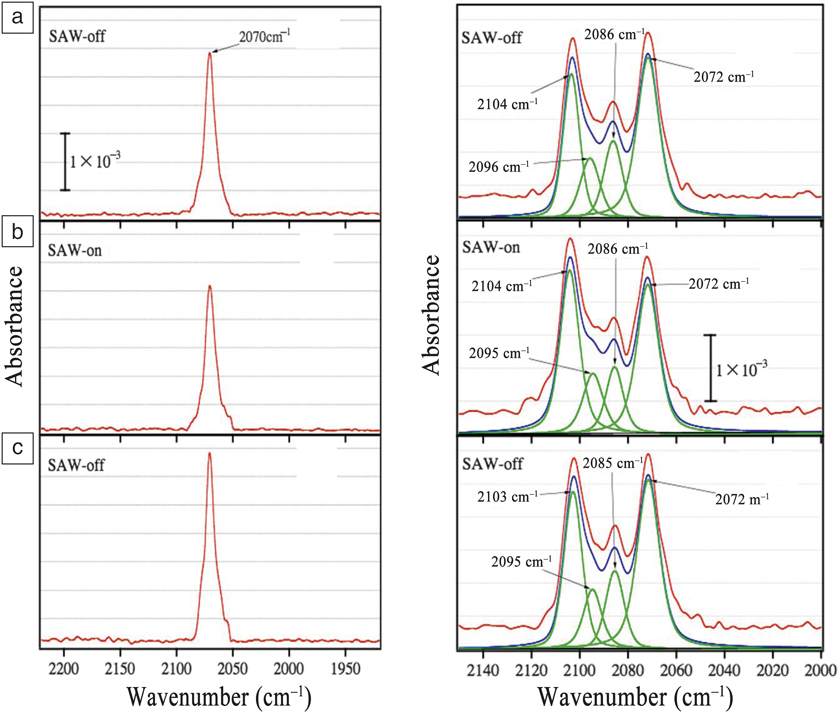
Detailed IRAS studies of CO adsorbed on the surfaces of Cu single crystals have shown that the absorption frequency due to the stretching vibration of C–O bond varies depending on the Cu face that is exposed. Specifically, low-index planes such as Cu(111), (100), and (110) generate peaks at 2070, 2088, and 2094 cm–1 at full surface coverage, respectively,Reference Ryberg13,Reference Woodruff, Hayden, Prince and Bradshaw14,Reference Pritchard16 while high-index Cu planes such as Cu(211), (311), and (755) produce peaks at 2110 cm–1, 2104 cm–1, and 2106 cm–1, respectively.Reference Pritchard, Catterick and Gupta17 From these data, it is apparent that the single peak at 2070 cm–1 observed for an annealed surface can be assigned to the C-O stretching vibration of CO adsorbed on a Cu(111) surface. Therefore, the annealed Cu consists exclusively of a low-index Cu(111) surface. Among the four peaks generated by the sputtered surface, those at 2072, 2086, and 2095 cm–1 can be ascribed to CO on Cu (111), (100), and (110) surfaces, respectively, while the highest frequency of 2104 cm–1 is due to CO on high-index planes and step surfaces. These results indicate that the sputtered Cu surface has a high density of exposed steps as well as high-index planes such as Cu(755) and Cu(311).
The IRAS peak intensity typically depends on the amount of CO adsorbed on the metal surface. Thus, the evident decrease in the CO peak intensity for the low-index planes during the application of a SAW indicates the desorption of surface CO. Conversely, the intensity enhancement in the case of the high-index planes and step sites is associated with further adsorption of CO. These results suggest that the SAW weakens the metal–carbon bonds associated with CO adsorption on low-index planes and strengthens these same bonds on atomically rough planes.
A mechanism has been proposed for the adsorption of CO on a Cu metal surface that shows the important contribution of back donation from the metal surface to the vacant antibonding 2π orbitals of CO molecules.Reference Woodruff, Hayden, Prince and Bradshaw14 As previously discussed, the work function of a low-index Cu(111) surface increases when a SAW is applied. This effect, in turn, lowers the Fermi level and attenuates the back donation from the Cu metal surface to the adsorbed CO. As a result, the metal–carbon bond becomes weaker, leading to CO desorption. Conversely, the work function of high-index planes is decreased with the SAW on. Thus, the Fermi level rises and back donation is strengthened such that CO is adsorbed more strongly and the amount of CO increases. Thus, the application of a SAW has significant effects on chemisorption by modifying the adsorbed states via changes in the electronic interactions with metal surfaces.
O2 adsorption on NiO
The effects of a SAW on adsorption on metal oxides have been studied, based on conductivity measurements. In this research, a NiO film was deposited on thin Au electrodes fabricated in the propagation path of the SAW. NiO is a p-type semiconductor, and the transfer of electrons from its surface to adsorbed O2 increases the hole density, thus enhancing conductivity. As expected, the application of a SAW was found to improve conductivity during O2 adsorption.Reference Nishiyama, Rattana, Saito, Sato and Inoue18
There is also evidence that a SAW undergoes interactions with thin NiO films along the wave propagation path. The magnitude of the standing wave generated by a SAW is reduced by a factor of 1.5 on a NiO-deposited surface compared to a NiO-free surface. In addition, a considerable reduction in SAW propagation occurs in the presence of NiO. Bierbaum showed that the propagation loss of the SAW was a function of the resistivity of the metal film.Reference Bierbaum19 In other work, an electroluminescent Cu-doped ZnS film deposited in the SAW propagation pathReference Inoue, Matsukawa and Sato20 exhibited enhanced acousto-luminescence. These findings confirm that the SAW interacts with carriers in NiO films to promote charge transfer from the oxide surface to adsorbed O2, thus increasing O2-induced conductivity.
Effects of a SAW on surface reactions
Activity
Catalysis is one of the most important chemical properties of metals and metal oxides. It is therefore of interest to determine whether a SAW can activate metal surfaces for various kinds of surface reactions. In research investigating this effect, two types of SAWs have been employed, R-SAWs and shear-horizontal leaky SAWs (SHL-SAWs); the latter is a SAW transmitted to the bulk while maintaining a distortion mode parallel to surface.
Gas-phase catalytic reactions have been studied in the pressure range of 3–10 kPa, using a closed-gas circulation reaction system coupled to a gas chromatograph for the analysis of products and reactants. During ethanol oxidation on a 10-nm-thick Pd metal film deposited in the propagation path of an R-SAW, the production of acetaldehyde was accelerated by a factor of 3.4 when a SAW was applied.Reference Inoue, Matsukawa and Sato21 During these experiments, the surface temperature was precisely controlled to avoid thermal effects, and the activation effect was found to continue in the presence of the R-SAW and disappear when the SAW was off. The effects of the SAW were also reversible. The activation energy for ethanol oxidation decreased from 42 (without a SAW) to 29 kJmol–1 (with a SAW), demonstrating that the SAW lowered the energy barrier to the reaction.
When an SHL-SAW was used, the catalytic activity for acetaldehyde production increased by a factor of 3.6,22 and the activation energy for the reaction decreased from 66 to 26 kJmol–1. In trials with a 50-nm-thick Cu metal film, the application of an R-SAW and an SHL-SAW enhanced the reaction rate by factors of 4.0 and 4.8, respectively.Reference Inoue and Watanabe23 Thus, the effects of the two types of waves on ethanol oxidation were similar.
The catalyst activation resulting from the SHL-SAW was initially puzzling, since the SHL-SAW is believed to generate inactive lattice displacements parallel to the surface. However, laser Doppler pattern analysis demonstrated that the SHL-SAW also generated randomly distributed standing waves perpendicular to the surface. Thus, the SHL-SAW exhibited a “leaky” characteristic, such that the waves penetrated through the bulk and reflected from the bottom of the crystal, producing the standing waves vertical to the surface. The SHL-SAW thus generated vertical lattice displacement at the surface, such that the associated Doppler image was analogous to that observed in the case of thickness extension mode resonance oscillation (TERO), as later discussed. This explains why an SHL-SAW is able to activate surface reactions in the same manner as an R-SAW.
King et al. investigated the effects of an R-SAW on CO oxidation over a 500-nm thick film composed of a Pt{110} single crystal, under ultrahigh vacuum conditions.Reference Kelling, Saito, Inoue and King24–Reference Kelling, Mitrelias, Matsumoto, Ostanin and King29 The R-SAW caused a sixfold increase in the catalytic activity. Furthermore, a PEEM study showed that increases in the carbon dioxide (CO2) peak intensity were correlated with decreases in the PEEM intensity.Reference Kelling, Cerasari, Rotermund, Ertl and King30 These changes were explained in terms of acoustically induced CO desorption, and it was concluded that excitation by the SAW suppressed CO poisoning of the surface, thus bringing the catalyst system back into the highly reactive regime.
Reaction selectivity
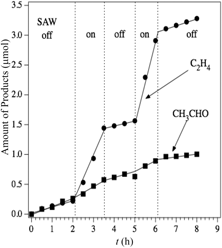
The effects of a SHL-SAW on the selectivity of catalytic reactions have been examined. One series of experiments used a Cu metal catalyst that transformed ethanol to generate both ethylene (C2H4) and acetaldehyde (CH3CHO).Reference Nishiyama, Saito, Yashima, Sato and Inoue31 Figure 6 shows the production of both materials over time in the presence and absence of a SAW. Applying the SAW significantly increased the production of ethylene, although the acetaldehyde generation remained nearly unchanged.Reference Nishiyama, Saito, Yashima, Sato and Inoue31 Thus, the reaction selectivity for ethylene, S e (defined as S e = 100 × V e/(V e + V a), where V e and V a are the production rates of ethylene and acetaldehyde, respectively, that are obtained from the gradient of the linear increases against time), increased from 45% (without the SAW) to 80%. Upon turning the SAW off, the production of ethylene decreased to the earlier level, meaning that the selectivity returned to the original value. The repeated application of the SAW provided reproducible results.
Ethylene (C2H4) and acetaldehyde (CH3CHO) production in ethanol (C2H5OH) decomposition on a Cu surface in the absence and presence of shear-horizontal leaky surface acoustic wave (SHL-SAW). The activation by the SAW occurs selectively—it remarkably enhanced the production of ethylene with little effect on the production of acetaldehyde.Reference Nishiyama, Saito, Yashima, Sato and Inoue31

Resonance oscillation of bulk acoustic waves
The structure of the device employed for the generation of bulk acoustic waves has front and rear planes of ferroelectric crystals with a polarization axis were covered by thin metal films that functioned both as electrodes and catalysts. The application of radio frequency (RF) electric power to these electrodes produced a bulk acoustic wave (i.e., RO) that had a specific resonance frequency.Reference Inoue3
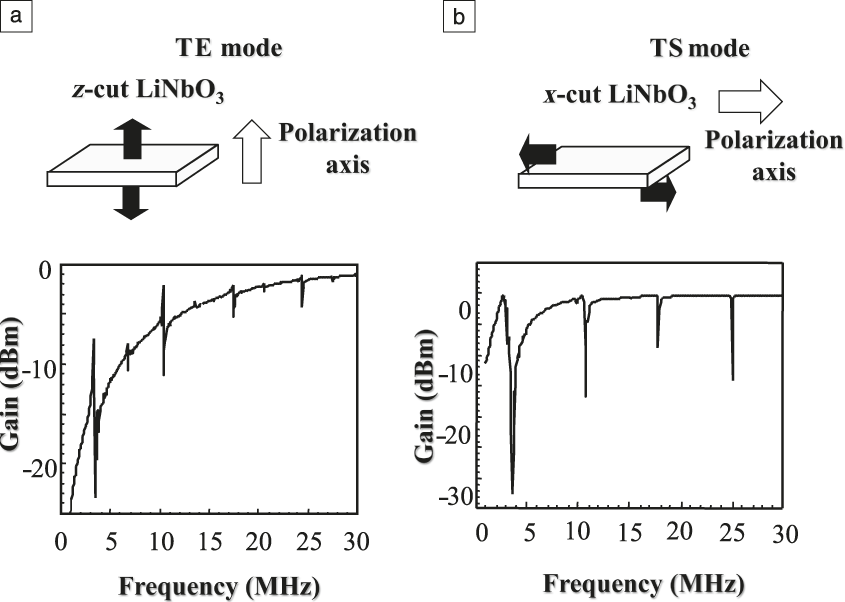
Figure 7 shows the resonance frequencies of a 1.0-mm-thick LN crystal with a polarization axis vertical to the surface (z-LN). The resonance lines are observed at 3.5, 10.5, 17.4, and 24.1 MHz. Based on piezoelectric theory,Reference Ikeda2 the resonance frequency, f(n), of the thickness mode vibration is given by:
 $$f(n) = \{ (2n - 1)/2L\} {({C_\alpha }^E/\rho )^{1/2}}$$,
where n is an integer equal to 1 or greater, C αE is an elastic constant, L is the thickness of the ferroelectric crystal, and ρ is density. Based on the thickness extension elastic constant, C 33E (= 2.45 × 10¹¹ Nm–2) for z-LN and L = 1.0 mm, the f(n) values were calculated to be 3.7, 11.1, 18.4, and 25.8 MHz. This series of frequencies is in good agreement with the experimentally observed values, confirming that the z-LN exhibited the TERO phenomenon, with the vibration mode vertical to the surface.Reference Saito and Inoue32 Figure 8 also shows the resonance frequencies of a 0.5-mm-thick LN crystal with the polarization axis parallel to the surface (x-LN). These resonance frequencies appeared at 3.5, 11.0, 18.3, and 25.8MHz. Using Equation 1 with a thickness shear elastic constant, C 44E(= 0.60 × 10¹¹Nm–2), for x-LN, frequencies of 3.7, 11.1, 18.4, and 25.8 MHz are obtained, all of which match experimental values. This result indicates that x-LN exhibits thickness shear mode resonance oscillation (TSRO) with the vibration mode parallel to the surface.Reference Saito and Inoue32 Thus, different resonance modes can be obtained by changing the direction of the polarization axis of the ferroelectric material.
Resonance frequencies associated with (a) the thickness extension (TE) mode resonance oscillation on z-LiNbO3 (LN) and (b) the thickness shear (TS) mode resonance oscillation on x-LN. The figures show the resonance frequencies due to primary, secondary, tertiary, and quaternary lines, according to n = 1, 2, 3, and 4, respectively, in Equation 1 in the text. The TE and TS modes with lattice displacements perpendicular and parallel, respectively, to the surface can be generated with nearly the same resonance frequencies by changing the thickness of a LiNbO3 ferroelectric crystal. The thickness L of the crystal is 1 mm for z-LN and 0.5 mm for x-LN.Reference Inoue3,Reference Saito and Inoue32

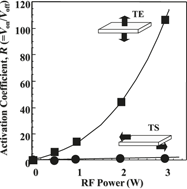
Activation coefficient, R, values for ethanol C2H5OH oxidation on Pd/z-LiNbO3 (LN) (squares, thickness extension [TE] mode resonance oscillation) and Pd/x-LN (circles, thickness shear [TS] mode resonance oscillation) as functions of radio frequency (RF) power at a reaction temperature of 373 K and a resonance frequency of 3.6 MHz. The activation of a Pd catalyst by resonance oscillation occurs only for the resonance mode with thickness extension that causes lattice displacements perpendicular to surface. Note: V on, the catalytic activity with RF on; V off, the catalytic activity with RF off.Reference Inoue3,Reference Saito, Ohkawara, Watanabe and Inoue33

Metal catalysts
Active vibrational modes
During ethanol oxidation on a 100-nm-thick Pd film deposited on z-LN, TERO generation immediately and dramatically increased acetaldehyde production.Reference Saito and Inoue32 This enhanced reactivity was maintained while TERO was in effect and decreased to the original low level after cessation of TERO. The highest catalyst activation observed was a 1880-fold activity enhancement.Reference Saito, Ohkawara, Watanabe and Inoue33 The activation energy for ethanol oxidation decreased from 156 to 12 kJmol–1 in conjunction with TERO. In contrast, a slight increase in acetaldehyde production occurred upon the application of TSRO on a Pd/x-LN specimen. Figure 8 shows changes in the activation coefficient, R, with the RF power employed for RO generation.Reference Inoue3,Reference Saito, Ohkawara, Watanabe and Inoue33 When applying TERO, the R values are seen to significantly increase in a nonlinear manner with increasing RF power, whereas in the case of the TSRO effect, R is essentially independent of RF power.
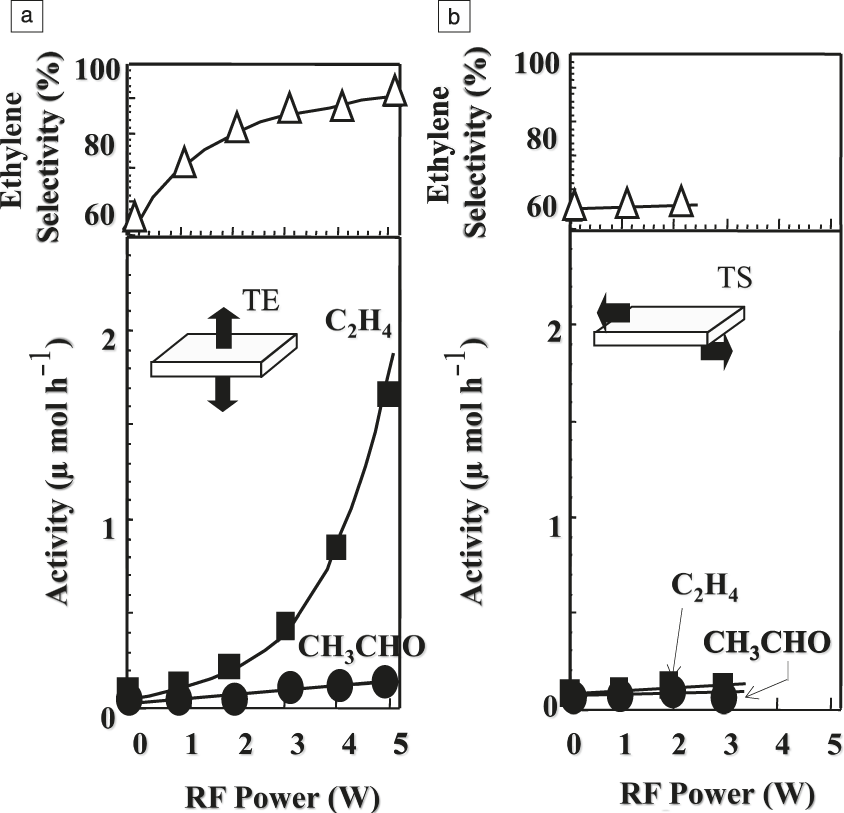
The effects of RO on reaction selectivity were also assessed based on ethanol transformation yielding gaseous ethylene and acetaldehyde as products over a thin-film Ag catalyst deposited on z-LN. When TERO was generated during this reaction, ethylene production increased immediately, whereas acetaldehyde production remained nearly unchanged. Figure 9 summarizes the variations in the catalytic activity as a function of the RF power employed to generate TERO.Reference Saito, Nishiyama, Sato and Inoue5,Reference Saito and Inoue32 The catalytic activity for ethylene production increased significantly in a nonlinear manner with increasing RF power, while the acetaldehyde production remained essentially constant. Thus, the selectivity for ethylene production, S e, increased from 58% (without TERO) to 96%, while the activation energy for ethylene production decreased from 156 to 115 kJmol–1. Thus, applying TERO evidently changed the reaction selectivity by lowering the energy barrier of the reaction path. Interestingly, in similar experiments using the TSRO effect, neither ethylene nor acetaldehyde production was enhanced.
Activities for ethylene (C2H4) and acetaldehyde (CH3CHO) production from ethanol decomposition on Ag as functions of radio frequency (RF) power, in conjunction with (a) thickness extension (TE) mode resonance oscillation and (b) thickness shear (TS) mode resonance oscillation at a reaction temperature of 573 K and resonance frequency of 3.5 MHz. In the TE mode resonance oscillation, the catalytic activity for ethylene production remarkably increased with increasing RF electric power with little enhancement of the activity for acetaldehyde production. This results in a significant increase of the reaction selectivity for ethylene production. On the other hand, the TS mode resonance oscillation causes little enhancement of the catalytic activity for production of both ethylene and acetaldehyde. These results indicate that the lattice displacement perpendicular to the surface has significant effects on the catalyst activation.Reference Inoue3,Reference Saito, Nishiyama, Sato and Inoue5,Reference Saito and Inoue32

Mechanism of the RO effects
Doppler images acquired during the application of TERO exhibit random standing waves, the magnitude of which along the z direction represents lattice displacement vertical to the surface.Reference Saito, Nishiyama, Sato and Inoue5,Reference Saito and Inoue32 The largest displacement measured in prior work was 70 nm at an applied power of 3 W. However, the image generated in conjunction with the TSRO effect appeared as a nearly flat plane consisting of small standing waves less than 3 nm in height. There is therefore a significant difference in vertical lattice displacement between the TERO and TSRO phenomena.Reference Yukawa, Saito, Nishiyama and Inoue34
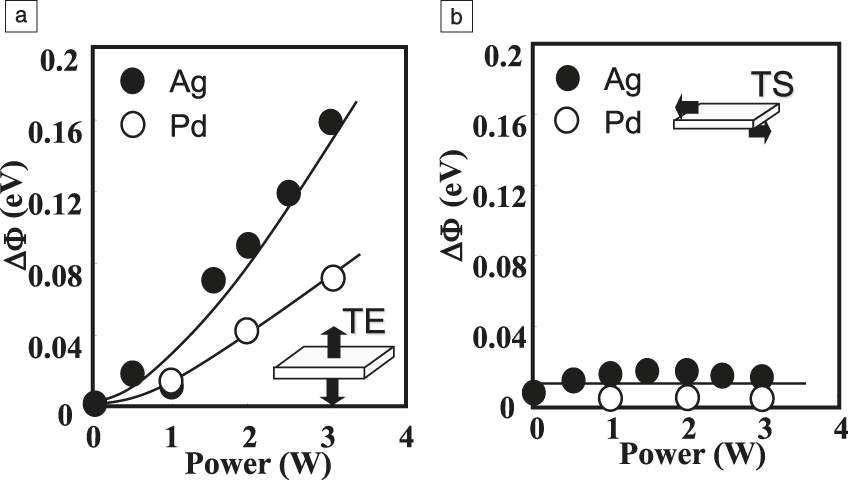
The work function of a metal surface can be obtained by PEEM spectroscopy, by assessing the threshold energy for electron emission. As shown in Figure 10, the threshold energy values of Ag and Pd were both increased nearly in proportion to the RF power employed to generate the TERO effect.Reference Yukawa, Saito, Nishiyama and Inoue35,Reference Saito and Inoue36 The positive shifts in threshold energy induced by the application of TERO are indicative of increases in the work functions of the metals. In contrast, the application of TSRO caused minimal shifts for both metals.
(a) Positive shifts of the work functions Φ of Ag (●) and Pd (○) metal surfaces as functions of radio frequency power in conjunction with thickness extension (TE) mode resonance oscillation. (b) Little changes in the work function with thickness shear (TS) mode resonance oscillation. The results demonstrate that the lattice displacement perpendicular to the surface has prominent effects on increases in the work function.Reference Inoue3,Reference Yukawa, Saito, Nishiyama and Inoue35,Reference Saito and Inoue36

As previously discussed, the work function of a metal surface is determined by the dipole electric layer formed by pairs composed of negative charges (electrons) and positive charges in the interior of the surface.Reference Lang and Kohn7,Reference Smith37 According to this model, the work function is controlled by the density of “spilled out” electrons. Positive work-function shifts are observed only with the vertical lattice displacement induced by the application of TERO. Since this movement is in the same direction as that in which the electrons spill out, it is proposed that the vertical lattice displacement enhances the density of these electrons. In contrast, the TSRO phenomenon generates lattice displacement that is primarily parallel to the surface and with little movement in the vertical direction. Thus, it is not unexpected that this mode has negligible effects on the work function.
The application of TERO during ethanol decomposition results in the selective activation of ethylene production, and this selectivity change can be explained in terms of the work-function increases. It has been proposed that the adsorption of ethanol molecules on metal surfaces proceeds either through the formation of ethoxy species or molecularly chemisorbed ethanol.Reference Kratochwil, Wittmann and Küppers38 In the case of an ethoxy species, the dissociation of H from the hydroxyl group occurs if the C–C bond is oriented perpendicular to the surface, whereas molecularly chemisorbed ethanol has the O–H bond oriented parallel to the surface. Acetaldehyde is primarily produced by the abstraction of an H atom of the CH2 group from the ethoxy species. In contrast, the parallel or inclined conformation of molecularly chemisorbed ethanol permits easier access of an H atom of the CH3 group and the hydroxyl group to the metal surface. This, in turn, facilitates the simultaneous abstraction as water, leading to ethylene formation. Weak electron back donation from the metal surface to the oxygen atom of the ethanol molecule favors molecularly chemisorbed ethanol. Since the degree of electron transfer decreases with an increase in the work function,Reference Somorjai39,Reference Marcel40 the positive shifts in the work functions of Ag and Pd due to the application of TERO favor the formation of weak molecularly chemisorbed ethanol, enhancing the selectivity for ethylene.
Changes in the reaction selectivity with the TERO effect have also been observed for other catalytic reactions. The oxidation of methanol on a Pt catalyst produces methyl formate (HCOOCH3), formaldehyde (HCHO), and carbon dioxide as carbon-containing products. With increases in the RF power used to generate the TERO effect, the selectivity for formaldehyde production, S f, gradually increases from 8% to a maximum of 18% at 0.5 W, then declines to an eventual value of 2% at 3 W.Reference Yukawa, Saito, Nishiyama and Inoue41 Thus, a moderate TERO intensity is preferable if the goal is partial oxidation. A kinetic analysis has shown that the application of TERO raises the concentration of surface oxygen and increases the likelihood of H abstraction from adsorbed methoxy species.Reference Peremans, Maseri, Darville and Gilles42–Reference Rebholz, Matolin, Prins and Kruse46 This reaction can be summarized as:Reference Davis and Barteau47,Reference Davis and Barteau48
 $$C{H_3}O(a) + O(a) \to HCHO(a) + OH(a)$$,
where (a) denotes the adsorbed states. This promotes formaldehyde production. However, as the power used to provide the TERO increases, the surface oxygen concentration becomes high enough to promote further oxidation, leading to the production of formate, which, in turn, decomposes to produce CO2 and H2, and lowers the selectivity for the partial oxidation product.Reference Endo, Matsumoto, Kubota, Domen and Hirose49 The reaction equations are:
 $$HCHO(a) + O(a) \to HCOO(a) + H(a)$$
and
 $$HCOO(a) \to C{O_2}(g) + H(a)$$.
On this basis, it has been proposed that dynamic vertical lattice displacement due to the TERO and SAW effects is the key factor in activating reactions on metal surfaces.
Resonance frequency
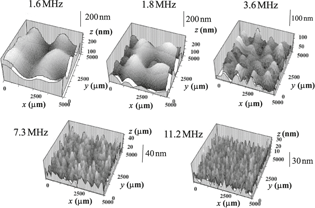
The majority of the effects of applying the TERO phenomenon have been studied at a single primary resonance frequency of 3.5 MHz. However, based on Equation 1, changing the thickness of a ferroelectric crystal can shift the primary resonance frequency. Figure 11 presents Doppler images of standing waves for a variety of frequencies from 1.6 to 11.2 MHz.Reference Yukawa, Saito, Nishiyama and Inoue50 Large, broad peaks are evident over the range of 1.6–1.8 MHz, together with a lower density of standing waves. At 3.6 MHz, the number of standing waves increases while the magnitudes decrease considerably. Over the range of 7.3–11.2 MHz, a large number of small waves appear. The application of low frequencies evidently results in large lattice displacements but low densities, whereas high frequencies have the opposite effect.
Doppler patterns obtained from the application of the thickness extension mode resonance oscillation effect with resonance frequencies ranging from 1.6 to 11.2 MHz at a radio frequency power of 1 W.Reference Yukawa, Saito, Nishiyama and Inoue50 There is a trade-off relation between the density and the magnitude of the waves—with increasing resonance frequency, the density of the waves tremendously increases, but the magnitude of the waves decreases.

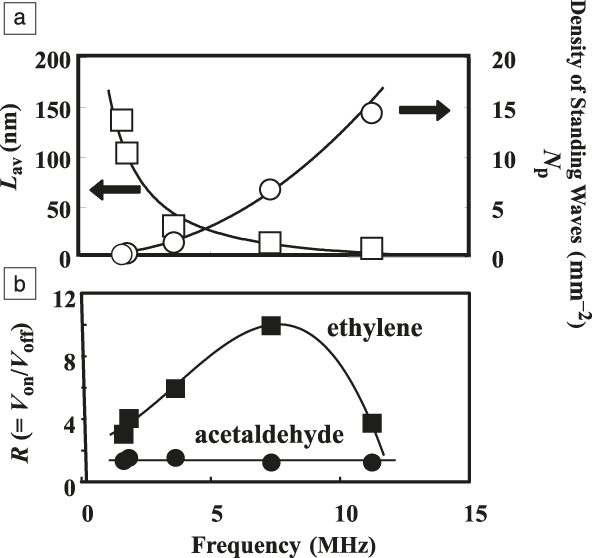
The activation coefficient, R e, for ethylene production from ethanol decomposition on Ag varies along with the resonance frequency. As shown in Figure 12, resonance frequencies of 1.6, 1.8, 3.6, 7.3, and 11.2 MHz produced R e values of 3.1, 4.1, 6.0, 10.0, and 3.8, respectively.Reference Yukawa, Saito, Nishiyama and Inoue50 The highest activation value for ethylene production was therefore obtained at 7.3 MHz. Conversely, the activation coefficient, R a, for acetaldehyde production was nearly constant, with values within the range of 1.3–1.6. These findings indicate that the highest R e is obtained under optimal conditions at which both the magnitude and density of the standing waves are moderate. A similar effect of frequency on activity was also obtained when overtone resonance frequencies were used.Reference Saito and Inoue51
(a) Average lattice displacement, L av, and density of standing waves, N p, as functions of resonance frequency, and (b) a comparison of the activation coefficients, R, for C2H4 (■) and CH3CHO (●) production. (b) With increasing resonance frequency, the catalyst activation, R, for acetaldehyde production remains nearly unchanged, but that for ethylene production has a maximum at the middle of the resonance frequency. (a) The magnitude of lattice displacement perpendicular to the surface caused by the waves due to a thickness extension mode resonance oscillation decreases remarkably, whereas the density of the waves (N p) increases. Thus, a comparison of these results demonstrates that the highest catalyst activation for ethylene production is achieved at the optimum conditions for both the magnitude and density of the lattice displacement. Note: V on, catalytic activity with radio frequency on; V off, catalytic activity with radio frequency off.Reference Inoue3,Reference Yukawa, Saito, Nishiyama and Inoue50,Reference Saito and Inoue51

Metal oxide catalysts
During CO oxidation by NiO, the TERO phenomenon has been shown to immediately increase the catalytic activity for CO2 production by a factor of 3.6 and lower the activation energy from 105 to 63 kJmol–1. The same reaction on the n-type semiconductor oxide TiO2 showed an activation coefficient of 7.6 and a decrease in activation energy from 94 to 40 kJmol–1. Thus, the TERO effect activates both n- and p-type semiconductor metal oxides, and its effects are greater for TiO2 than for NiO.Reference Saito, Sakamoto, Nishiyama and Inoue52
As previously noted, the SAW interacts with charges in the metal oxides. In view of the similar vertical lattice displacements induced by the SAW and TERO effects, it is likely that the interactions of the TERO with charge carriers in metal oxides are associated with the activation of these materials. Over the RF power range examined, the vertical lattice displacement caused by the TERO was smaller for TiO2 than for NiO, which is indicative of greater interactions of the TERO with charge carriers in the TiO2. This explains the more significant catalyst activation in the case of the TiO2. A remarkable activation of ethanol decomposition on WO3 has also been reported as a result of the TERO effect.Reference Saito, Nishiyama, Sato and Inoue53 The activation energy for ethylene production decreased from 115 to 64 kJmol–1, whereas that for acetaldehyde production from 46 to 21 kJmol–1.
Immobilized enzymes
In the case of enzymatic catalysts immobilized on a ferroelectric substrate, the effects of the RO of bulk acoustic waves are different from those seen in metal and metal oxide catalysts. In one study, glucose oxidase (GOD) was immobilized by covalent coupling on a ferroelectric lead zirconate titanate substrate. Under these conditions, the TERO phenomenon immediately increased the catalytic activity of the immobilized GOD by a factor of 2–3, while stopping the TERO retained 80–90% of the enhanced activity.Reference Nishiyama, Kazui and Inoue54,Reference Nishiyama, Watanabe and Inoue55 This irreversible activity enhancement is in contrast to the reversible changes observed for metal and metal oxide catalysts. The enhanced activity was decreased to the original activity level if the activated GOD was exposed to a glucose substrate-free solution, and these activations and deactivations could be repeated. These results suggest that the presence of the glucose substrate was essential for TERO-induced GOD activation and preservation of the increased activity level. The TERO strengthened the interactions of the active sites of the immobilized enzyme with the glucose substrate and hence promoted the formation of an activated complex. It seems likely that the vertical dynamic lattice distortion resulting from TERO provided the surface-bound enzyme structure with increased relaxation and freedom modes, thus enhancing the interactions between the glucose molecules and the immobilized enzyme.
Similar TERO effects have been observed for a variety of immobilized enzymes, including galactose oxidase, D-amino acid oxidase, and L-amino acid oxidase.Reference Nishiyama, Watanabe and Inoue56 Furthermore, acoustic wave enhancement has also been observed for a metal complex catalyst adsorbed on a ferroelectric substrate.Reference Nishiyama, Asari and Inoue57
Conclusion
The effects of SAWs and RO on the physical and chemical properties of surfaces were reviewed. Acoustic waves have been shown to increase the work functions of low-index flat metal surfaces, but decrease the work functions of high-index rough planes and step sites. The extent of CO chemisorption on Cu metal surfaces varies with the application of acoustic waves, and this effect varies with changes in the surface structure. The catalysis of ethanol oxidation on Pd and Cu metal surfaces is accelerated by acoustic waves, and a single reaction path can be selectively promoted during either ethanol on Ag and Cu metal surfaces or methanol decomposition on a Pt metal surface. The effects of acoustic waves have been found to result from periodic lattice displacement vertical to the surface, but a more detailed theoretical understanding is still required to clarify the exact activation mechanisms associated with SAWs and RO. The catalyst activation calculated is as much as a factor of ∼107, provided that the surface atoms are thoroughly activated by one lattice displacement period at 20 MHz.Reference Inoue3 The highest activity enhancement observed was factors of 102 ∼ 2 × 10³, and thus it is evident that acoustic enhancement shows significant promise as a means of artificially enhancing the chemical properties of metal surfaces.

Yasunobu Inoue is a research fellow at the R&D Laboratory, ARPChem, Hongo Campus, The University of Tokyo, Japan. He was previously employed as a faculty member at the Nagaoka University of Technology, Japan. He received his PhD degree in chemistry from the Tokyo Institute of Technology, Japan. In 2002, he received an award for academic achievement from the Catalysis Society of Japan. Inoue received the title of Professor Emeritus at Nagaoka University of Technology. His current research focuses on the generation of solar hydrogen by photocatalysis. Inoue can be reached by email at yasinoue@chemsys.t.u-tokyo.ac.jp.