Implications
Interactions of dietary components may be used as an important tool to stimulate voluntary feed intake and milk production in lactating dairy cows. This study investigated the influence of the maturity of the grass used to prepare silage (early- v. late-cut) and the nature of the concentrate starch source (barley v. maize) on animal performance and rumen degradation characteristics, and examined the interactions between these variables. No effects of interaction between diet components in terms of forage digestibility and concentrate starch source were observed on intake and animal performance in dairy cows. Both concentrate starches had comparable effects on animal performance, but cows fed silage made from early-cut grass greatly improved their feed intake and milk production.
Introduction
Feed intake in dairy cows is known to be chiefly regulated by both physical and metabolic mechanisms. Forage is believed to regulate feed intake via physical factors related to the distension of the reticulo-rumen (Allen, Reference Allen2000). However, there were reported reductions in the rumen fill per unit of NDF with improving digestibility of grass silage (Gasa et al., Reference Gasa, Holtenius, Sutton, Dhanoa and Napper1991; Rinne et al., Reference Rinne, Jaakkola, Kaustell, Heikkilä and Huhtanen1999; Kuoppala et al., Reference Kuoppala, Ahvenjarvi, Rinne and Vanhatalo2009), prompting the suggestion that cows’ intake of diets based on highly digestible grass silages and barley-based concentrates is not limited only by physical factors but may also be limited by metabolic factors or by the cows’ ability to utilize energy. In addition, there is a substitution effect that is related to the intake potential of the grass silage, which causes forage intake to decrease as the concentrate inclusion increases (Huhtanen et al., Reference Huhtanen, Rinne and Nousianen2008a). This substitution effect is found to be stronger for highly digestible grass silages with high intake potentials (Keady et al., Reference Keady, Mayne and Kilpatrick2004; Huhtanen et al., Reference Huhtanen, Rinne and Nousianen2008a). This finding emphasizes the importance of metabolic factors in limiting the feed intake of cows fed high-quality forage.
Starch is an important diet component for high-yielding dairy cows. Barley starch is reported to be degraded rapidly and is associated with the rapid production and absorption of metabolites in the rumen of dairy cows (Nocek and Tamminga, Reference Nocek and Tamminga1991; Silveira et al., Reference Silveira, Oba, Beauchemin and Helm2007), both of which can be indicative for metabolic intake regulation. The rumen fermentation rate of maize starch is slower than that of barley (Nocek and Tamminga, Reference Nocek and Tamminga1991; Mills et al., Reference Mills, France and Dijkstra1999; Tothi et al., Reference Tothi, Lund, Weisbjerg and Hvelplund2003), which can reduce the rate of metabolite absorption. Moreover, the degradation of maize starch may be so slow that it does not completely undergo fermentation in the rumen (McCarthy et al., Reference McCarthy, Klusmeyer, Vicini, Clark and Nelson1989) and is instead digested post-ruminally or excreted in faeces. If digested in the small intestine, it would increase its efficiency as a source of energy for milk production (Reynolds, Reference Reynolds2006). Previous studies have reported that feeding maize-based concentrates resulted in greater dry matter intake (DMI) than barley-based concentrates for alfalfa- and maize silage-based diets (McCarthy et al., Reference McCarthy, Klusmeyer, Vicini, Clark and Nelson1989; Overton et al., Reference Overton, Cameron, Elliott, Clark and Nelson1995). The importance of the interactions between qualities of fibre and starch in studies of intake regulation has been highlighted in a review of Reynolds (Reference Reynolds2006), suggesting that the positive interactions may result in improved DMI and animal performance in terms of milk production (Dixon and Stockdale, Reference Dixon and Stockdale1999). Despite the expected beneficial effects on intake and performance, few studies have been reported in which the interaction effects between concentrate starch source and forage digestibility have been examined when fast-degrading starch from barley was replaced with slow-degrading starch from maize in high or medium digestibility grass silage-based diets.
A strategy to reduce the potential negative effects of high concentrations of starch in the rumen is to utilize total mixed rations (TMR) instead of feeding the concentrates separately (Reynolds, Reference Reynolds2006). Hetta et al. (Reference Hetta, Tahir and Swensson2010) found relatively low substitution effect on forage intake when the proportions of wheat grain inclusion were raised in maize- and grass silage-based diets, and suggested that the TMR feeding regime might be beneficial for promoting high forage intake in diets with high concentrations of starch. It is therefore hypothesized that the intake of highly digestible grass silages could be stimulated by replacing barley with maize and feeding diet components as TMR.
The objectives of the present study were to investigate the effects of cutting period of ensiled grass (early- v. late-cut) and concentrate starch source (barley v. maize) on the performance and rumen degradation characteristics of dairy cows, and to examine interactions, between these variables.
Material and methods
Grass silage and concentrate feeds
Two grass silages with different expected digestibilities were used: early- and late-cut silage. Both were prepared from herbage from the primary growth of a 3rd year ley of Timothy grass (Phleum pratense L. cv. Grindstad) harvested on 12 and 26 June in 2008, at the experimental farm of Röbäcksdalen of the Swedish University of Agricultural Sciences, Umeå, Sweden (63°45′N; 20°17′E). The forages were mown with a disc mower conditioner (Kverneland Ta 339, Kverneland Group Operation Norway AS, Kverneland, Norway), wilted for 10 h, and then chopped with a precision chopper (JF-Fabrikken, Sønderborg, Denmark) with a nominal cutting length of 20 mm. A silage additive, PROENS™ (which contains formic acid (600 to 660 g/kg) and propionic acid (230 to 290 g/kg); Perstorp Speciality Chemicals AB, Perstorp, Sweden), was applied at a level of 4 l/tonne of fresh matter during chopping. The chopped fresh matter was ensiled in bunker silos (width 3.5 m, height 1.7 m and length 11.5 m), covered with plastic layers, and stored for at least 180 days before opening.
The concentrate feeds were based on barley or maize and soya bean meal. The barley-based concentrate had the following ingredient compositions (g/kg): 945 barley, 8 NaCl, 13 lime, 18 fat, 10 Akofeed Standard and 5 vitamin mineral premix. The maize-based concentrate consisted of (g/kg): 681 maize, 203 barley fibre (Altia Ltd, Koskenkorva, Finland), 55 soya bean meal, 20 molasses, 8 NaCl, 18 lime, 10 Akofeed Standard and 5 vitamin mineral premix. Soya bean meal and barley fibre were included in the maize-based concentrate in order to approximate the CP and NDF concentrations of the barley-based concentrate. The pelletized compound feeds were crushed in a feed mill after processing to reduce diet selection in the TMR.
Animals, diets, feeding and experimental design
The animal experiments were conducted with the permission of the Swedish Ethical Committee on Animal Research. The feeding experiment was conducted between mid-February and early June in 2009. Twenty-eight multiparous dairy cows (Swedish Red) were housed in an insulated loose housing system. The animals averaged 133 ± 45 (mean ± s.d.) days in milk (DIM), had a live weight of 624 ± 69 kg and an initial milk yield (MY) of 30 ± 4 kg energy corrected milk (ECM; Baevre et al., Reference Baevre, Junkkarinen, Pedersen, Setälä and Sjaunja1988). Each of the animals was allocated to one of seven balanced 4 × 4 Latin squares in a changeover design, with a 2 × 2 factorial arrangement of experimental treatments. To minimize the impact of carryover effects, no single sequence of two treatments occurred more than once during the experiment. Animals were allocated to squares in ascending order of DIM, and the initial diets of the cows in each square were assigned at random. Each period spanned 21 days (except for the 2nd period, which spanned 28): the first 14 days were used for adaptation and the final seven were used for data recording and sample collection. The experimental diets consisted of four TMR consisting of early-cut grass silage (EGS) supplemented with either barley- (EB) or maize-based concentrate (EM) or late-cut grass silage (LGS) supplemented with either barley- (LB) or maize-based concentrate (LM). All diets were formulated to contain the same starch concentration and a forage : concentrate ratio of 51 : 49 on a dry matter (DM) basis. The CP, NDF and metabolizable energy (ME) concentrations were balanced in all diets based on the same type of silage.
Diet components were mixed for 7 min (Nolan A/S, Viborg, Denmark) and distributed to the cows via feeding troughs (Roughage Intake Control™ feeders; Insentec B. V. Marknesse, The Netherlands) that were filled at 0600, 1200 and 1800 h. The diets were offered ad libitum and daily feed intake was recorded for individual animals for every visit. The weights of feed in each feeding trough were continuously monitored using a computerized system. The feeding levels were adjusted on the basis of the previous day's consumption in order to achieve <5 kg refusals per day and thus ensure ad libitum feeding. The residual feed from the feeding troughs was removed once per day, at 0545 h.
In situ degradation profiles
In situ NDF degradation parameters for all feed samples were determined according to the NorFor standards (Åkerlind et al., Reference Åkerlind, Weisbjerg, Eriksson, Tøgersen, Udén, Ólafsson, Harstad and Volden2011). In brief, dried (60°C) and milled (2-mm screen; SM 2000, Retsch GmbH, Haan, Germany) feed samples, pooled across periods, were incubated in triplicate in heat-sealed nylon (Saatitech S.P.A., 22070 Veiano, Como, Italy) bags (pore size 38 μm) in the rumen of each of three rumen-cannulated (Bar Diamond, Parma, ID, USA) dry Danish Holstein dairy cows. Cows were fed (kg/day): 2.0 spring barley straw, 4.0 artificially dried grass hay, 2.8 concentrate (concentrate composition g/kg: 30 rapeseed meal, 100 soya bean meal, 400 barley, 400 oats, 30 beet molasses and 40 mineral mixtures); and 0.150 kg vitamin mix per week. Ration chemical composition (g/kg DM) was 139 CP, 465 NDF and 137 starch. For incubations lasting 0, 2 or 4 h, 0.5 g of samples was used; 0.75 g was used for 8 h and 1.0 g was used for 16, 24, 48, 96 or 168 h incubations. At the end of each incubation interval, the bags were washed with tap water and stored at −18°C. After all the bags had been removed, they were thawed and washed in a washing machine twice for 12 min each with tap water (25°C). The residues remaining after incubation were filtered into glass filter crucibles and analysed for ash-free α-NDF using a Fibertec™ 2010 apparatus (Foss A/S, Hilleroed, Denmark) according to the method of Mertens et al. (Reference Mertens, Allen, Carmany, Clegg, Davidowicz, Drouches, Frank, Gambin, Garkie, Gildemeister, Jeffress, Jeon, Jones, Kaplan, Kim, Kobata, Main, Moua, Paul, Robertson, Taysom, Thiex, Williams and Wolf2002).
The DM and starch degradation parameters of the concentrate feeds were determined in a similar way as those for NDF. Sub-samples of 0.5 g were incubated for 0, 2 or 4 h, and sub-samples of 1.0 g were incubated for 8, 16, 24, 48 or 72 h. After incubation, the residues within the bags were dried at 100oC for 24 h to determine DM loss. The starch concentration of the residues was measured quantitatively according to the method of Bach Knudsen (Reference Bach Knudsen1997).
The water solubility of the DM fraction of feeds was determined by soaking samples in tap water for an hour at room temperature and filtering through filter paper with a retention value of 2 (Whatman AGF 607-90 mm; Frisenette, Ebeltoft, Denmark). The residues were then washed four times with deionized water and dried at 105°C for 16 h.
In vitro gas production (GP) recordings
The feeds’ in vitro degradation parameters were determined using an automated GP and measuring system. The analyses were carried out using duplicate samples of 0.5 g DM (1-mm screen) in two runs (four replicates in total for each feed). The samples were incubated for 72 h at 39oC in 250 ml serum bottles (Schott, Mainz, Germany), which had previously been flushed with CO2 and contained 60 ml of buffered rumen fluid (Menke and Steingass, Reference Menke and Steingass1988). The bottles were placed in a water bath, shaken continuously (40 r.p.m.) and connected to an automated recording and measuring system as described by Cone et al. (Reference Cone, VanGelder, Visscher and Oudshoorn1996). The rumen fluid was collected in the morning, 2 h post feeding, from two rumen-cannulated (Bar Diamond Inc., Parma, ID, USA) lactating dairy cows fed on a grass silage-based diet supplemented with whole-crop barley silage. The incubations were terminated by putting the bottles on ice, and the residues were filtered into glass filter crucibles and analysed for NDF concentration (Chai and Udén, Reference Chai and Udén1998). True organic matter digestibility (TOMD) was calculated as described by Hetta et al. (Reference Hetta, Cone, Bernes, Gustavsson and Martinsson2007).
Feed and TMR sampling, analyses and calculation of feeding values
Dry feeds were sampled once during each period, dried at 60°C for 48 h and milled through a 1-mm screen in a cutter mill (SM 2000, Retsch GmbH). Sub-samples of all feeds were analysed for DM (Association of Official Analytical Chemists (AOAC), 1984; method 7.003), ash (525°C for 6 h; AOAC 1984; method 923.03), CP (AOAC 1984; method 7.015), crude fat (AOAC 1984; method 7.062) and starch and water-soluble carbohydrate (WSC) concentrations (Larsson and Bengtsson, Reference Larsson and Bengtsson1983). The ash-free NDF concentration was determined using the method of Chai and Udén (Reference Chai and Udén1998) with the addition of sodium sulphite and amylase. Indigestible NDF (iNDF) concentrations were determined in triplicate by incubating samples in nylon bags (12 μm pore size and effective surface area of ∼100 cm2) in the rumen of each of three rumen-cannulated dry dairy cows during 288 h (the same cows used as for the in situ NDF degradation profiles) and then determining the α-NDF concentration of the residues using the same procedure as for the other α-NDF concentrations (Mertens et al., Reference Mertens, Allen, Carmany, Clegg, Davidowicz, Drouches, Frank, Gambin, Garkie, Gildemeister, Jeffress, Jeon, Jones, Kaplan, Kim, Kobata, Main, Moua, Paul, Robertson, Taysom, Thiex, Williams and Wolf2002). The ME of the concentrate feeds, the supply of amino acids absorbed in the small intestine (AAT) and the protein balance in the rumen (PBV) were calculated using the Swedish version (Spörndly, Reference Spörndly2003) of the Nordic protein evaluation system (Madsen et al., Reference Madsen, Hvelplund, Weisbjerg, Bertilson, Olsson, Spörndly, Harstad, Volden, Tuori, Varvikko, Huhtanen and Olafsson1995). The concentration of potentially digestible NDF (pdNDF; g/kg DM) was calculated as NDF–iNDF, whereas that of non-fibrous carbohydrates (NFC) was calculated according to National Research Council (2001). Samples of grass silage were collected weekly, pooled per period and stored at −20°C before chemical analyses. In addition to the analyses described above, silage samples were analysed for DM (AOAC, 1984; method 7.003), pH, the concentrations of lactic acid, acetic acid (Andersson and Hedlund, Reference Andersson and Hedlund1983), NH3-N (the volatile N fraction in silage juice, judged using a Kjeltech Autosystem 1030; Tecator AB, Höganäs, Sweden) and ME, calculated from in vitro organic matter digestibility (OMD) data (Lindgren, Reference Lindgren1979).
Milk and faecal sampling, analyses and determination of in vivo digestibility
The cows were milked twice daily at 0600 and 1500 h; the yield was recorded using gravimetric recorders (S.A. Christensen & Co., Kolding, Denmark). Milk samples were collected on days 19 and 20 of each period as two samples that were pooled on a daily basis from two morning and two evening milkings. Milk samples were analysed for fat, protein, lactose and urea concentrations using IR spectroscopy (CombiFoss, MilkoScan 4000, Foss A/S).
Faecal samples were collected by rectal grab sampling on four consecutive occasions (two mornings and two evenings) on days 20 and 21 of each experimental period, and pooled. The faecal samples were collected from the cows in two experimental squares and stored at −20°C. The faeces were then thawed, pre-dried (60°C), milled (2-mm screen) and analysed for ash-free α-NDF (Mertens et al., Reference Mertens, Allen, Carmany, Clegg, Davidowicz, Drouches, Frank, Gambin, Garkie, Gildemeister, Jeffress, Jeon, Jones, Kaplan, Kim, Kobata, Main, Moua, Paul, Robertson, Taysom, Thiex, Williams and Wolf2002), iNDF (during 288 h rumen incubations) and starch concentrations (Bach Knudsen, Reference Bach Knudsen1997). In vivo digestibilities of DM, OM, NDF and starch (DMD, OMD, NDFD (NDF digestibility) and StD, respectively) were estimated using iNDF as an internal marker.
Data treatment and curve fitting
The in situ degradation data were divided into particle loss or washable fraction (a; the 0 h values for samples that had only been washed) and non-washable fraction. The non-washable fraction was further divided into potentially degradable (b) and indigestible fraction (I), represented as the disappearance and residue at final incubation interval, respectively. Further, the data were corrected for the a-fraction at each incubation interval, assuming the same rate of degradation for particles lost in washing to that of particles remained in the nylon bags (Hvelplund and Weisbjerg, Reference Hvelplund and Weisbjerg2000). The corrected in situ degradation data were fitted to a first-order kinetic model:
 $${{Y}_t}\,{\rm{ = }}\,b\times {\rm{(1 - exp( - kd}}\times t{\rm{))}}$$
The model was fitted using Table Curve 2D (ver. 5.0® SPSS Inc.). Yt denotes the degraded fraction at a given time t and kd denotes the fractional degradation rate of fraction b. Effective ruminal degradability (ED) was calculated as ED = a + b × kd/(kd + kp), assuming the fractional rate of passage (kp) to be 0.03 and 0.05/h for forages and concentrates, respectively, as used in several protein evaluation systems (e.g. Madsen et al., Reference Madsen, Hvelplund, Weisbjerg, Bertilson, Olsson, Spörndly, Harstad, Volden, Tuori, Varvikko, Huhtanen and Olafsson1995; Hvelplund and Weisbjerg, Reference Hvelplund and Weisbjerg2000).
The recorded GP volumes were adjusted to the normal air pressure and averaged within each run for each feed. A two-pool Gompertz model (Schofield et al., Reference Schofield, Pitt and Pell1994) constructed using the NLIN procedure in SAS (SAS®, 2002. User's guide, version 9.2, SAS Institute Inc., Cary, NC, USA) was fitted to the gas data and model-predicted GP kinetic parameters were used to calculate first-order GP rates as described by Huhtanen et al. (Reference Huhtanen, Seppäla, Ots, Ahvenjärvi and Rinne2008b). The following assumptions were made to the original modelling approach of Huhtanen et al. (Reference Huhtanen, Seppäla, Ots, Ahvenjärvi and Rinne2008b) for the concentrates feeds; the rumen residence time was assumed to be 30 h, which is the value reported for sheep fed at the maintenance level, and a distribution of 0.20 : 0.80 in the rumen residence time between the non-escapable and escapable pool, respectively, was made.
Statistical analysis
The statistical analyses were performed using the GLM procedure of Minitab® 16.1.1.0. Feed compositions were calculated as means of the feed analyses for each period. The mean composition of the diets was calculated from actual intakes and analysis of individual feed components. Production responses were calculated using the animal period (n = 112) as the experimental unit, using the model:
 $${{Y}_{ijklm}}\,{\rm{ = }}\,\mu \,{\rm{ + }}\,{{P}_i}\,{\rm{ + }}\,{{S}_{qj}}\,{\rm{ + }}\,{{C}_k}{\rm{(}}{{S}_{qj}}{\rm{)}}\,{\rm{ + }}\,{{T}_l}\,{\rm{ + }}\,{{E}_{ijkl}}$$
where Yijklm is the dependent variable, μ is the overall mean, Pi is the effect of period i, Sqj is the effect of square j, Ck(Sqj) is the effect of cow k within square j, Tl is the effect of treatment l and Eijkl is the residual error. Results were presented as least square means with standard error of the means (s.e.) and were considered statistically significant when the P-value was ≤0.05. The sum of squares for experimental diets were further divided into single degree of freedom orthogonal comparisons of the effects of starch (Sl) source (barley v. maize), stage of maturity (Dm) of grass silage (early- v. late-cut) and their interactions (starch source v. plant maturity) with the model presented below:
 $${{{Y}_{ijklmn}}\, {\rm{ = }}\,\mu \,{\rm{ + }}\,{{P}_i}\,{\rm{ + }}\,{{S}_{qj}}\,{\rm{ + }}\,{{C}_k}{\rm{(}}{{S}_{qj}}{\rm{)}}\,{\rm{ + }}\,{{S}_l}\,{\rm{ + }}\, {{D}_m}\cr\quad{\rm{ + }}\,{{{\rm{(}}S\times D{\rm{)}}}_{lm}}\,{\rm{ + }}\,{{E}_{ijklm}}$$
Results
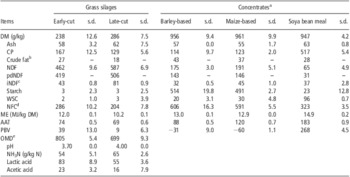
The mean chemical compositions of the ingredients are presented in Table 1. The CP, NDF, pdNDF, starch, ME and NFC concentrations of the two cereal concentrates were similar. Compared with the EGS, the use of more mature grass in the late-cut silage resulted in greater concentrations of DM, NDF, pdNDF, iNDF and NH3N in total N and less concentrations of CP, NFC and lactic acid. The calculated ME, AAT, PBV and in vitro OMD values were less for late-cut than for EGS. The maize-based concentrate had a greater calculated AAT and less PBV than barley-based concentrate.
Mean chemical composition and feeding values of the ingredients (n = 4), and fermentation quality of grass silage

DM = dry matter; pdNDF = potentially digestible NDF; iNDF = indigestible NDF; WSC = water-soluble carbohydrates; NFC = non-fibrous carbohydrates; ME = metabolizable energy; AAT = amino acids absorbed in the small intestine; PBV = protein balance in the rumen; OMD = organic matter digestibility.
The values are expressed as g/kg DM unless otherwise stated; s.d. represents the standard deviation around the mean.
aIngredient composition of both barley- and maize-based concentrates has been described in the section ‘Material and methods’.
bChemical composition determined for a pooled sample from all periods.
ciNDF determined for a pooled sample from all periods during 288 h in situ incubation using nylon bags.
dNFC calculated as (g/kg DM) = 1000 − (CP + NDF + crude fat + ash) according to National Research Council (2001).
ePredicted in vivo OMD (g/kg OM) from determination of in vitro OMD, according to Lindgren (Reference Lindgren1979).
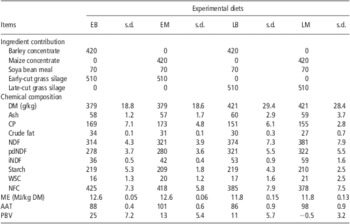
The mean chemical composition of the experimental diets and the contributions of their individual ingredients are presented in Table 2. All diets based on same silage type had similar DM, CP, NDF and starch concentrations, and similar calculated NFC and ME values. As expected from the chemical compositions of their ingredients, the diets containing maize-based concentrate (M diets) had a greater estimated concentration of AAT and a lower estimated concentration of PBV than did diets containing barley-based concentrate (B diets).
Ingredient contributions and mean chemical compositions (n = 4) of experimental TMR

TMR = total mixed rations; EB = TMR based on early-cut grass silage supplemented with barley-based concentrate; EM = TMR based on early-cut grass silage supplemented with maize-based concentrate; LB = TMR based on late-cut grass silage supplemented with barley-based concentrate; LM = TMR based on late-cut grass silage supplemented with maize-based concentrate; DM = dry matter; pdNDF = potentially digestible NDF; iNDF = indigestible NDF; WSC = water-soluble carbohydrates; NFC = non-fibrous carbohydrates; ME = metabolizable energy; AAT = amino acids absorbed in the small intestine; PBV = protein balance in the rumen.
The values are expressed as g/kg DM unless otherwise stated.
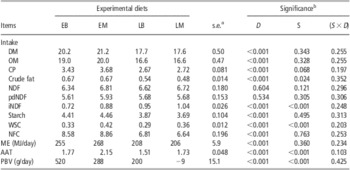
The feed intakes are presented in Table 3. The cows offered diets containing EGS had significantly greater (P < 0.001) intakes of total DM, OM, CP, starch and calculated NFC and ME than those offered LGS diets. However, no statistical differences in the intakes of these components were observed with respect to concentrate starch source. The intakes of WSC and calculated AAT were also greater (P < 0.001) on EGS than on LGS diets and also on M than on B diets (P < 0.001). The calculated PBV intake was greater (P < 0.001) for EGS than for LGS diets and also for B than for M diets (P < 0.001). The intake of NDF was not affected by the nature of the experimental diets. Interaction effects between forage digestibility and concentrate starch source for the intake of nutrients were not significant.
Effects of the maturity of the silage grass and concentrate starch source on the intake of nutrients

TMR = total mixed rations; EB = TMR based on early-cut grass silage supplemented with barley-based concentrate; EM = TMR based on early-cut grass silage supplemented with maize-based concentrate; LB = TMR based on late-cut grass silage supplemented with barley-based concentrate; LM = TMR based on late-cut grass silage supplemented with maize-based concentrate; DM = dry matter; OM = organic matter; pdNDF = potentially digestible NDF; iNDF = indigestible NDF; WSC = water-soluble carbohydrates; NFC = non-fibrous carbohydrates; ME = metabolizable energy; AAT = amino acids absorbed in the small intestine; PBV = protein balance in the rumen.
The values presented are least square means (n = 28) and expressed in kg/day unless otherwise stated.
aStandard error of mean, calculated as n = 28.
bD = effect of stage of maturity of grass silage (early- v. late-cut), S = effect of starch source (barley v. maize) and (S × D) = effect of interactions (starch source × plant maturity).
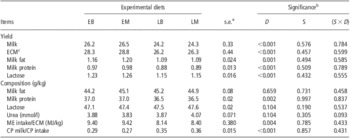
Milk production and composition data are presented in Table 4. The EGS diets significantly improved (P < 0.001) the production of milk, ECM, milk protein, lactose and fat (P = 0.001) compared with the LGS diets. However, no statistical differences in the yields of these components were observed with respect to concentrate starch source. The concentrations of milk fat, lactose and urea were not affected by the experimental diets, although an increased milk protein concentration (P = 0.002) and a trend for decreased (P = 0.104) lactose and urea concentrations was observed on EGS diets. Compared with LGS, EGS diets had a greater (P = 0.004) ME intake per kg ECM production but a less (P < 0.001) milk N efficiency (MNE); however, these were not affected with respect to concentrate starch source. There was no evidence of the interactions of the diet components for milk parameters.
Effects of the maturity of the silage grass and concentrate starch source on milk production and feed utilization

EB = TMR based on early-cut grass silage supplemented with barley-based concentrate; EM = TMR based on early-cut grass silage supplemented with maize-based concentrate; LB = TMR based on late-cut grass silage supplemented with barley-based concentrate; LM = TMR based on late-cut grass silage supplemented with maize-based concentrate; ECM = energy-corrected milk.
The values presented are least square means (n = 28) and expressed in kg/day unless otherwise stated.
aStandard error of mean, calculated as n = 28.
bD = effect of stage of maturity of grass silage (early- v. late-cut), S = effect of starch source (barley v. maize) and (S × D) = effect of interactions (starch source × plant maturity).
cECM yield calculated according to Baevre et al. (Reference Baevre, Junkkarinen, Pedersen, Setälä and Sjaunja1988).
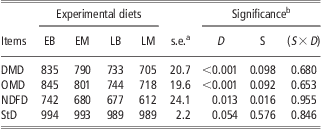
Total digestibility data are presented in Table 5. The apparent total DMD and OMD were significantly greater (P < 0.001) for EGS than LGS diets, but were insensitive to the nature of the grain source. The NDFD was greater (P = 0.013) for EGS than LGS diets and also for B than M diets (P = 0.016). Total tract StD was not influenced by the experimental treatment. Diet digestibility parameters were insensitive to the interactions of the diet components.
Effects of the maturity of the silage grass and concentrate starch source on total diet digestibility
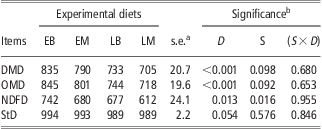
EB = TMR based on early-cut grass silage supplemented with barley-based concentrate; EM = TMR based on early-cut grass silage supplemented with maize-based concentrate; LB = TMR based on late-cut grass silage supplemented with barley-based concentrate; LM = TMR based on late-cut grass silage supplemented with maize-based concentrate; DMD = dry matter digestibility; OMD = organic matter digestibility; NDFD = neutral-detergent fibre digestibility; StD = starch digestibility.
The values presented are least square means (n = 8) and expressed in g/kg.
aStandard error of mean, calculated as n = 8.
bD = effect of stage of maturity of grass silage (early- v. late-cut), S = effect of starch source (barley v. maize) and (S × D) = effect of interactions (starch source × plant maturity).
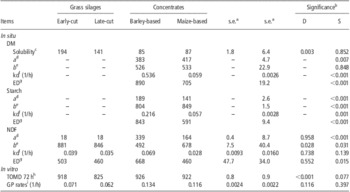
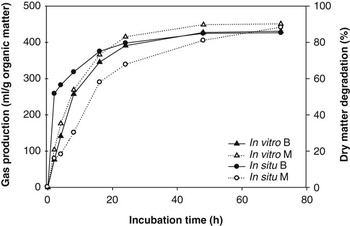
In situ and in vitro degradation parameters of the grass silages and concentrate feeds are presented in Table 6. The values of kd of DM (P < 0.001) and starch (P = 0.001) were greater for barley-based than maize-based concentrate when estimated by the in situ technique. Barley-based concentrate had greater values of ED of DM (P < 0.001), starch (P < 0.001) and NDF (P = 0.015) than maize-based concentrate. Both grass silages had comparable parameter values for NDF fraction when measured in situ. In vitro TOMD and first-order GP rates were similar for both concentrate feeds. EGS had greater (P < 0.001) TOMD and a trend for greater (P = 0.116) first-order GP rates than late-cut silage. Data on the DM disappearance in situ and GP in vitro of the concentrate feeds are presented graphically in Figure 1.
Kinetic parameters for digestion of grass silages and concentrate feeds determined using in situ and in vitro methods

DM = dry matter; ED = effective ruminal degradability; TOMD = true organic matter digestibility; GP = gas production.
The values presented are the means of three (in situ) or two (in vitro) observations and expressed as g/kg unless otherwise stated.
aStandard error of mean for grass silage and concentrate, respectively, calculated as n = 3 for in situ and n = 2 for in vitro data.
bD = effect of stage of maturity of grass silage (early- v. late-cut) and S = effect of starch source (barley v. maize).
cSolubility was determined in a separate experiment. The feed samples were soaked for 1 h and then filtered.
d0 h incubations (only washing) used to correct disappearance at each incubation interval.
eNon-washable potentially degradable fraction, calculated as (1000 − a − indigestible fraction).
fFitted fractional rates of degradation (in situ).
gED, assuming a fractional rate of passage (kp) of 0.03 and 0.05/h for forages and concentrates, respectively.
hTOMD, calculated as described by Hetta et al. (Reference Hetta, Cone, Bernes, Gustavsson and Martinsson2007).
iFirst-order GP rates (in vitro).
Comparison of the dry matter degradation and organic matter gas production curves for barley- (B) and maize-based (M) concentrate feeds using data from in situ and in vitro techniques.

Discussion
Grass silage maturity
Both grass silages used in this study were typical of grass silages commonly used in rations for dairy cows in Northern Europe (Hetta et al., Reference Hetta, Cone, Bernes, Gustavsson and Martinsson2007). The changes in the chemical composition and nutritive characteristics of the silage due to the maturity were consistent with those previously reported for temperate grasses (Rinne et al., Reference Rinne, Huhtanen and Jaakkola1997; Bernes et al., Reference Bernes, Hetta and Martinsson2008; Kuoppala et al., Reference Kuoppala, Ahvenjarvi, Rinne and Vanhatalo2009). The average rate of daily increase in NDF concentration in our study was a little greater than that measured by Kuoppala et al. (Reference Kuoppala, Ahvenjarvi, Rinne and Vanhatalo2009), but was similar to that measured by Bernes et al. (Reference Bernes, Hetta and Martinsson2008).
The responses in DMI and MY of the cows to improved forage digestibility in this work were similar to the results reported in other studies (Rinne et al., Reference Rinne, Jaakkola, Kaustell, Heikkilä and Huhtanen1999; Kuoppala et al., Reference Kuoppala, Rinne, Nousiainen and Huhtanen2008). The positive linear relationship between silage DMI and digestibility was one of the most important factors related to the intake potential of grass silages identified by Huhtanen et al. (Reference Huhtanen, Rinne and Nousiainen2007). Delaying the harvest date decreased the estimated in vitro OMD value of the LGS by ∼100 g/kg, which corresponded to a similar decrease in the apparent total diet OMD and probably accounted for the 3-kg decrease in daily DMI of cows fed the LGS diets. In the present experiment, the intake of NDF was similar for all treatments, indicating that the physical capacity of the rumen did limit further intake from the forage to some extent (Allen, Reference Allen2000). In contrast to our findings, Gasa et al. (Reference Gasa, Holtenius, Sutton, Dhanoa and Napper1991) observed similar intakes with grass silages with different digestibilities and suggested that some unknown metabolic rather than physical factors were involved in regulating the intake of highly digestible grass silage. We did not observe any results consistent with metabolic regulation of DMI in our experiment.
The maturity of the grass used in preparing the silages had a significant effect on the in vivo apparent digestibility of the diets. The estimated values of the DMD and OMD in the EGS diets were greater than those measured by Rinne et al. (Reference Rinne, Jaakkola, Kaustell, Heikkilä and Huhtanen1999) and Kuoppala et al. (Reference Kuoppala, Rinne, Nousiainen and Huhtanen2008 and Reference Kuoppala, Ahvenjarvi, Rinne and Vanhatalo2009), but that of NDFD were comparable with those estimated by Rinne et al. (Reference Rinne, Jaakkola, Kaustell, Heikkilä and Huhtanen1999) for similar levels of growth. However, there was a dramatic drop in the apparent digestibility for LGS diets with increasing maturity of silage grass in this study, which was reflected by the average daily rate of increase in NDF concentration and decrease in in vitro OMD.
Greater MY on EGS diets is probably a consequence of their superior DMI and consequently superior ME intake. The variation in ECM yield responses was primarily due to the differences in ME intake rather than diet ME concentration or digestibility. Kuoppala et al. (Reference Kuoppala, Rinne, Nousiainen and Huhtanen2008) have previously suggested that MY response should be regarded as a function of DM or ME intake rather than diet digestibility. The increased yield of milk constituents resulting from increased MY in the present study can also be explained by the increased ME intake from EGS diets; these findings are consistent with those of Rinne et al. (Reference Rinne, Jaakkola, Kaustell, Heikkilä and Huhtanen1999) and Kuoppala et al. (Reference Kuoppala, Rinne, Nousiainen and Huhtanen2008). The decrease in milk protein concentration with increasing silage maturity observed in this study has previously been reported (Rinne et al., Reference Rinne, Jaakkola, Kaustell, Heikkilä and Huhtanen1999). This effect was mainly caused by the decreased digestibility of and dietary CP supply from mature silages, which might be expected to result in poor energy status and intestinal amino acid (AAT) supply on LGS diets, as suggested by Rinne et al. (Reference Rinne, Jaakkola, Kaustell, Heikkilä and Huhtanen1999).
The changes in the cows’ MY in response to changing the maturity of the grass silage were as expected, although the ME intakes required to produce unit ECM were greater than those reported in earlier studies (Rinne et al.,Reference Rinne, Jaakkola, Kaustell, Heikkilä and Huhtanen1999; Kuoppala et al., Reference Kuoppala, Rinne, Nousiainen and Huhtanen2008). This overall high ME intake may be explained by the relatively late stage of lactation of the cows at the start of the experiment with a significantly large variation in the animals’ DIM, which would have a negative impact on the overall feed utilization, as suggested by Britt et al. (Reference Britt, Thomas, Speer and Hall2003). Previous studies have demonstrated that feeding with mature grass silage results in improved protein utilization for milk protein synthesis (MNE; Rinne et al., Reference Rinne, Jaakkola, Kaustell, Heikkilä and Huhtanen1999; Kuoppala et al., Reference Kuoppala, Rinne, Nousiainen and Huhtanen2008). Our results are consistent with this conclusion and were comparable with the values reported in the preceding studies for grass at similar growth stages. The MNE was more closely related to the dietary concentration than intake of CP (Huhtanen and Hristov, Reference Huhtanen and Hristov2009); delaying the harvest decreased dietary CP concentration in the LGS, resulting in reduced CP supply per unit DMI and improved MNE for LGS diets. Although the EGS diets provided more CP and rumen degradable protein to the animals, the milk urea concentrations are within the range for practical diets (Oltner and Wiktorsson, Reference Oltner and Wiktorsson1983), suggesting that the N supply to rumen microbes or ruminant tissues or both was not in excess to the requirements as milk urea concentration is a strong metabolic indicator of N utilization (Baker et al., Reference Baker, Ferguson and Chalupa1995). In addition, the reported MNE of EGS diets in the present study indicates that the utilization of N was within the expected limits in commercial herds as described by Biagini and Lazzaroni (Reference Biagini and Lazzaroni2009).
Concentrate starch source
The lack of effects from replacing barley- with maize-based concentrate on cows’ DMI were consistent with the findings of Khalili et al. (Reference Khalili, Sairanen, Hissa and Huhtanen2001) but not with those of others (McCarthy et al., Reference McCarthy, Klusmeyer, Vicini, Clark and Nelson1989; Overton et al., Reference Overton, Cameron, Elliott, Clark and Nelson1995; Silveira et al., Reference Silveira, Oba, Beauchemin and Helm2007), who observed a reduction in the DMI of cows on barley-based diets. The diets and other experimental conditions used in the study reported herein differed from those in which feeding with barley-based concentrates resulted in DMI reduction but similar to those of Khalili et al. (Reference Khalili, Sairanen, Hissa and Huhtanen2001). However, both groups of studies were focused on examining the effects of varying the type of the concentrate starch source. Several explanations have been proposed to account for the variable effects of barley and maize containing diets on DMI in cows. Grings et al. (Reference Grings, Roffler and Deitelhoff1992) noted that the dietary concentration of NDF seems to regulate DMI and speculated that the greater dietary NDF of barley- compared with maize-based diets might be related to the lower DMI observed in the cows studied by McCarthy et al. (Reference McCarthy, Klusmeyer, Vicini, Clark and Nelson1989). Variation in the dietary NFC concentration could also account for some of the variation in DMI, as suggested by Overton et al. (Reference Overton, Cameron, Elliott, Clark and Nelson1995). This could account for the fact that barley and maize were observed to have different effects on DMI in studies using high dietary NFC concentrations (McCarthy et al., Reference McCarthy, Klusmeyer, Vicini, Clark and Nelson1989; Overton et al., Reference Overton, Cameron, Elliott, Clark and Nelson1995) but had near-identical effects in studies with low dietary NFC levels (Grings et al., Reference Grings, Roffler and Deitelhoff1992). However, the study of Yang et al. (Reference Yang, Beauchemin, Koenig and Rode1997) does not support this speculation, as they observed no differences in the DMI and MY of cows fed barley compared with maize, even though their dietary NFC concentrations were comparable with those used by McCarthy et al. (Reference McCarthy, Klusmeyer, Vicini, Clark and Nelson1989). In this study, the dietary NDF levels for B diets were comparable with those of the M diets, and the dietary NFC levels were comparable with those used in other studies (Overton et al., Reference Overton, Cameron, Elliott, Clark and Nelson1995). We therefore speculate that the lack of significant effect of the starch source on DMI may be attributable to the similarity of the two concentrates in terms of nutrient composition. The in vitro GP analyses conducted after the feeding trial showed that the GP rates of the two concentrates were similar, which to some extent may explain the comparable results of the two treatments. It could be argued that if the grains had been used without pelleting, that is, just after rolling into the TMR, the intrinsic characteristics of the feeds would have been preserved. This might afford more realistic comparisons of the two starch sources, as the processing of the grains could have altered the nutritive characteristics of their starch (Mills et al., Reference Mills, France and Dijkstra1999).
The calculated ME and NDF intakes in this work for the two concentrate starch sources were also similar. The values of DMD and OMD were not statistically different for the two concentrate starch sources; these findings agree with those of DePeters and Taylor (Reference DePeters and Taylor1985), who observed no differences in total tract diet digestibility when maize replaced barley in the diets. It has previously been reported that total NDFD was greater for maize compared with barley supplements (McCarthy et al., Reference McCarthy, Klusmeyer, Vicini, Clark and Nelson1989; Khalili et al., Reference Khalili, Sairanen, Hissa and Huhtanen2001). We were unable to explain the observed greater NDFD in B diets in our study, thereby speculating that increased iNDF levels in M diets may be responsible. A similar observation regarding the effect of increased proportional contribution of concentrate NDF on the total NDFD has been made by Khalili et al. (Reference Khalili, Sairanen, Hissa and Huhtanen2001).
The concentrate starch source did not significantly affect the milk production probably because there were no significant differences in DMI and thus no differences in ME intake when fed the different concentrates. In some cases, maize supplements have been found to increase MY relative to that observed with barley (McCarthy et al., Reference McCarthy, Klusmeyer, Vicini, Clark and Nelson1989; Overton et al., Reference Overton, Cameron, Elliott, Clark and Nelson1995; Khalili et al., Reference Khalili, Sairanen, Hissa and Huhtanen2001); however, this effect is not always observed (DePeters and Taylor, Reference DePeters and Taylor1985; Grings et al., Reference Grings, Roffler and Deitelhoff1992; Yang et al., Reference Yang, Beauchemin, Koenig and Rode1997). In our experiment, the yield of milk constituents was also not affected by the type of the concentrate starch, probably because of the absence of differences in MY. The type of the concentrate starch has not previously been reported to affect the yield of milk constituents in studies comparing barley and maize supplements using alfalfa hay as the forage source (DePeters and Taylor, Reference DePeters and Taylor1985). In contrast to our findings, Khalili et al. (Reference Khalili, Sairanen, Hissa and Huhtanen2001) reported an increase in milk protein and lactose yield in combination with increased MY when replacing dietary barley with maize. In this work, the milk composition was not altered by the starch source; this finding is consistent with the results of other researchers (DePeters and Taylor, Reference DePeters and Taylor1985; McCarthy et al., Reference McCarthy, Klusmeyer, Vicini, Clark and Nelson1989; Yang et al., Reference Yang, Beauchemin, Koenig and Rode1997; Silveira et al., Reference Silveira, Oba, Beauchemin and Helm2007).
The average AAT supply calculated for the M diets was 297 g/day greater than for the B diets, which was greater than that reported previously (188 g/day; Khalili et al., Reference Khalili, Sairanen, Hissa and Huhtanen2001). This increased AAT supply from M diets has been suggested to increase milk protein yield and the flow of amino acids to the small intestine (McCarthy et al., Reference McCarthy, Klusmeyer, Vicini, Clark and Nelson1989). This suggestion was supported by the observations of Khalili et al. (Reference Khalili, Sairanen, Hissa and Huhtanen2001), who found that maize-supplemented diets increased milk and protein yields more than barley-supplemented diets. However, we found that the output of milk and protein were independent of the type of the concentrate starch source. This suggests that cows’ positive ME balance was not sufficient to allow them to effectively synchronize the increased AAT supplementation from the M diets. We further speculate that this might result in an increased loss of supplemental AAT in the M diets through the faeces. However, it is also possible that the differences between the B and M diets in the supply of AAT from ruminally undegraded protein were overestimated because of inherent problems of the in situ method in predicting the in vivo protein supply from different feeds (Broderick and Cochran, Reference Broderick and Cochran2000; Broderick et al., Reference Broderick, Huhtanen, Ahvenjarvi, Reynal and Shingfield2010).
Interaction between grass silage maturity and concentrate starch source
We hypothesized that the interactions between diet components in terms of the digestibility of grass silage and the type of the concentrate starch could be exploited to improve the forage and total DMI, resulting in MY improvements. Therefore, we expected to have greater DMI and MY of cows offered EGS supplemented with maize-based concentrate. However, we did not observe the expected significant interactions between diet components. As previously discussed, the physical capacity of the rumen seemed to play a major role in regulating forage intake, as indicated by the intake data. Indeed, there was little indication of any metabolic intake regulation; this would explain in part why the type of the concentrate did not produce any effect on DMI. Our hypothesis of effects of interaction of dietary components on DMI and MY in dairy cows was based on the fact that the rumen degradation rates of various concentrate starches would be variable; this was confirmed by our in situ degradation rate measurements (Figure 1). However, these differences could not be confirmed using in vitro GP techniques (Figure 1). The problems associated with accurately estimating starch degradation kinetics using these two methods have been discussed by Huhtanen and Sveinbjörnsson (Reference Huhtanen and Sveinbjörnsson2006); these difficulties should be accounted for when conducting studies of this kind. More studies are needed to evaluate the strengths and weaknesses of the analytical methods used in order to improve diet formulations.
Conclusions
The intake and animal performance in terms of MY were primarily affected by the digestibility of the grass silage rather than by the concentrate starch source. No interaction between silage grass maturity and concentrate type was identified. The absence of the effects of the starch source reported in the production trial questions the differences found concerning the degradation kinetics of the concentrates. This indicates that the true differences between starch sources in terms of rumen availability might be smaller than would be expected on the basis of analyses using the in situ technique. Further studies are needed to explore these issues with the characterization of starch utilization in ruminants.
Acknowledgements
The authors gratefully acknowledge financial support from the Swedish Farmers’ Foundation for Agricultural Research and the Higher Education Commission of Pakistan.