Introduction
Mass-casualty events or incidents (MCI) occur when the number of casualties, or the rate of their arrival, exceeds the resources to provide complete individual care. Patient care resources are overwhelmed and cannot be immediately supplemented. In these situations, the care paradigm shifts from the greatest good for the individual to the greatest good for the greatest number of casualties.Reference Pesik, Keim and Iserson 1 Emergency department (ED) management of MCIs relies on triage as a decision tool to sort patients for treatment priority, given their injury severity, the resources available, and the situation. The goal of triage is to identify rapidly patients with the most life-threatening injuries and with the greatest probability of survival. Triage is conducted on all patients presenting to the ED: self-referrals, arrivals by ambulance, and patients unrelated to the MCI. Although casualties arriving by ambulance usually have been triaged by prehospital providers, they may need to be re-triaged upon arrival to the ED as they enter the inflow pool of all patients.
The Canadian Triage and Acuity Scale (CTAS)Reference Beveridge, Clarke and Janes 2 , Reference Bullard, Unger, Spence and Grafstein 3 is the national standard of triage in Canada; however, the study setting’s local health authority suggested using the Simple Triage and Rapid Treatment (START)Reference Super 4 triage system in a MCI assuming that it would be quicker. There is growing concern that ED overcrowding is impacting the quality of emergency care in many EDs,Reference Holroyd, Bullard and Latoszek 5 and the high influx of patients during a MCI could disrupt patient flow in an already overcrowded ED that is functioning beyond its operating capacity.
As a quality improvement initiative, a two-step triage model that encompasses pre-triage (ie, at the door) with START and subsequent ED triage (ie, in the waiting area triage point) with CTAS in order to meet the challenges of a high influx of patients during a MCI was proposed. Pre-triage, using START, involves a survey of all patients arriving at the doors of the ED to identify quickly critically ill patients who may benefit from resuscitative measures given the constraints on resources. Triage is a dynamic sequence of decisions, and subsequent ED triage can be performed with CTAS. Using CTAS would mimic routine “day-to-day” triage practices. Repeated effective triage can maintain hospital surge capacity, and subsequent triage has been shown to be more effective and appropriate when casualties arrive at the ED.Reference Aylwin, Konig and Brennan 6 Other two-step triage methods such as “START, then Secondary Assessment of Victim Endpoints (SAVE),”Reference Benson, Koenig and Schultz 7 and “Triage Sieve, then Triage Sort,”Reference Carley and Mackway-Jones 8 have been proposed in the literature; however, these methods are not familiar to the study setting’s local ED staff. During the terrorist bombings in London, United Kingdom, Aylwin and colleagues found that triage errors and surge can be reduced by trained, experienced decision makers working in their usual practice.Reference Aylwin, Konig and Brennan 6 Thus, CTAS, the national standard in Canada, was coupled with START, the health authority’s suggested MCI triage method. The purpose of this pilot study was to assess the ability to implement a two-step ED triage model with pre-triage using START, then subsequent triage using CTAS, during a MCI using a computer-based disaster simulation. It was hypothesized that there would be no difference in time intervals nor patient volumes at each patient-flow milestone.
Methods
Study Design
This was a prospective, observational cohort study.
Study Setting and Population
Emergency medicine resident physicians (ranging from postgraduate year one to four) from the University of Alberta, Edmonton, Alberta, Canada and triage nurses from the Royal Alexandra Hospital, Edmonton, Alberta, Canada, were invited to participate in this study.
Study Protocol
The Department of Emergency Medicine at the University of Alberta approved the study protocol and the University of Alberta Research Ethics Office approved the study.
Following an explanation of the study, consent was obtained from each study participant. No personal identifying information from study participants was collected.
A computer-based tabletop exercise simulation program, SurgeSim version 2.2.0 (MedStatStudio; Edmonton, Alberta, Canada), previously known as disastermed.ca, was used to model a MCI of simulated ED patients.Reference Franc-Law, Bullard and Della Corte 9 The simulation has been used previously and found to be an effective model to simulate the ED response to a disaster.Reference Franc-Law, Bullard and Della Corte 9 , Reference Franc-Law, Ingrassia, Ragazoni and Della Cort 10 All study participants, except for the triage nurses, were block randomized to one of two groups: single ED triage model (control group) or two-step ED triage model (intervention group). The triage nurses were the only participants to have formal CTAS training and to assign CTAS categories to patients on a routine basis. To mimic “day-to-day” ED operations, the two triage nurses were assigned to the intervention group to work at the ED triage point where a CTAS category is assigned.
Before the simulation, all participants were given a 60-minute tutorial about command-and-control in the ED, a 30-minute tutorial in the use of the simulation software, and 30 minutes to familiarize themselves with the simulation software with practice patients. The intervention group received a 15-minute tutorial about the intervention.
Participants used a web browser on laptop computers connected to an intranet to participate in the MCI simulation. Each group worked as a team to manage the MCI. Command-and-control, organizational structure, and job assignments (except for the role of the two triage nurses in the intervention group) were left to the discretion of the participants. The simulation began with routine “day-to-day” ED operations. Patients were already in the ED and assigned to physicians, or were in the waiting room and waiting to be triaged. Shortly after the start of the simulation, the Charge Nurse (Simulation Moderator) informed the acute care area physician that a MCI occurred at the airport and to expect an unknown amount of casualties. The simulation then progressed to a MCI with an influx of patients sufficient enough to overwhelm the hospital’s resources. Participants were asked to manage the patients, including triage, physician assessment, laboratory and radiographic investigations, procedures if indicated, and disposition. Patient management took place in real-time with delay times for investigation results and procedures. During procedures, the participant performing it would not be able to do any other task. The delay times were determined electronically by the simulation software to represent realistic real-time delays. All patient assessments, investigations, and procedures took place directly on the participants’ computer. A Simulation Moderator acted the roles of ED Charge Nurse, in-patient Consultants, and Emergency Medical Services (EMS). If the Incident Commander requested an increase in bed capacity, the Simulation Moderator modified the bed capacity of the simulated hospital to accommodate the request realistically.
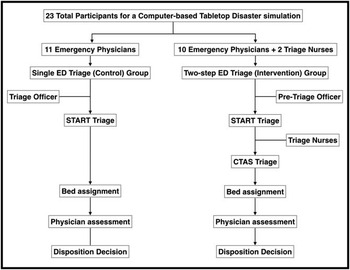
The two groups independently participated in the same simulation scenario simultaneously in separate rooms (Figure 1). The hospital configuration and simulated patients were identical for the two groups. Both groups were also given a printed copy of a disaster plan for the simulated hospital developed by one of the study authors (JMF). The disaster plan is based on the Hospital Incident Command System format and included detailed job descriptions for key positions and a collection of standardized forms. 11 The disaster plans were identical between the groups, except for the method of triage and the addition of a Pre-triage Officer position in the intervention group. The control group performed ED triage using START (Appendix 1; available online only).Reference Super 4 Bed assignment was left to the discretion of the control group participants. In the intervention group, if triage personnel were overwhelmed at the traditional ED triage point, a Pre-triage Officer was to be appointed to apply the START criteria at the doors of the ED to determine the priority for patients to proceed to the traditional ED triage point. The Pre-triage Officer applied a colored arm-band, coinciding with the START color code (Immediate=Red, Delayed=Yellow, Minor=Green, and Deceased=Black), labeled it with the patient number, and ensured that the patient labeled most acute proceeded first to the traditional ED triage point. The triage nurses then continued with subsequent ED triage using CTAS (Appendix 2; available online only).Reference Beveridge, Clarke and Janes 2 , Reference Bullard, Unger, Spence and Grafstein 3 The triage nurses used the CTAS application 12 as a decision aid when needed. The triage nurses also assigned patient beds in the intervention group. Both groups were given 60 minutes to participate in the simulation.
Study Flow Diagram. Abbreviations: CTAS, Canadian Triage and Acuity Scale; ED, emergency department; START, Simple Triage and Rapid Treatment.

Measurements
The primary outcome measures were the difference in time interval and patient volumes at four key milestones in patient flow between the groups: (1) the time from ED arrival to triage, (2) the time from ED arrival to bed assignment, (3) the time from ED arrival to physician assessment, and (4) the time from ED arrival to disposition decision. Patient volumes included all patients, disaster and non-disaster, that arrived during the simulation period.
The secondary outcome was to assess the triage accuracy between the two groups. Triage accuracy was assessed by comparing the triage category assigned by the participants to those in the simulation software database. The CTAS categories assigned at ED presentation by the simulation software were documented as the gold standard. This method of computerized triage assignment previously has been shown to be reliable.Reference Dong, Bullard and Meurer 13 , Reference Dong, Bullard and Meurer 14 The simulation software database also contained triage categories for START. Electronic triage assignment was performed with a simple database query that used the fields for vital signs to determine the START category according to published START guidelines.Reference Super 4
Data Collection
Data from the simulation program were collected without personal identifiers of study participants. The major categories of data that were collected include:
-
1. Time interval from ED arrival to initial triage and the number of patients triaged;
-
2. Time interval from ED arrival to bed assignment and the number of patients assigned a bed;
-
3. Time interval from ED arrival to physician assessment and the number of patients assessed by a physician;
-
4. Time interval from ED arrival to disposition decision and the number of patients who had a disposition decision; and
-
5. Triage categories of each simulated patient.
All time intervals were recorded directly by the clock within the simulation software, which was synchronized for all participants.
Data Analysis
Statistical analysis was performed using R: a language and environment for statistical computing (R Foundation for Statistical Computing; Vienna, Austria). Continuous data (time intervals) were reported as means and standard deviation (SD) or median and interquartile ranges (IQR), as appropriate. Comparison of continuous data was performed using two-sample t-tests. Proportions were calculated for categorical variables (triage accuracy) and their statistical significance was determined by two-sample test of equality of proportions with continuity correction. To maintain a family-wise error rate of α=0.05, P values less than .0125 were considered significant (Bonferroni correction for m=4 tests).Reference Montgomery, Peck and Vining 15 All P values are two-tailed. The 95% confidence intervals (CIs) were also adjusted to 98.75% CI (Bonferroni correction for m=4 tests).Reference Montgomery, Peck and Vining 15
Results
Twenty-one emergency medicine resident physicians (ranging from postgraduate year one to four) and two triage nurses participated in the simulation. The control group had 11 participants and the intervention group had 12 participants (including the two triage nurses). The simulation started with six physicians working in each ED with the addition of two triage nurses in the intervention group. Four physicians were on-call and were called to work in the ED when requested by the Incident Commander at pre-determined staggered intervals (one minute, five minutes, 10 minutes, 10 minutes). In the control group, the simulation started with six physicians working in the ED and five physicians were on-call. The control group Incident Commander did not request any additional on-call physicians to be called in to work; however, the Simulation Moderator did call in the on-call physicians at pre-determined intervals (one minute, five minutes, 10 minutes, 10 minutes, 10 minutes) in order to facilitate the simulation.
In the intervention group, a request to call in all available on-call ED physicians was made eight minutes after the start of the simulation by the acute-care area physician. An Incident Commander was established by nine minutes and a MCI was declared 11 minutes after the start of the simulation. A request for a Pre-triage Officer was made by 13 minutes and a request to increase bed capacity was made 40 minutes after the start of the simulation. A media update was performed 45 minutes into the simulation. No time markers were recorded in the control group. The control group also did not request an increase in bed capacity; however, the Simulation Moderator increased bed capacity in order to facilitate the simulation.
Patient-flow Milestones
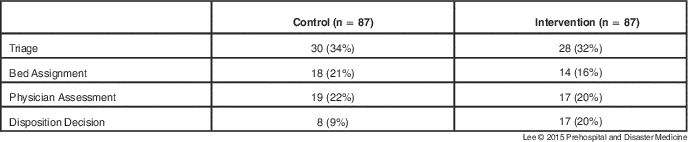
During the simulation, each group received 87 patients in 60 minutes. Table 1 shows a comparison of the volume of patients to reach each patient-flow milestone: triage, bed assignment, physician assessment, and disposition decision.
Volume of Patients to Reach Each Patient-flow Milestone

ED Arrival to Triage
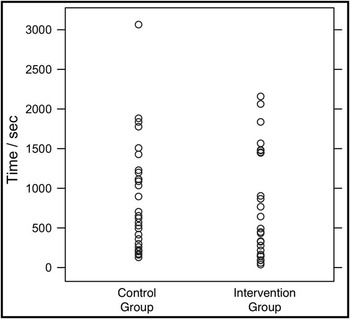
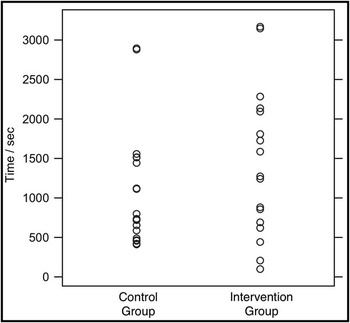
The median time from ED arrival to triage in the control group was 678 seconds (IQR 314-1,178) and the mean was 876 seconds (SD=677 seconds). The median time from ED arrival to the second step of triage, with CTAS, in the intervention group was 470 seconds (IQR 160-1,450) and the mean was 768 seconds (SD=682 seconds; Figure 2). There was no significant difference in mean times from ED arrival to triage between the groups (mean difference 108 seconds; 95% CI, -353 to 596 seconds; P=1.0). There was no significant difference in the volume of patients triaged by the intervention group, 32%, compared to the control group, 34% (95% CI for the difference -16% to 21%; P=1.0).
The Time from Emergency Department Arrival to Triage (in Seconds). Each dot Represents a Patient.

ED Arrival to Bed Assignment
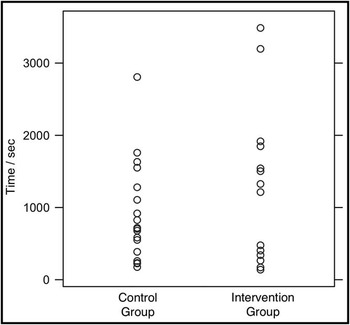
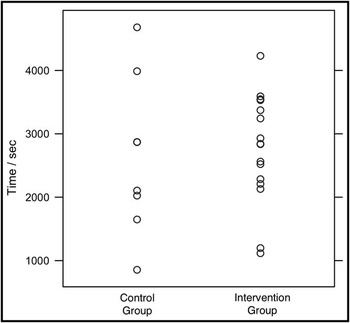
The median time from ED arrival to bed assignment in the control group was 711 seconds (IQR 427-1,236) and the mean was 911 seconds (SD=685 seconds). The median time from ED arrival to bed assignment in the intervention group was 1,270 seconds (IQR 356-1,172) and the mean was 1,273 seconds (SD=1,083 seconds; Figure 3). There was no significant difference in mean times from ED arrival to bed assignment between the groups (mean difference 362 seconds; 95% CI, -1,269 to 545 seconds; P=1.0). There was no significant difference in the volume of patients assigned to a bed in the intervention group, 16%, compared to the control group, 21% (95% CI for the difference -11% to 20%; P=1.0).
The Time from Emergency Department Arrival to Bed Assignment (in Seconds). Each Dot Represents a Patient.

ED Arrival to Physician Assessment
The median time from ED arrival to physician assessment in the control group was 736 seconds (IQR 538-1,478) and the mean was 1,079 seconds (SD=751 seconds). The median time from ED arrival to physician assessment in the intervention group was 1,273 seconds (IQR 691-2,093) and the mean was 1,427 seconds (SD=936 seconds; Figure 4). There was no significant difference in mean times from ED arrival to physician assessment between the groups (mean difference 31 seconds; 95% CI, -1,104 to 348 seconds; P=.92). There was no significant difference in the volume of patients assessed by a physician in the intervention group, 20%, compared to the control group, 22% (95% CI for the difference -14% to 19%; P=1.0).
The Time from Emergency Department Arrival to Physician Assessment (in Seconds). Each Dot Represents a Patient.

ED Arrival to Disposition Decision
The median time from ED arrival to disposition decision in the control group was 2,487 seconds (IQR 1,931-3,150) and the mean was 2,630 seconds (SD=1,249 seconds). The median time from ED arrival to disposition decision in the intervention group was 2,842 seconds (IQR 2,285-3,531) and the mean was 2,805 seconds (SD=846 seconds; Figure 5). There was no significant difference in mean times from ED arrival to disposition decision between the two groups (mean difference 175 seconds; 95% CI, -1,650 to 1,300 seconds; P=1.0). There was no significant difference in the volume of patients with a disposition decision in the intervention group, 20%, compared to the control group, 9% (95% CI for the difference -25% to 4%; P=.34).
The Time from Emergency Department Arrival to Disposition Decision (in Seconds). Each Dot Represents a Patient.

Triage Accuracy
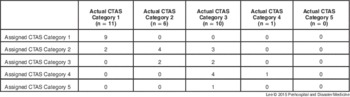
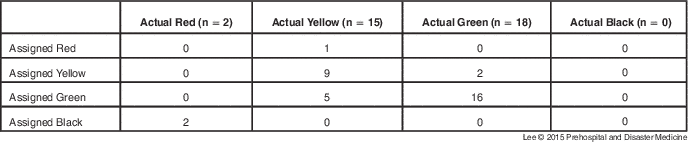
The control group triaged 30 (34%) patients and the intervention group pre-triaged and ED triaged in the second step 28 (32%) patients. Out of the 30 patients who were triaged in the control group, 21 (70%) patients were triaged correctly, and out of the 28 patients who were triaged in the second step in the intervention group, 16 (57%) were triaged correctly. There was no significance difference in the accuracy of triage between the two groups (95% CI for the difference -15% to 41%; P=.46). The control group over-triaged two (7%) yellow patients and under-triaged seven (23%) yellow patients. Out of the 28 patients who were triaged in the second step, the intervention group over-triaged one (4%) CTAS Category 2 patient, two (7%) CTAS Category 3 patients, four (14%) CTAS Category 4 patients, and one (4%) CTAS Category 5 patient. Three (11%) CTAS Category 2 patients were under-triaged. A comparison of study participant’s assigned versus actual triage category can be seen in Table 2 and Table 3 for the control and intervention groups, respectively. The intervention group pre-triaged 35 (40%) patients, and out of the 35 patients, 25 (71%) patients were triaged correctly (95% CI, 53% to 85%). One (3%) yellow patient and two (6%) green patients were over pre-triaged. Two (6%) red patients and five (14%) yellow patients were under pre-triaged. A comparison of the intervention group participant’s assigned versus actual pre-triage category can be seen in Table 4.
Comparison of Assigned versus Actual START Triage Category in the Control Group

Abbreviation: START, Simple Triage and Rapid Treatment.
Comparison of Assigned versus Actual CTAS Triage Category in the Intervention Group’s Second Step ED Triage Phase

Abbreviations: CTAS, Canadian Triage and Acuity Scale; ED, emergency department.
Comparison of Assigned versus Actual START Triage Category in the Intervention Group’s Pre-triage Phase

Abbreviation: START, Simple Triage and Rapid Treatment.
Discussion
Various triage methods can be used in a MCI; however, this is believed to be the first prospective study in the literature examining the impact of a two-step ED triage model on patient flow using START, then CTAS, during a MCI. Aylwin and colleagues found that staged triage with explicit control of patient flow and resources reduced casualty surge;Reference Aylwin, Konig and Brennan 6 however, in this pilot study using a disaster simulation exercise, there were no significant differences in patient flow when comparing the two-step triage method START, then CTAS, with START alone. Furthermore, both groups were able to triage a similar number of patients with no significant difference in the accuracy of triage. This suggests that the START, then CTAS, method would be as efficient as the START method alone during a MCI, and that disaster planners can look to other advantages and disadvantages of the two systems as the deciding factor between them.
At the tertiary-care hospital that this study’s triage nurses are employed, triage nurses must have a minimum of three years of experience in the ED, including one year of experience in the trauma/resuscitation area. Furthermore, triage nurses receive CTAS training at a 1-day course followed by a 1-day observational shift at the triage point before beginning to work as a triage nurse. Triage nurses are well educated on CTAS, and experienced triage nurses should be able to continue using CTAS in a MCI. There was no significant difference between triaging with START, then CTAS, compared to START alone. The accuracy of START has been shown to be variable when retrospectively compared to outcomes; however, the START method has been shown to identify 100% of critically injured casualties,Reference Kahn, Schultz, Miller and Anderson 16 which would be the goal of pre-triage. The START triage method was developed for the prehospital environment; however, it was found to be an efficient method of pre-triage upon arrival to the ED. In the setting of ED overcrowding and a high influx of patients during a MCI, patient flow, including timely disposition decisions and movement of patients to definitive care, is a priority.
In a MCI, staff may be mandated to try to do “the best for the most,” which is unlike routine emergency medicine practice where the goal it to do “everything for everyone.” Participants in the simulation found it challenging to apply the START category of black/deceased to patients in respiratory arrest without attempting advanced airway interventions and sought advice from the Simulation Moderator, who deferred a response to the group’s Incident Commander. Ethical dilemmas that were raised during the simulation included what triage category is a patient intubated by prehospital providers and who can declare patients deceased/triage label black. According to START, a patient in respiratory or cardiac arrest would be the lowest priority (black); however, that patient would be the highest priority (CTAS Category 1) with CTAS. In Canadian hospitals, nurses perform triage and there is no policy on whether a triage nurse is able to declare a patient deceased, which is a task traditionally performed by physicians. The benefit of a two-step triage method in a MCI is having an experienced physician in the role of a Pre-triage Officer who would be able to declare casualties deceased/expectant upon arrival to the ED taking into consideration the severity of injury, the resources available, and the situation. The START, then CTAS, method with a pre-triage physician would circumvent the difficult position a triage nurse would be in if they were asked to pronounce a patient deceased/label black, which is outside traditional nursing duties.
Limitations
Several design limitations should be considered when interpreting the results. Prospective research on patient flow during a MCI is not feasible and thus, a simulation model was chosen as a practical alternative. The disaster simulation software used in this study previously has been found to be an effective method of simulating the ED’s response to a major disaster.Reference Franc-Law, Bullard and Della Corte 9 , Reference Franc-Law, Ingrassia, Ragazoni and Della Cort 10 Furthermore, many of the study participants have used the simulation software in the past. Limitations in this study include the inherent logistical and technological challenges of a tabletop simulation exercise. There was not enough observer staff to look at command-and-control functions and the Pre-triage Officer in the intervention group had multiple technical difficulties (ie, had multiple web browser windows open unrelated to the simulation and unintentionally entered data for the wrong simulation team).
Study participants and staff managing the simulation were not blinded to the two groups, which allows for a potential Hawthorne effect. Practically, blinding of study participants would be difficult.
This pilot study was part of a quality improvement initiative, and thus, the intervention group had the triage nurses pre-assigned to it, leading to the potential for selection bias. The triage nurses are experienced decision makers who use CTAS regularly in the real-world setting. All study participants were familiar with START from prior education; however, the real-world experience of START amongst the participants is not known.
Lastly, the small nature of this pilot study led to small sample sizes in each group and relatively wide confidence intervals. Further studies would be necessary to clarify the results.
Conclusion
This pilot study of simulating a disaster in the ED found no significant differences in patient flow and triage accuracy when comparing the two-step triage method START, then CTAS, with START alone.
Acknowledgements
The authors would like to thank Samara Taylor, RN; Lisa Watt, RN; J. Rashad Chin, MD; and the University of Alberta emergency medicine resident physicians for their participation in the simulation. This manuscript is the result of a thesis submitted in partial fulfillment of the requirements for the degree of European Master in Disaster Medicine.
Supplementary Material
To view supplementary material for this article, please visit http://dx.doi.org/10.1017/S1049023X15004835