Implications
The uniformity of pigs at slaughter facilitates the processing of pork products with a resulting reduction of costs. It also facilitates ensuring a predictable product to the consumers. Achieving animal uniformity is an important challenge for the pig industry. However, measuring the uniformity and testing differences are not straightforward. This study reports the application of the coefficients of variation and dispersion for measuring pig uniformity in some of the most important carcass and meat quality traits. It also reports the use of confidence intervals to test the differences in uniformity.
Introduction
Many characteristics of pigs affect the profitability of producers and pork processors. Uniformity is one of them. Meat retailers express demand for a more uniform product (Hennessy, Reference Hennessy2005). Variations in carcass size, shape and composition affect the packing and processing industry, both in terms of handling of the carcass and its products, and in the uniformity of its products (Patience et al., Reference Patience, Engele, Beaulieu, Gonyou and Zijlstra2004). Pork processors have provided quality grids and higher pig uniformity on carcass weight, fat depth and loin depth has been generally translated into higher income for producers.
Nowadays, uniformity does not only apply to the weight and the fat and loin depth of the pigs at slaughter but also to the weight of the primal cuts and processing and visual appearance properties. During the past decades consumer demand for product quality has increased. Different labels for pork meat have emerged and they need to assure a uniform quality standard to be offered to their consumers. This includes the size and shape of the joint and the composition of the meat and its eating and processing properties (Webb, Reference Webb2003). Water-holding capacity, visual appearance and the weight of the primal cuts are probably the most important properties. Poor water-holding capacity implies considerable monetary loss to pig industry (Fischer, Reference Fischer2007). Visual appearance is becoming more important due to the increasing share of pre-packed meat for self-service (Mörlein et al., Reference Mörlein, Link, Werner and Wicke2007). Primal cuts of the carcass could differ among countries and regions, but in general, loin, ham and shoulder are those that give more value to the carcass (∼75% in the Spanish market).
Factors affecting pork carcass and meat quality traits have been deeply analysed. Breed of sire, maternal genotype, sex, weight, feeding strategies, farm management, welfare, etc. are usually taken into account to produce for different markets and meat quality programmes. Pig industry also controls these factors to increase uniformity. However, residual variation within these factors has received less attention. Some studies compare variation within and between herds or breeds (Ball, Reference Ball2000; Magowan et al., Reference Magowan, McCann, Beattie, McCracken, Henry, Smyth, Bradford, Gordon and Mayne2007; Bunter et al., Reference Bunter, Bennett, Luxford and Graser2008), but uniformity is not usually statistically tested. The concept of uniformity requires thinking in terms of variation rather than treatment means, and it is not always easy to use and understand (European Association for Animal Production (EAAP), 2008). In addition, test for measures of uniformity are not usually implemented in statistical packages.
The most common term to analyse uniformity is the coefficient of variation (CV). The CV, the ratio between standard deviation (σ) and mean (μ) (CV = σ/μ), is a measure of relative variation that provides useful information about homogeneity to compare different traits or groups with different mean values. It is often used by laboratories, material manufacturers, financial managers, etc., and different techniques have been developed to obtain confidence intervals (CIs) on single CV that allow testing for the equality of CV (Verrill and Johnson, Reference Verrill and Johnson2007). CV is used to describe uniformity in pig production, for example, by Patience et al. (Reference Patience, Engele, Beaulieu, Gonyou and Zijlstra2004) and Magowan et al. (Reference Magowan, McCann, Beattie, McCracken, Henry, Smyth, Bradford, Gordon and Mayne2007), but in general, statistical tests to infer differences among CV values are not applied.
A limitation of CV for statistical testing is that its CIs are not robust to violation of normality assumption. This assumption is not always supported in biological sciences, and so, in pig production. In this situation, the coefficient of dispersion (CD) may be preferred. The CD is the ratio between the mean absolute deviation from the median (τ) and the median (η) (CD = τ/η) and provide a better description of location and spread than the CV in non-normal distributions, with CI performing better than those for the CV (Bonett and Seier, Reference Bonett and Seier2006).
The aim of this study was to provide general information on uniformity of some carcass and meat quality traits of pigs, and to evaluate the variation within homogeneous animals for sire breed, sex and slaughter weight factors. The use of the CV and the CD for measuring pig uniformity was compared, and CIs were considered for testing differences.
Material and methods
Animals
Data from three batches of pigs born in different farms but raised in the same farm and slaughtered at four different dates in the same commercial abattoir were considered (batch 1: 13 and 18 December 2007; batch 2: 24 April 2008; batch 3: 30 September 2008). Batches involved different sire lines, sex and slaughter weights, but a common Sino-European commercial maternal line. The pigs were halothane-free females and castrated males fed ad libitum with standard pig diets.
The first batch was obtained using commercial Duroc sire boars, and a total of 112 animals were controlled for carcass and meat quality traits (56 castrated males and 56 females). Mean final weight was 114.4 kg (s.d. = 5.4) with age ranging between 166 and 177 days. The second batch used Duroc and Pietrain sire boars with the target to achieve two different final weights (105 and 115 kg live weight); 128 animals were controlled (64 castrated males and 64 females), 16 for each combination of sire boar, sex and final weight. Mean final weight was 109.7 kg (s.d. = 8.1) with age ranging between 168 and 182 days. The last batch used only Pietrain sire boars with 96 controlled pigs (48 castrated males and 48 females). Mean final weight was 106.2 kg (s.d. = 7.8) with an age of around 176 days. Pigs were transported 120 km to the abattoir and killed by bleeding after CO2 stunning.
Carcass and meat quality measures
Some of the main economic traits for pork processor industry were considered for this study: weight of carcass and three primal cuts (ham, loin and shoulder), backfat depth, colour (Cielab L*), pH and drip loss. For some of them information was not available for all the 336 pigs but in a large data subset (n > 285; Table 1). Carcass weight (hot carcass weight minus 2%) and backfat (measured at P2 point by a digital millimetre ruler) and pH (measured just before cooling at about 25-min post mortem in the semimembranosus muscle, by a pH*k21 pH meter (SKF Technology, A/S, Denmark) were recorded at the abattoir in commercial conditions. Weight of both hams, both shoulders and the left loin was recorded in the processor plant on the day after slaughter following commercial cutting. A 2-cm thick loin chop was taken to measure colour and water-holding capacity. Colour L* Cielab coordinate was measured around 24 to 30 h post mortem with a Minolta CM2002 spectrocolorimeter (Minolta Co. Ltd, Osaka, Japan). At this moment, a piece of each loin chop (∼80 g) was taken to measure drip loss in the next 24 h following Honikel (Reference Honikel1998).
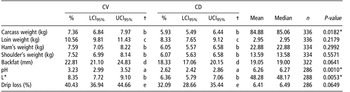
Coefficient of variation (CV%) and dispersion (CD%), lower (L) and upper (U) confidence intervals (CI95%), mean and median values, number of observation (n) and P-value of Shapiro–Wilks normality test for all the available data

†Different letters within a column indicate significant differences between traits (P < 0.05).
*Hypothesis of normality should be rejected at 5% error type I.
Statistical analyses
Uniformity of pigs for each trait considered was estimated by means of CV and CD. Shapiro–Wilk normality test was applied to assess data distribution assumptions.
CIs for the CV were computed using FORTRAN code from Verrill and Johnson (Reference Verrill and Johnson2007), and CI for the CD were computed using R-function from Bonett and Seier (Reference Bonett and Seier2006). A 95% confidence level (CI95%) was considered. Values of CV or CD estimated in different samples were considered different when their CI95% did not overlap. Analyses were performed considering two different data sets. First, CV and CD were computed for all data, in order to assess the overall uniformity of pigs when different sire breeds, sex, slaughter weights and batches are involved, and to analyse differences in uniformity between traits. Second, CV and CD were computed independently within ‘sire breed–sex–slaughter weight’ using data from the second batch of animals to analyse differences between them when sire breed, sex, target live weight and slaughter batch effects were blocked.
Results and discussion
When the whole data set was considered, low uniformity was observed especially for drip loss (CV = 40.4, CD = 32.1) and backfat (CV = 22.8, CD = 18.3), pH being the most uniform trait (CV = 3.2, CD = 2.6; Table 1). These results in the CV agree with those reported by Mörlein et al. (Reference Mörlein, Link, Werner and Wicke2007; 39.6, 17.4 and 3.5 for drip loss, backfat and pH, respectively).
Five different groups of uniformity were found regarding CIs for both CV and CD: (i) pH, (ii) carcass, ham and shoulder weight and L*, (iii) loin weight, (iv) backfat and (v) drip loss (sorted in decreasing order of uniformity). No difference was found when testing traits uniformity with either CV or CD confidence bounds, although some traits (carcass weight, pH and L*) did not hold normality distribution assumption (Table 1). According to these results, it could be concluded that the main problems of uniformity in meat quality and carcass traits are found in water-holding capacity, fatness and loin weight. It could be argued that a low accuracy of measuring techniques or commercial cutting procedure is an important source of variation. However, other traits like pH or ham weight could be affected by the same sources of variation and were found to be more uniform in this study.
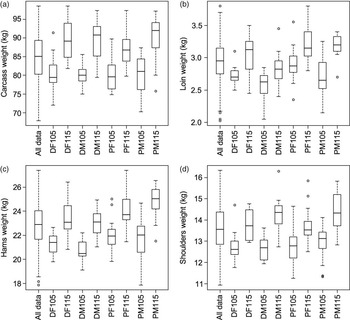
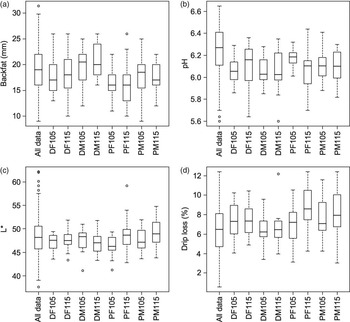
The observed low uniformity could also be explained by differences between groups of animals due to sex, weight, slaughter date, and especially sire boar breed. The analyses of uniformity within homogeneous groups of animals for all these factors can help answering this question. Figures 1 and 2 illustrate the uniformity of these groups. Box plots are a usual way to explore differences in variability within groups (Bunter et al., Reference Bunter, Bennett, Luxford and Graser2008). Figures 1 and 2 show an apparently higher uniformity within groups compared with uniformity of overall data; this higher uniformity is especially apparent for L* value (Figure 2). They also show that there was overlap between groups due to the variation between animals of different groups. This indicates that the best animals from some groups are similar to the worst animals from other groups; however, differences in variability within groups were apparent. For example, ham’s weight seems more uniform for castrated males slaughtered at 105 kg produced with Duroc sires than with Pietrain sires (Figure 1).
Box plot illustrating (a) carcass, (b) loin, (c) ham’s and (d) shoulder’s weight variations between animals for all the available data and for ‘sire breed–sex–slaughter weight’ groups. Horizontal lines indicate the median value; each box contains 50% of animals; whiskers extend to a maximum of 1.5 × interquartile range; outliers are indicated by an open circle. (D = Duroc sire breed; P = Pietrain sire breed; M = castrated males; F = females; 105 = 105 kg target weight; 115 = 115 kg target weight).

Box plot illustrating (a) backfat, (b) pH, (c) L* and (d) drip loss variations between animals for all the available data and for ‘sire breed–sex–slaughter weight’ groups. Horizontal lines indicate the median value; each box contains 50% of animals; whiskers extend to a maximum of 1.5 × interquartile range; outliers are indicated by an open circle. (D = Duroc sire breed; P = Pietrain sire breed; M = castrated males; F = females; 105 = 105 kg target weight; 115 = 115 kg target weight).

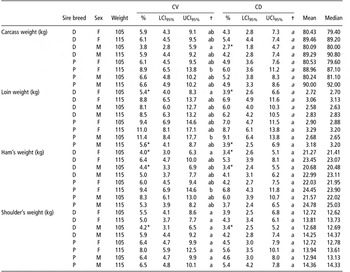
The calculations of CIs for the CV or the CD within groups (sire breed, sex and slaughter weight) are shown in Table 2 and 3, using data from batch 2. Eliminating the effect of variability due to batch, genetic origin, etc. it could be expected to found more uniform groups of animals than just mixing all these factors.
Coefficient of variation (CV%) and dispersion (CD%), lower (L) and upper (U) confidence intervals (CI95%) and mean and median values for carcass weight traits within ‘sire breed–sex–slaughter weight’ groups

D = Duroc sire breed; P = Pietrain sire breed; M = castrated males; F = females; 105 = 105 kg target weight; 115 = 115 kg target weight.
†Different letters within a column indicate significant differences between groups within a trait (P < 0.05).
*Values significantly different of the obtained for the whole data set (Table 1).
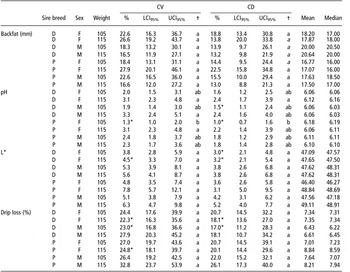
Coefficient of variation (CV%) and dispersion (CD%), lower (L) and upper (U) confidence intervals (CI95%), and mean and median values for backfat and meat quality traits within ‘sire breed–sex–slaughter weight’ groups

D = Duroc sire breed; P = Pietrain sire breed; M = castrated males; F = females; 105 = 105 kg target weight; 115 = 115 kg target weight.
†Different letters within a column indicate significant differences between groups within a trait (P < 0.05).
*Values significantly different of the obtained for the whole data set (Table 1).
Although uniformity was sometimes higher within ‘sire breed–sex–slaughter weight’ group, than when considering overall data, there was still a large variability between animals within group. In fact, uniformity was significantly different in only a few groups – for pH and carcass, loin and ham’s weights – the apparent higher uniformity that was found by using box plots (Tables 2 and 3).
Significant differences were found between the different ‘sire breed–sex–slaughter weight’ groups. Animals from terminal sires with Pietrain origin showed a tendency to be less uniform for carcass traits, though not for backfat and meat quality traits. No consistent intra-sex and slaughter weight differences in uniformity were found.
For the past 40 years the pig industry has focussed on reducing backfat, and it could be considered that fatness is now under control (Webb, Reference Webb2003), but results showed that there is still an important heterogeneity between animals. Backfat CV ranged from 16.5% to 27.9% (Table 3), without statistically significant differences from overall data value, 22.8% (Table 1), and similar value reported by Bunter et al. (Reference Bunter, Bennett, Luxford and Graser2008).
Uniformity was also compared independently between Duroc and Pietrain sires, males and females, and 105 and 115 slaughter weights. Results are not shown because no difference was significant at CI95%. In spite of it, it could be indicated that the greatest differences were found for drip loss when Duroc and Pietrain animals were compared, the animals from Duroc sires having apparently a higher uniformity (CV = 24.6%, CD = 20.4%) than those from Pietrain sires (CV = 28.7%, CD = 23.1%). When comparing males and females the greatest differences were found for backfat with males being apparently more uniform (CV = 19.6%, CD = 15.3%) than females (CV = 24.0%, CD = 19.4%). Finally, the comparison of group of animals slaughtered at 105 kg v. those slaughtered at 115 kg showed the greatest difference for drip loss with the heavier pigs apparently less uniform (105 kg: CV = 25.6%, CD = 21.1%; 115 kg: CV = 29%, CD = 29.1%).
It should be noticed that in general larger sample sizes are needed for testing differences in uniformity than in average values. The sample size needed to estimate a width of the CI sufficiently narrow depends on the variability of the trait analysed (Kelley, Reference Kelley2007). For instance, to obtain a CI95% for the CV of drip loss of males from Pietrain sires slaughtered at 115 kg (CV = 32.8%), which excludes 27.8% and 37.8% (i.e. a width of 10%), more than 100 animals are needed. But, for the CV of L* (CV = 6.3%), the sample size needed to obtain in the same group of animals, a CI95% with the same width of 10% (that excludes 1.3% and 11.3%), is lower than 10. In this study, considering a desired width of 20% for the CI95% the sample sizes used were appropriate to test differences in uniformity of traits with a CV lower than 20%. This is the case of all the traits analysed with the exception of backfat and drip loss.
Results using the CV or the CD were not always consistent. For carcass, loin and hams, weight differences among some groups of animals were statistically significant according to the confidence bounds of CV, but not those of CD (Table 2). The lack of normality for the trait distribution seems not clearly related with this inconsistency. Normality was not tested for each ‘sire breed–sex–slaughter weight’ group because of the small sample size, but considering the distribution of the overall data only carcass weight failed the assumption of normal distribution, not loin and hams weights (Table 1). In addition, inference on pH uniformity differences were similar using both statistics when normality was significantly rejected (Table 3). It is known that no single measure of dispersion is ideal in all applications (Bonett, Reference Bonett2006), and the simultaneous use of different measures could be of interest.
In summary, though uniformity in carcass and meat quality traits could be affected by sire terminal genotype, there is a huge animal variability that is not explained by sex, slaughter weight and batch. This lack of uniformity is especially important for water-holding capacity, fatness and loin weight. Actions at farm and slaughter levels seem to be still necessary to increase the uniformity needed in pork quality programmes and efficient pork packing lines. Box plots are graphical ways to detect apparent differences in group’s uniformity, and the CV and the CD are two statistics useful to measure it. Nevertheless, differences among groups should be statistically tested for proper inferences on uniformity, and CIs of the CV and the CD can be a simple and useful tool.