1. Introduction
There is a growing concern among economists and policymakers that many individuals have insufficient savings for retirement (Crawford and O'Dea, Reference Crawford and O'Dea2012; Munnell et al., Reference Munnell, Webb and Golub-Sass2012; Benartzi and Thaler, Reference Benartzi and Thaler2013). Two trends make this concern pressing. First, rapidly expanding life expectancies mean absolute levels of savings must be greater to sustain lifestyles in retirement. Second, the shift from defined benefit (DB) pensions to defined contribution (DC) pensions combined with widespread scaling back of state pension entitlements (OECD, 2015) transfers much responsibility for retirement planning from professionals and institutions to individuals (Broadbent et al., Reference Broadbent, Palumbo and Woodman2006; Poterba et al., Reference Poterba, Rauh, Venti and Wise2007; Baldwin, Reference Baldwin2008).
This transfer of responsibility is unproblematic if individuals have the wherewithal to make good retirement planning decisions, benefitting from available subsidies and investment returns in a manner that maintains income and smooths spending over the life span. Unfortunately, evidence from behavioural economics questions whether individuals have such decision-making capacity. Despite the fact that it is a financial choice with potentially large consequences, the decision over whether and how much to save for retirement, and in what form, can be easily and substantially altered by how pension choices are presented (e.g., Madrian and Shea, Reference Madrian and Shea2001; Thaler and Benartzi, Reference Thaler and Benartzi2004; Iyengar and Kamenica, Reference Iyengar and Kamenica2010). With respect to coverage, younger workers may not start a pension because of lack of knowledge or myopia (Foster, Reference Foster2017). Statistics suggest the number of young workers with a pension plan is declining in many countries. Several countries have followed the lead of New Zealand in implementing auto-enrolment, though its appropriateness as a policy instrument is debated, since default contribution rates may be insufficient (Carroll et al., Reference Carroll, Choi, Laibson, Madrian and Metrick2009; O'Dea, Reference O'Dea2015). Those who do take out a pension may find it difficult to decide on an appropriate contribution rate (Banks and Oldfield, Reference Banks and Oldfield2007). Pensions are complex products involving multiple subsidies, a trade-off between present and future income, and essential financial concepts such as interest compounding, inflation and diversification. Less than one-third of young American adults understand these concepts (Lusardi, Mitchell and Curto, Reference Lusardi, Mitchell and Curto2010), while the least financially literate are also least likely to save for retirement (Lusardi and Mitchell, Reference Lusardi and Mitchell2007). Complexity and comprehension may, therefore, turn out to be central issues in the retirement savings problem.
The current study was undertaken in the Republic of Ireland. The Irish pension system shares commonalities with other European countries. Public sector employees face compulsory enrolment in DB plans. Private sector employees can voluntarily enrol in occupational DC plans where their contribution is matched by the employer.Footnote 1 The OECD noted in a review on the Irish system that private pension coverage ‘needs to be increased urgently’ (OECD, 2014, p. 11). The percentage of 25–34 years old in employment with a pension plan fell from 49% in 2009 to 36% in 2015 (CSO, 2016). Auto-enrolment into DC plans is on the policy agenda and set to take effect in 2022 to bridge the retirement savings gap (Government of Ireland, 2017). At present, the State pension provides a replacement rate of 34% of the average wage, which is insufficient without supplementation from another source relative to general pension adequacy target rates of approximately 70% (Mitchell and Moore, Reference Mitchell and Moore1998; Scholz and Seshadri, Reference Scholz and Seshadri2009). A recent report from Ireland's largest pension provider disclosed that in 2014 the average total contribution of its DC scheme members was 10.3% of salary and that the projected replacement rate (including state pension) for a typical member was 43% (Irish Life, 2014).
The present study focuses on one potential method by which pensions might be simplified and comprehension improved. Based on previous work in educational psychology, we set out to test the influence of explanatory diagrams. As described below, diagrams have been shown to promote learning in other domains where decision makers are faced with comparative complexity. In collaboration with Ireland's regulator, the Pensions Authority, we conducted an incentivised laboratory experiment in which we manipulated the presence or absence of two diagrams on a Pension Benefit Statement (PBS), comparing outcomes against conventional tables and text. The annual PBS summarises the current financial position of a member's account. Because it is the most regular and salient form of information disclosure that pension scheme members receive, its content and format have drawn the attention of policymakers. Recent EU legislation revised the guidelines for the PBS with the intention to ‘provide clear and adequate information to prospective members, members and beneficiaries to support their decision-making about their retirement’ (Directive (EU) 2016/2341, recital 46). The experiment we describe tested how the format of the PBS influences recall, understanding and decisions about contributions. The work therefore represents an example of empirically informed regulation (Sunstein, Reference Sunstein2011).
We designed and tested two diagrams. The first depicted the three components of the annual total contribution (employee contribution from take-home pay, employer match, tax relief). The second showed how different contribution levels related to projected fund sizes and monthly pensions at retirement. The presence of these diagrams was randomly manipulated across PBSs assigned to a representative sample of working-age individuals. We tested whether the explanatory diagrams improved scores on incentivised recall and comprehension questions, then whether they affected decisions about contribution levels and the rationales participants gave for their decisions.
The results indicated no clear and consistent influence on explicit recall or comprehension. Positive effects recorded for a subset of questions were marginal. Nevertheless, the explanatory diagrams did influence decision-making. Participants who saw the graphic depicting projected fund sizes were more inclined to propose raising the contribution level. Both diagrams influenced the reasons participants gave for their decision, increasing the likelihood that they cited the financial mechanism that each graphic depicted. The primary contribution of the paper, therefore, is to demonstrate that diagrams designed to explain how pensions work can support decision-making by facilitating relevant causal thinking, while not necessarily measurably improving comprehension of pension products. This is important in the context of the literature on informational interventions, which we describe below, since it provides potential insights into underlying mechanisms with implications for the quality of decisions.
The paper makes two further contributions. First, our results go beyond existing survey evidence in revealing not just that pension products are hard to understand, but that they remain so even when individuals pay attention to and read documentation. In the experiment, a representative sample of adults was incentivised to read and absorb typical information available to scheme members, presented in the simplest and clearest form we could develop. Yet the products remained disconcertingly difficult to comprehend. Tax relief and matching contributions were particularly problematic, with implications for their effectiveness as incentives. Second, the empirical results are of potential use for the broader provision of information, both regarding pensions and other financial products. The kind of diagrams we designed and tested may be helpful in multiple types of advice, marketing material and disclosures.
The paper proceeds as follows: Section 2 reviews relevant literature and motivates our hypotheses. Section 3 describes the experiment and its results. Section 4 concludes and discusses implications.
2. Literature review and hypotheses
2.1 How well do people understand their pensions?
Survey evidence suggests that members’ knowledge and understanding of pension products is limited, particularly in relation to contribution details and projected pension entitlements. In the USA, workers are not well informed about details of their pension plan (Mitchell, Reference Mitchell1988) or their expected pension benefits (Bernheim, Reference Bernheim, Campbell and Lazear1988; Gustman and Steinmeier, Reference Gustman and Steinmeier2005). This latter study reported that many workers in DC schemes did not realise their employer contributed to the pension, with just a small minority knowing that the employee's pay determined employer contributions. Dvorak and Hanley (Reference Dvorak and Hanley2010) recorded a somewhat higher level of understanding of DC plans, though the authors note that survey selection bias and the sample pool (employees of a small liberal arts college) may have led them to overestimate understanding relative to the broader population. Using longitudinal data, Dushi and Honig (Reference Dushi and Honig2015) reported better knowledge about inclusion in a DC scheme among the more recent cohort. However, conditional on inclusion, members of this cohort displayed no better knowledge than previous cohorts about the size of contributions and were equally inclined to systematic overestimation.
Among a sample of older English people, Crawford and Tetlow (Reference Crawford and Tetlow2012) found that over half those aged 50–64 who were not retired could not report the exact amount they expected to get at retirement. A majority had never thought about how many years of retirement they might need to finance. Similarly, Barrett et al. (Reference Barrett, Mosca and Whelan2015) reported that two-thirds of pension scheme members aged 50 and over in Ireland did not know what their payment in retirement would be or the form it would take. Accuracy of beliefs about retirement benefits improves with age (Gustman and Steinmeier, Reference Gustman and Steinmeier2005; Bottazzi et al., Reference Bottazzi, Jappelli and Padula2006; Guiso et al., Reference Guiso, Jappelli and Padula2013), suggesting that results for these older samples probably represent upper bounds of knowledge in the wider population.
Lastly, there is a modest amount of evidence in relation to members’ understanding of information relating to the costs of pension plans. Thorp et al. (Reference Thorp, Bateman, Dobrescu, Newell and Ortmann2017) employ a choice experiment to show that individuals are more inclined to switch plans when cost information is displayed as a monetary amount rather than a percentage of fund assets, implying a difficulty processing the latter format. More generally, there is a strong evidence that many investors pay insufficient attention to information about fees for investment products (Grinblatt et al., Reference Grinblatt, Ikäheimo, Keloharju and Knüpfer2015, and references therein).
2.2 Improving understanding and decision-making
Given the above findings, an important question that arises is whether understanding can be improved and, if so, what impact this might have on decision-making. There is some evidence that interventions designed to improve understanding can lead to higher participation in retirement savings plans. Duflo and Saez (Reference Duflo and Saez2003) used relatively small incentives to encourage individuals to learn more about retirement savings vehicles and found that this intervention boosted participation. Bernheim and Garrett (Reference Bernheim and Garrett2003) reported large impacts of the provision of financial education seminars in the workplace on individual savings behaviour. However, other studies report that positive knowledge effects of information campaigns about pensions can be quite short lived (Finseraas et al., Reference Finseraas, Jakobsson and Svensson2017). Dolls et al. (Reference Dolls, Doerrenberg, Peichl and Stichnoth2018) exploited a natural experiment in Germany whereby there was a phased roll-out of letters that provided detailed information to individuals about their expected pension entitlements. Letter recipients increased retirement savings without reducing other forms of savings. From a policy perspective, this latter study provides evidence that targeted information can influence individual behaviour on a large scale.
Although the above studies provide some encouragement that understanding of pensions can be improved, with a knock-on effect for decision-making, it would be beneficial to have more insight into the mechanisms involved. Dolls et al. suggest reduced costs of information acquisition as one possible cause of their positive finding and increased salience as another. In particular, they focus on correcting the overestimation of an individual's future pension entitlements. Corroborating evidence on the impact of personalised information about expected pension income comes from a Chilean randomised controlled trial (Fuentes et al., Reference Fuentes, Lafortune, Riutort, Tessada and Villatoro2017). The contributions of a treatment group provided with simple, personalised information explaining how they could increase their expected pension were compared with those of a control group provided with only generic information. Administrative data revealed a 10–15% increase in voluntary additional contributions in the treatment group.
Several other interventions have focused on one of two specific aspects of pension schemes: the composition of contributions and the dynamics of fund growth. Duflo et al. (Reference Duflo, Gale, Liebman, Orszag and Saez2006) used a large randomised field study to compare the effect of the US government's Saver's Credit tax relief to an economically equivalent subsidy in the form of a simple and transparent matching contribution. The results showed a large positive effect of the ‘match’ presentation format on take-up and contribution rates compared with the more complex tax relief condition, implying a link between simplicity and willingness to make contributions. The complexity of tax incentives may partly explain why studies find them to be ineffective in boosting retirement savings (Börsch-Supan, Reference Börsch-Supan2004; Echalier et al., Reference Echalier, Adams, Redwood and Curry2013; Ramnath, Reference Ramnath2013). With respect to fund growth, previous studies have emphasised systematic underestimation of compound interest, part of the broader phenomenon of ‘exponential growth bias’ (EGB) (Wagenaar and Sagaria, Reference Wagenaar and Sagaria1975). Controlling for background characteristics, households with greater EGB borrow more and save less (Stango and Zinman, Reference Stango and Zinman2009). Goda et al. (Reference Goda, Manchester and Sojourner2014) used a large field experiment to test two treatments in mailed information brochures designed to combat EGB. A ‘balance’ treatment contained a projection of how additional contributions would translate into assets at retirement. An ‘income’ treatment added a customised projection of the additional annual income generated by these assets. The latter intervention was effective in increasing contributions relative to a control group.
These previous studies suggest that learning about retirement savings and simplified, salient information disclosures may induce higher pension contributions. The mechanism involved is generally assumed to be better understanding of one or more features of the pension product, such as more realistic expectations of personal pension income, improved appreciation of matching contributions, or a better grasp of the exponential nature of money growth. However, the above studies, most of which are field trials of interventions, do not explicitly measure understanding. It remains possible that increases in take-up or contributions are driven by other factors such as familiarity or engagement, rather than improved knowledge or comprehension of pension products. To the best of our knowledge, the present laboratory study is the first on simplifying pension disclosures to combine explicit measures of recall and understanding with a decision task. By experimentally manipulating information on PBSs, we are able to test understanding and observe decisions, while manipulating information specific to the composition of contributions and to perceptions of money growth, for varying levels of expected pension income.
2.3 Explanatory diagrams
We consulted educational psychology literature to see what tools, if any, improved attention to and recall of information, and comprehension of complex topics. In a systematic review of health information, Houts et al. (Reference Houts, Doak, Doak and Loscalzo2006) found that pictures closely linked to text markedly increased attention to and recall of health education information relative to text information without pictures. This finding applies even where individuals have strong incentives to learn. For instance, in a randomised controlled trial, Delp and Jones (Reference Delp and Jones1996) found that emergency room patients who needed to care for their wounds were more likely to read and (conditional on this) recall information when it was presented with explanatory illustrations rather than solely as text. Eye-tracking data also confirm that pictures can be superior to text in attracting attention (e.g., Pieters and Wedel, Reference Pieters and Wedel2004). If such findings carry over to the domain of pension information, explanatory diagrams may capture attention and consequently improve recall of product information. This possibility constitutes our first hypothesis:
H1
Explanatory diagrams will lead to better recall of information contained in the PBS, relative to conditions with no diagram.
The use of explanatory diagrams often has a beneficial impact on comprehension compared with text-based explanations (Mayer, Reference Mayer2002; Butcher, Reference Butcher2006; McCrudden et al., Reference McCrudden, Schraw, Lehman and Poliquin2007), giving credence to the folk wisdom that ‘a picture is worth a thousand words’. More specifically, these studies report that explanatory blocks of text often fail to impart understanding of causal relationships, while simple diagrams can assist causal thinking. Although the mechanism is not fully understood, diagrams appear to be efficient in either unlocking additional cognitive capacity or simply eliminating the superfluous. Ainsworth (Reference Ainsworth2006) posits that different representations of information lead learners to use different cognitive strategies. In a verbal protocol analysis, Cromley et al. (Reference Cromley, Snyder-Hogan and Luciw-Dubas2010) showed that high-level cognitive activities, such as inferences, were used more often when comprehending diagrams than when reading text, albeit with the caveat that students often skipped diagrams. These findings inform our second hypothesis:
H2
Explanatory diagrams will improve comprehension of information contained in the PBS.
The effectiveness of diagrams in promoting causal thinking suggests potential merit in using diagrams to communicate information about the relationships that underpin pensions. Two key inferences are that increasing the contribution from take-home pay leads to an (often substantially) larger increase in the overall contribution and that increasing the contribution generates a proportionally greater increase in the projected fund. These inferences lead to the next two hypothesis:
H3
Participants with better comprehension of the PBS contents will be more willing to increase contributions.
Given H2 and H3:
H4
Explanatory diagrams will increase willingness to increase contributions to the pension.
Lastly, since causal thinking involves individuals understanding that one thing leads to another, we further hypothesise an impact on how individuals explain their decisions:
H5
Explanatory diagrams will improve the coherence of rationales for pension decisions due to the positive effect of diagrams on causal thinking.
In addition to hypotheses H1 to H5, we investigated whether recall, comprehension or decision-making was affected by presenting information about costs charged to pension members (e.g., annual management changes) in a narrative or in a tabular format (similar to a bank statement). This manipulation was motivated by the regulator's concerns that many individuals did not pay attention to or comprehend pension costs. While there is evidence that displaying costs as a monetary amount or a percentage of assets alters choices (Thorp et al., Reference Thorp, Bateman, Dobrescu, Newell and Ortmann2017), we had no prior hypothesis about the impact of tabular versus narrative presentation on recall, comprehension and decision-making.
3. Experiment
We designed and conducted a laboratory experiment in which participants read a single PBS form and answered questions about its contents, with key aspects of the PBS manipulated between subjects. The experiment centred on a hypothetical scenario. Participants were asked to consider a request from a friend to read a PBS and to provide advice. Although the scenario was hypothetical, participants were incentivised, given time to read the PBS carefully, and knew that it would form the basis of their subsequent responses. We judge it likely that knowing this led our participants to pay at least as much, if not more attention to the PBS than a person typically would when an annual PBS arrived through the post. Furthermore, while acknowledging that participants’ responses might have been affected by the fact that the PBS information related to a third party, the comparison of responses between conditions is likely to be instructive as to how different formats of the PBS interact with cognitive mechanisms involved in judgement and decision-making. Where alternative PBS formats generate different patterns of responses, the implication is that formats engage cognitive mechanisms in systematic ways, with consequent relevance for real-world contexts.
The experiment followed a 2 × 2 × 2, orthogonal, between-subjects design. The three manipulations were the presence of a diagram (versus a table) designed to illustrate contributions, the presence of a diagram (versus a table) designed to illustrate projected pension income, and the presence of a table (versus text) designed to inform about costs. Ideally, for making inferences about psychological mechanisms, the information content between the diagram and non-diagram conditions would be identical. In practice, there were some small variations in information regarding the contributions diagram, because the study was conducted in collaboration with the regulator and the designs tested were intended for potential use as industry templates. We highlight these differences where relevant below. The orthogonal design ensured that both sides of each manipulation were encountered by half the experimental sample and the eight possible combinations of the three manipulations were present on the PBS for exactly one-eighth of the sample. Other aspects of the PBS, including the member's age, income and starting age of saving were randomised according to realistic parameters for the Irish market.
Participants first read the PBS, then responded to factual questions about its contents without being able to refer back to it. They then answered comprehension questions with the PBS back in front of them for reference. They were then asked to give advice based on the PBS contents and to provide a rationale for their advice. Lastly, they provided some personal information about their own circumstances.
3.1 Method
3.1.1 Participants
Participants were recruited by a market research company to match a specification of 176 Dublin-based consumers aged 22–55 years, balanced by age and working status. The sample was a close match to the local population in terms of age (mean = 37.3, SD = 10.36, approximately evenly distributed across 5-year age categories) and gender (85 male, 91 female). Relative to Central Statistics Office (CSO) figures, the proportions of the sample with a degree (59% versus 51%) and working (82% versus 69%) were somewhat higher than in the regional population.Footnote 2 Each was paid a guaranteed €30 for participation in the present experiment and an unrelated study. Performance in the experiment was incentivised via a lottery in which participants could win a €50 shopping voucher. Additional lottery tickets were earned for correct responses (to each question with an objectively correct answer). One in ten participants stood to win a voucher and participants were aware of this chance of winning. The experiment conformed to institutional ethical procedures. The session lasted approximately 1 h.
3.1.2. PBS forms
The PBS forms were based on the existing templates provided by Ireland's pension regulator. They were three pages long and comprised eight sections. The experimental manipulations centred on Sections 4, 5 and 7.
Section 1 gave eight pieces of information: name, age, marital status, pensionable salary, membership number, retirement age, retirement date and years to retirement. Membership number and retirement age (68) were held constant across all forms. The other information varied. Half the forms had female names, the other half male. On half the forms, the pension member was married, on the other half single. On half the forms, the starting contribution equated to 3.2% of take-home pay, on the other half 4.8%, generating total contribution rates that spanned the average of 10.3% quoted by Ireland's largest provider of DC schemes (Irish Life, 2014). The age of the pension member varied from 23 to 54. Salaries were selected pseudorandomly from a range beginning at €22,425 and increasing in increments of €125 up to the high-rate tax cut-off of €33,300, then in increments of €475 up to a maximum of €75,100. Thus, half the forms described members taxed at Ireland's standard 20% rate, the other 88 at the higher 40% marginal rate. A moderate correlation was imposed between age and salary. Deciding to vary these attributes somewhat reduced statistical power in relation to our main effects, but improved the ability to generalise findings beyond a specific pension situation. Due to the strong policy focus of the study, we erred on the side of generalisability. Also, pilot work suggested that even realistic but relatively high pension incomes strike most people initially as low, limiting the degree to which this variation was likely to drive responses. The 176 different salaries were assigned to equivalise the mean salary across the eight PBS types.
Section 2 was titled ‘How much have I built up so far?’ and detailed the balance in the retirement savings account at the start and end of the year. The starting balance ranged from €10,590 to €110,590, with a moderate positive correlation between starting fund size and salary.
Section 3, ‘How much might I get when I retire?’, displayed two projections for fund size at retirement and the pension that fund size might buy, one based on an ‘expected’ scenario and the other on an ‘unfavourable’ scenario.Footnote 3 These projections used the assumptions laid out by the regulator in its online pension calculator.
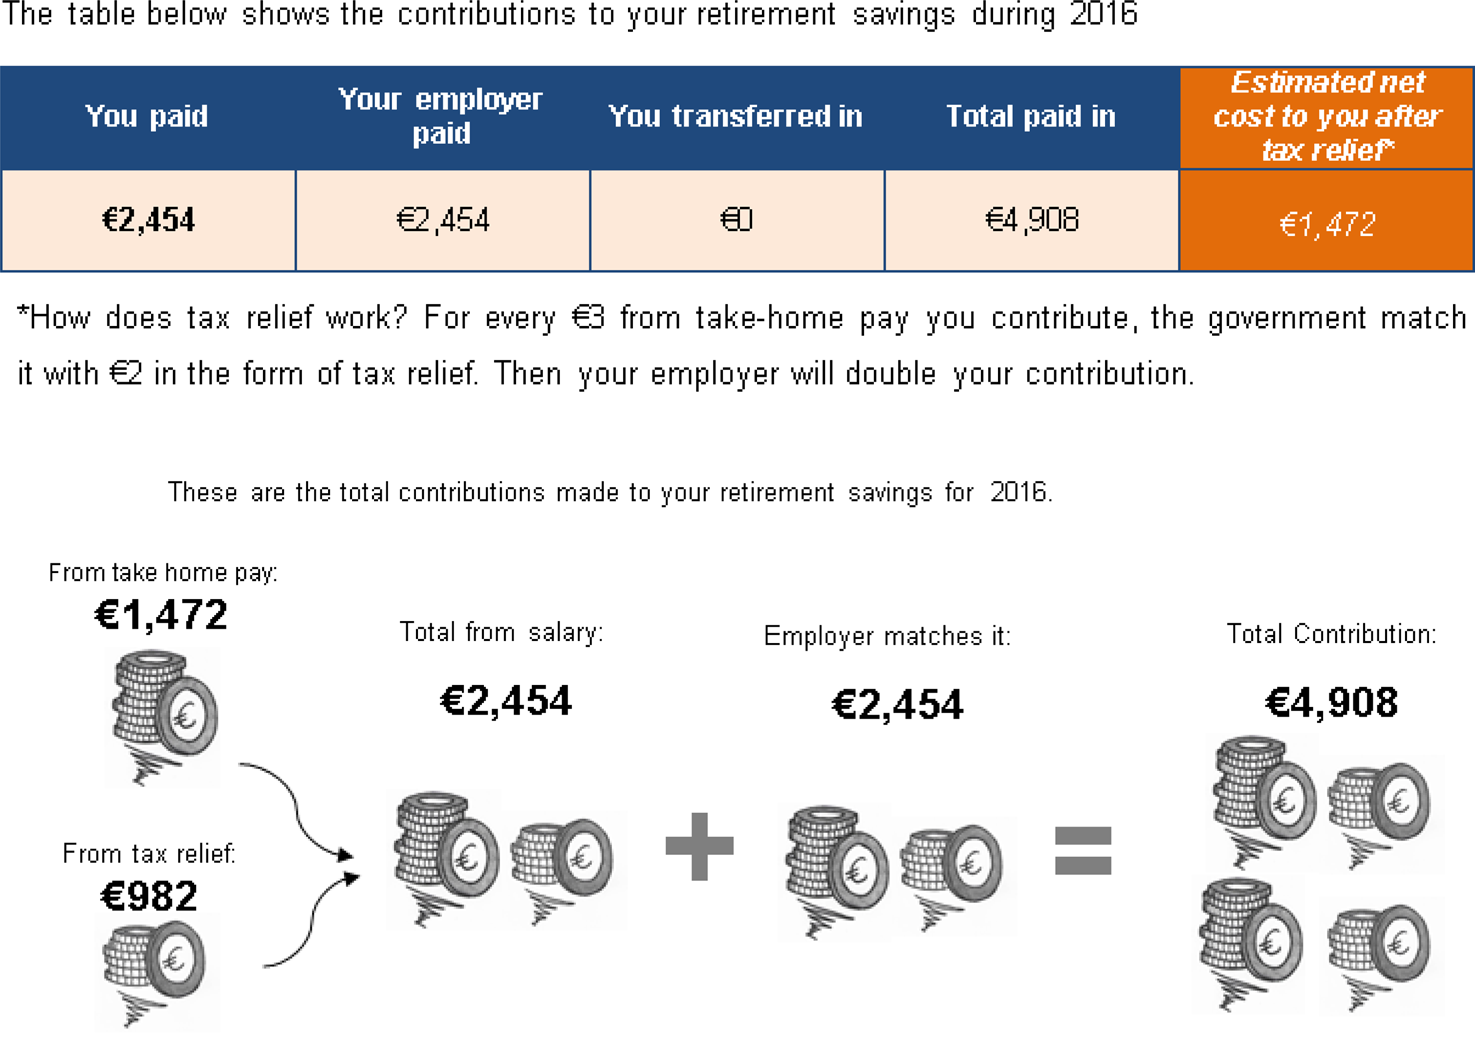
Section 4 presented the breakdown of contributions. Half the participants saw the standard contributions table (Appendix A, Figure A1, top). Underneath was a brief explanation of how tax relief works. The other 88 participants saw our contributions diagram (Appendix A, Figure A1, bottom). Stacks of Euro coins represented each element, with arrows and symbols indicating relations between them. There was no text description of how tax relief works.
Section 5 was titled ‘Charges and Investment Return’. Half the participants received a tabular version laid out somewhat like a bank statement (Appendix A, Figure A2, top), the other half a narrative version containing cost information in a short paragraph of text (Appendix A, Figure A2, bottom). The two formats also differed somewhat in that the tabular version included totals for the overall fund size.
Section 6 detailed how the pension member's details had changed since the previous year. On all forms, the salary (and hence contribution) increased by 2.5%.
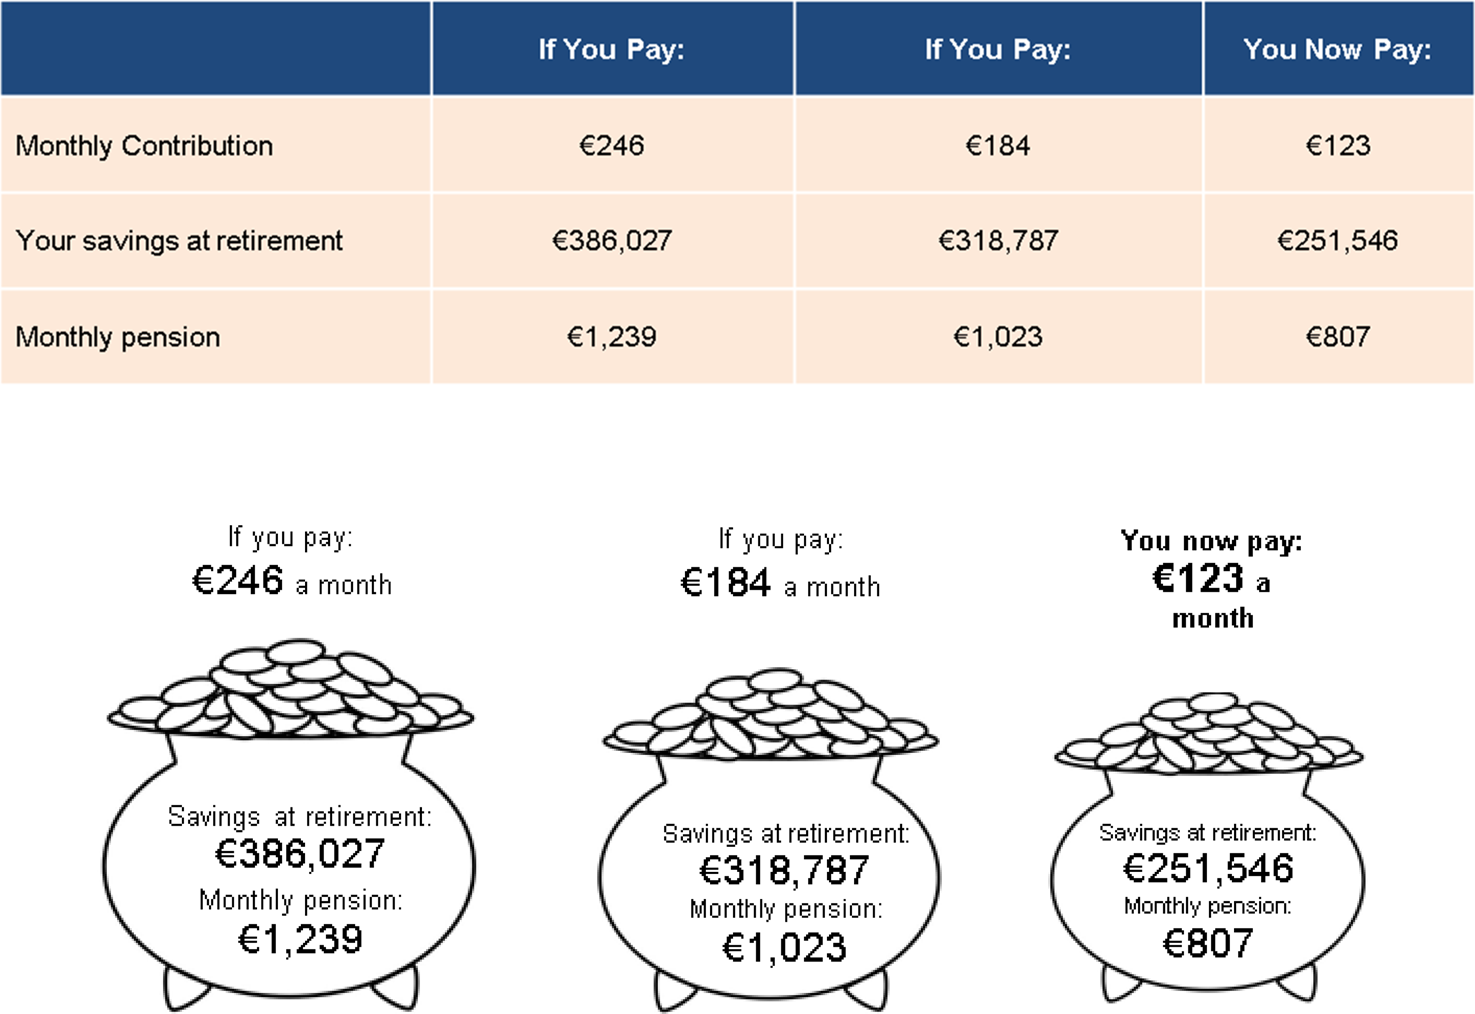
Section 7, ‘Income Now for Income Later’ (hereafter INFIL), described how savings at retirement could be increased by contributing more now. Half the participants received a tabular version (Appendix A, Figure A3, top), with different columns showing alternative monthly contributions from take-home pay, projected fund sizes at retirement and the commensurate pension. The columns compared the current contribution with increases from take-home pay of 50% and 100%. These increases equated to contribution rates of 4.8% and 6.4% of monthly take-home pay for the participants whose starting contribution was 3.2%, or 6.4% and 9.6% for the group that started at 4.8%. The INFIL diagram shown to the other 88 participants was based on the same figures, but the projections were placed inside cartoon pots of money of increasing size (Appendix A, Figure A3, bottom).
Section 8, ‘How do I find out more?’, provided additional information available from the pension provider. This standard section was identical on all forms and did not contain information relevant to the experiment.
3.1.3 Questionnaire
Responses were obtained via a computerised questionnaire programmed in Python using the PsychoPy package (Peirce, Reference Peirce2007; Reference Peirce2009) and presented on individual 14’ laptops. The questionnaire consisted of four stages. The first was conducted after participants initially read the PBS and placed it back in its envelope. The PBS was taken back out again for the remaining sections (see Procedure). We relate the tests in each stage to Bloom's taxonomy (Bloom et al., Reference Bloom, Englehart, Furst, Hill and Krathwohl1956) which represents a hierarchical structure of learning, ranging from the simple and concrete (i.e., obtaining knowledge) to the complex and abstract (i.e., synthesising and evaluating relationships and evidence). The original taxonomy was revised in 2001 (Anderson et al., Reference Anderson, Krathwohl, Airasian, Cruikshank, Mayer, Pintrich, Raths and Wittrock2001) to account for the active nature of learning and to more clearly capture both the cognitive and knowledge dimensions of learning.Footnote 4 Though the ecological validity of its imposed hierarchy of learning outcomes has been questioned (Furst, Reference Furst1981; Case, Reference Case2013), it is a commonly used framework that is useful in the context of this study.
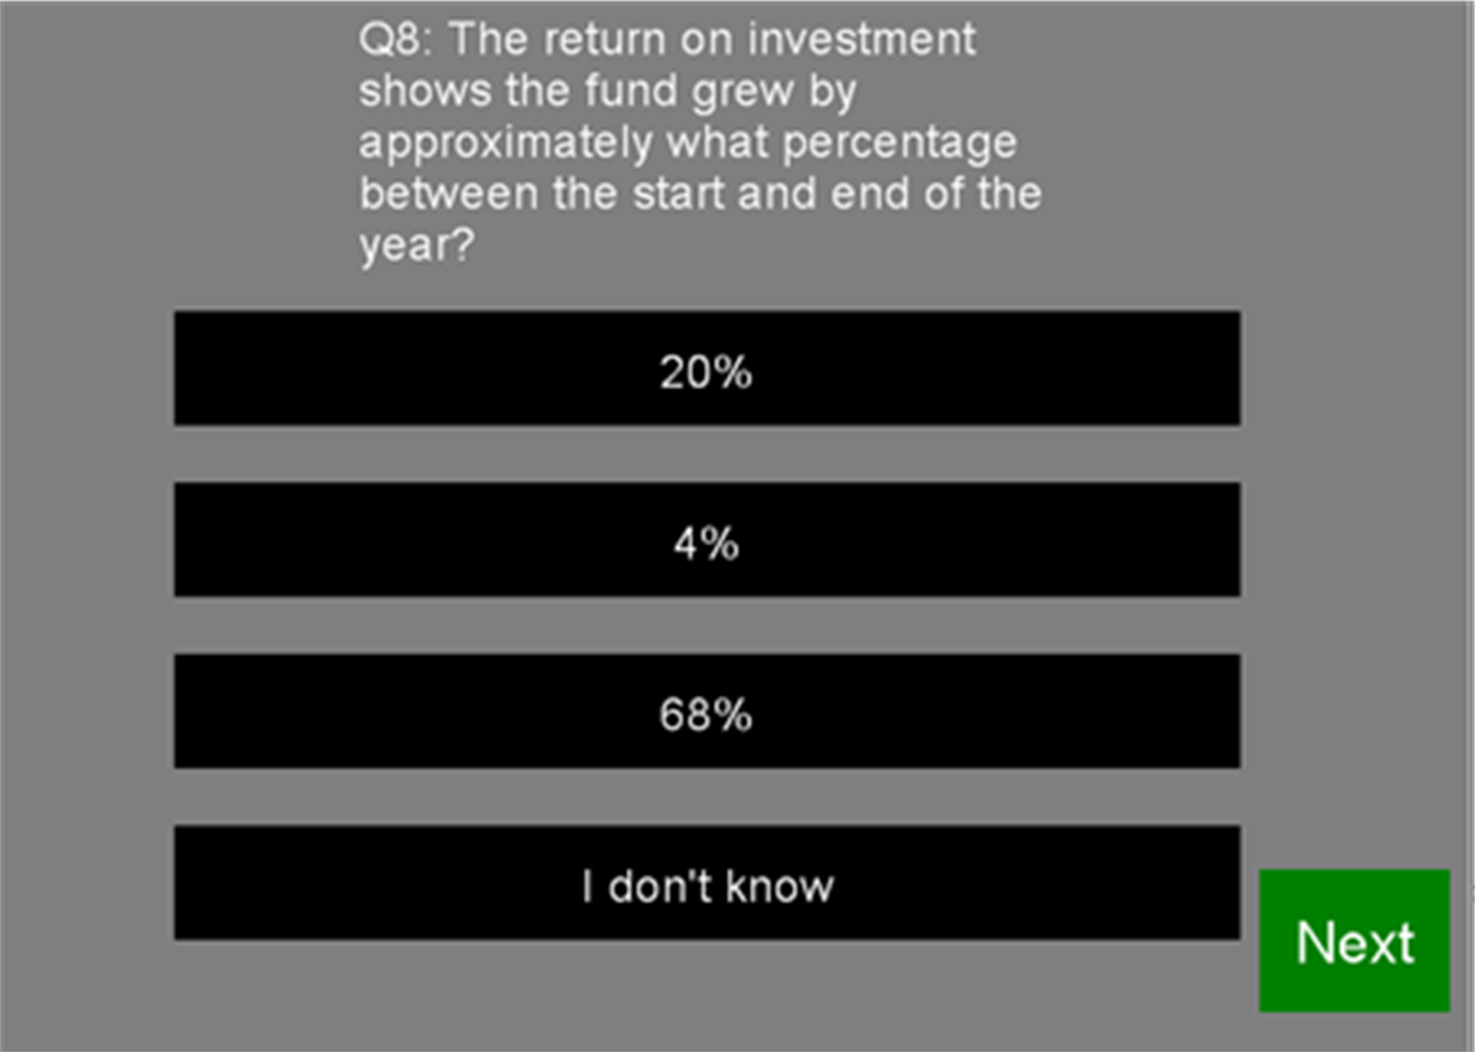
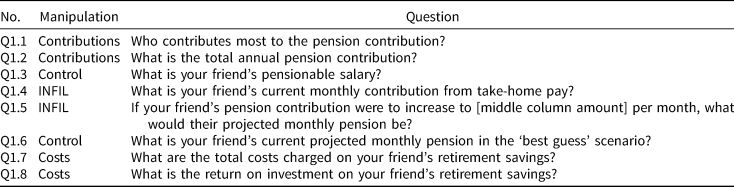
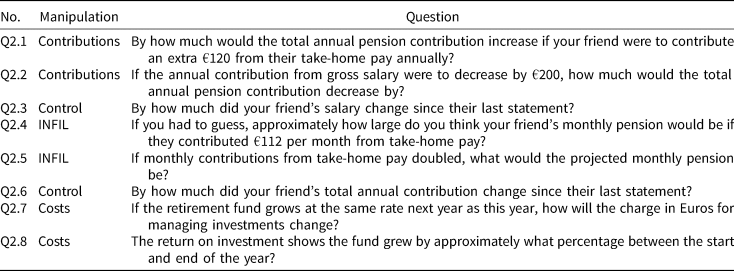
Stage 1 involved eight multiple-choice questions (MCQs) that tested the knowledge absorbed on first reading the PBS, by requiring recall (or recognition via one of the available answers) of a specific piece of factual information. Stage 1 MCQs thus corresponded the first stage of Bloom's taxonomy of learning, namely remembering factual and conceptual knowledge (Krathwohl, Reference Krathwohl2002). Two questions were related to each of the three main manipulations, while the remaining two were control questions. The specific questions are provided in Appendix A (Table A1); Figure A4 shows a screenshot. The position of the correct answer was randomised. For numeric questions, incorrect answers were pseudo-randomised to be 10%, 15% and 25% larger or smaller than the correct answer, such that the correct response was equally likely to be the largest, second largest, second smallest or smallest answer. After completing the eight questions, participants judged confidence in their answers on a scale of 1–7.
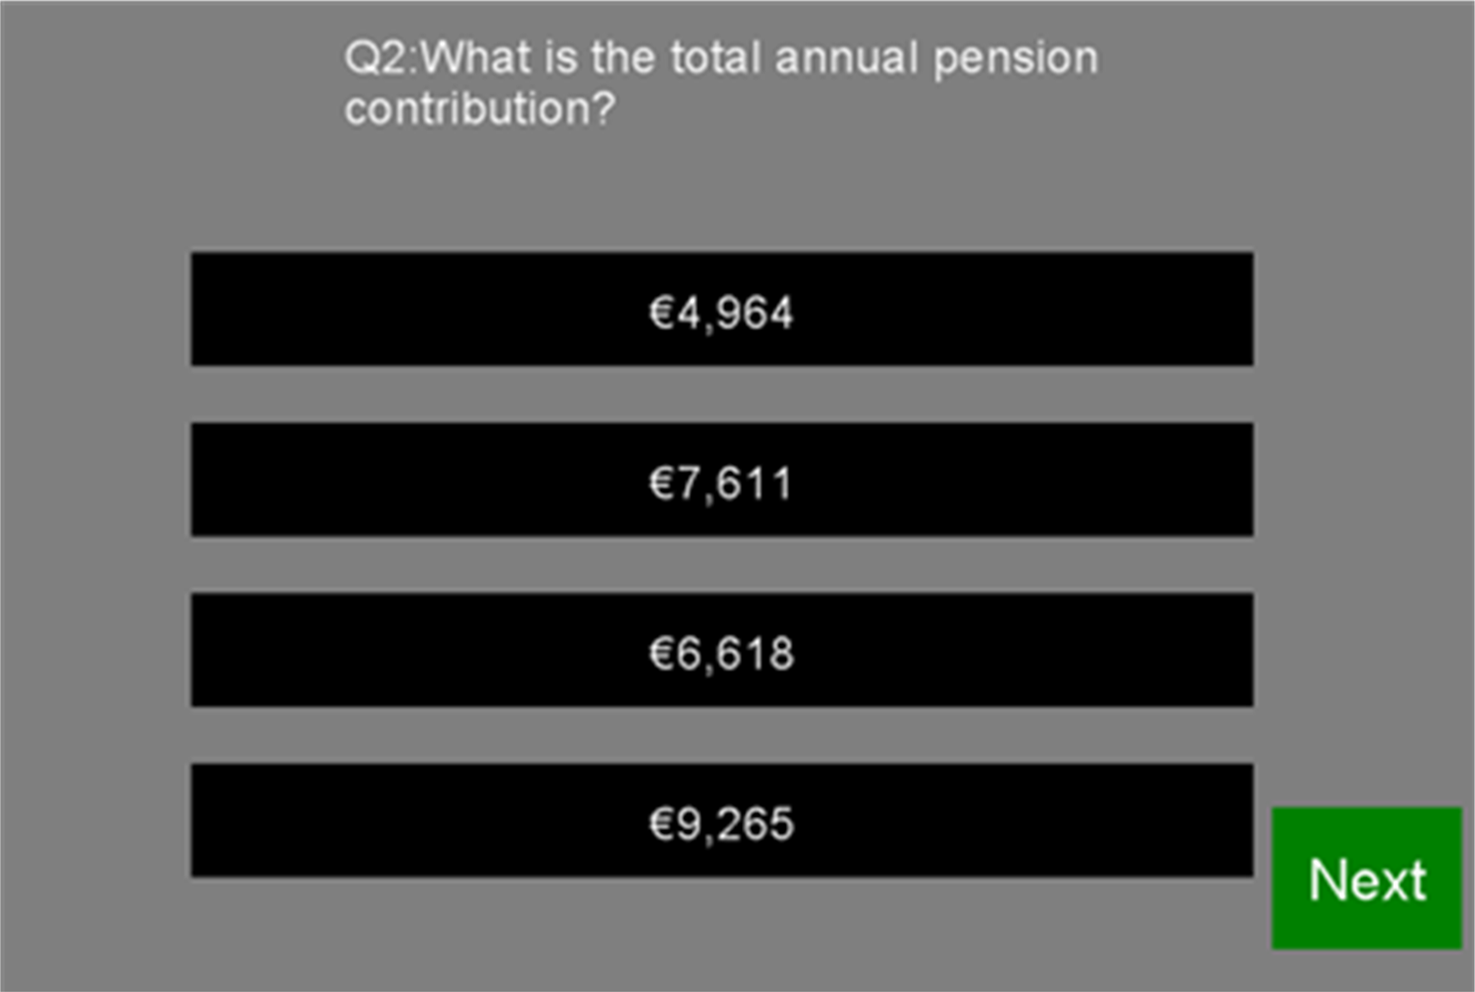
Stage 2 comprised eight MCQs that probed comprehension. These questions did not test factual knowledge that could be obtained directly from the PBS, but were designed so that participants had to understand a conceptual relationship and perform a simple calculation or estimation based upon it. These MCQs corresponded to understanding and applying conceptual knowledge in Bloom's taxonomy (Krathwohl, Reference Krathwohl2002). For instance, Q2.1 read ‘By how much would the total annual pension contribution increase if your friend were to contribute an extra €120 from their take-home pay annually?’ The answer to this question was not written on the form. Instead, it required participants to understand that tax relief added a proportion to the contribution from take-home pay (in this case raising €120–€200), and that the resulting amount would then be doubled by the matching contribution from the employer (from €200 to €400). Because we were not interested in the ability to perform precise arithmetic, the underlying sums involved round numbers and the magnitudes of the available answers were such that a participant who correctly understood the conceptual relationship underlying the contributions could identify the correct answer through estimation without having to perform the sum, because other available answers were of substantially different magnitudes consistent with misunderstandings of the conceptual relationship. For example, one incorrect answer was €240, which would seem correct if a participant understood that contributions were matched and did not understand how tax relief operated (or were unaware of it). Again, two questions targeted each manipulation. The questions are provided in Appendix A (Table A2); Figure A5 shows a screenshot. Incorrect answers were pseudo-randomised as in Stage 1. After completing the questions, participants again rated their confidence.
Stage 3 asked for advice based on the PBS form. They were instructed: ‘In Stage 3 your friend is going to ask you for some advice. There are no right or wrong answers, but please try to give the advice you would genuinely give to a friend of yours’. They were then asked: ‘Your friend wants to know whether you think they should change their contribution. What do you think they should do?’ The following responses were offered: ‘don't change it’, ‘decrease it a little’, ‘increase it a little’, ‘decrease it a lot’, ‘increase it a lot’, ‘I wouldn't feel comfortable giving a friend pension advice’. If the last option was selected, a screen appeared with the following text: ‘Your friend understands you don't feel comfortable giving pension advice, but they are insisting you at least give them your best guess. What option would you go for?’ Participants could choose: ‘increase pension contribution’, ‘decrease pension contribution’ and ‘don't change pension contribution’. Participants were then asked: ‘What are your reasons for giving this advice?’ and prompted to type an answer of up to 50 words. Thus, responses to these questions required participants to make a judgement, draw a conclusion and justify it. These are processes consistent with ‘evaluation’, the fifth level of Bloom's revised taxonomy, which is achieved when a learner can make judgements based on criteria (Krathwohl, Reference Krathwohl2002)Footnote 5. Lastly, participants again rated confidence in their decisions.
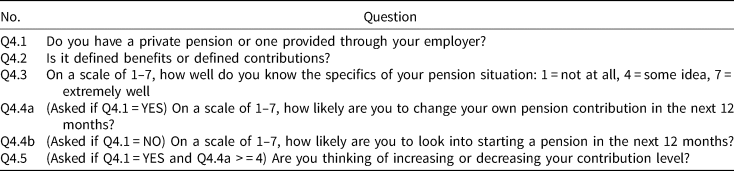
Stage 4 collected information on the participant's own pension situation and background. This included whether they had a private pension plan and, if so, whether it was a DB or DC pension. They rated their knowledge of their pension and whether they were intending to alter contributions. Participants also provided their gender, age and highest level of educational attainment. Questions are provided in Appendix A (Table A3).
3.1.4 Procedure
Participants arrived to the laboratory in groups of ten. PBS forms were randomly assigned and placed in an opaque envelope beside each laptop. Participants read and signed a consent form before attention was directed to the envelopes. The experimenter explained that participants were ‘to imagine you are at a friend's house and your friend has received this envelope in the post, and they would like you to look at it for them’. They were told the contents would form the basis for the following stages of the experiment. Participants had been informed in the consent sheet that there were performance-based financial incentives. Participants were asked to read the PBS carefully for 4 min, after which they returned the form to the envelope.
The experimenter then explained that onscreen instructions would guide them through four stages, but stressed that the first two stages involved MCQs, some of which may be quite difficult. The lottery incentive structure was described: ‘Before we start I want to remind you that one-in-ten of our participants will win a €50 [brand name] voucher for taking part in today's experiment. We are going to hold a raffle for these vouchers and everyone's name will go in at least once. But for each MCQ question you get correct, your name will go into the raffle for a €50 voucher an extra time. So please try your best as it will increase your chances of winning a voucher’. This incentive structure meant that even participants who felt they were unlikely to fare well relative to others still improved their chances with every good answer.
Participants proceeded at their own pace. Before Stage 2, an onscreen instruction told them to remove the PBS from the envelope again and use it to answer the questions. On finishing Stage 4, the questionnaire ended and participants were thanked. The majority of participants took between 15 and 20 min to complete the experiment.
3.2 Results
3.2.1 Recall questions
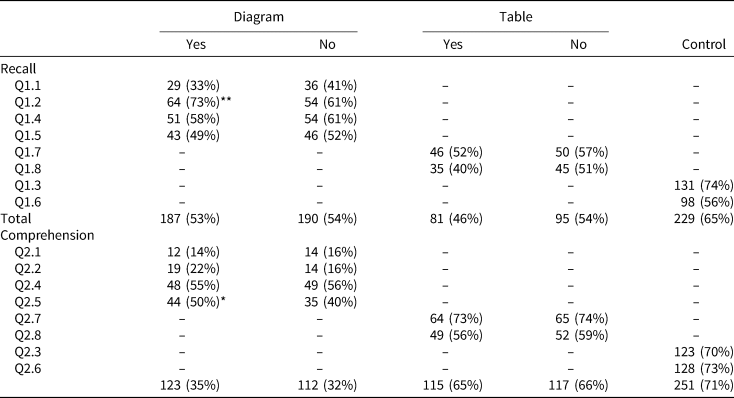
The number of correct responses in Stage 1 was approximately normally distributed across the 176 participants (mean = 4.43, SD = 1.57). Performance by question and format is shown in Table 1. Binomial tests of proportion were used to test whether diagrams improved recall. H1 is directional, so the appropriate test is one-tailed for comparisons between diagrams and tables. For the costs questions, tests were two-tailed. For Question 1.2, which asked participants to recall the total annual pension contribution, those who saw the contributions diagram were more likely to respond correctly (p < 0.05). All other differences were non-significant. Moreover, the slightly better performance on this question may have been influenced by more than the diagram. As mentioned above, in the case of contributions, there were some small differences in information content and there was arguably a slightly advantageous wording difference across the form types (‘Total Paid In’ versus ‘Total Annual Contribution’). However, as indicated by marketing eye-tracking studies, attention allocated to text is increasing in its font size – a potential advantage for emphasising key information via diagrams. The correct answer in the diagram was Arial Bold, font size 16, while in the table it was Arial, font size 9. Nevertheless, overall there was no consistent improvement in recall for participants with diagrams on their PBSs.
Number of correct responses by question for Stage 1 recall and Stage 2 comprehension

Percentage correct reported in parentheses.
*p < 0.1; **p < 0.05; ***p < 0.01.
Although participants were randomly assigned, logistic regressions were estimated to ensure that this result was robust to controlling for background characteristics. Separate models were estimated for correct/incorrect responses to each question, with condition, gender, age, educational attainment and whether the participant had a pension plan specified as control variables. The pattern of statistical significance was as in Table 1. The total number of correct answers was almost identical between conditions with and without the relevant diagram. There was a moderate positive correlation (Spearman's ρ = 0.34) between the number of questions answered correctly (0–8 inclusive) and the confidence rating elicited at the end of this stage.
3.2.2 Comprehension questions
The number of correct responses in Stage 2 was approximately normally distributed (mean = 4.07, SD = 1.60). Table 1 (bottom) shows correct responses by question and format. Participants shown the relevant diagram were marginally (p < 0.1) more likely to respond correctly to Question 2.5, which asked about the effect on the projected monthly pension of doubling contributions from take-home pay. This pattern was again confirmed in logistic regressions specified as described in subsection 3.2.1. The proportions of correct answers to the comprehension questions on contributions (Questions 2.1 and 2.2) were substantially lower than for the other questions. The total number of correct answers was closely similar by condition. Across all eight (recall and comprehension) relevant questions, performance was better without the diagram for five and better with the diagram for three. There was again a modest correlation (Spearman's ρ = 0.45) between the total correct and participants’ confidence ratings.
3.2.3 Advice by format
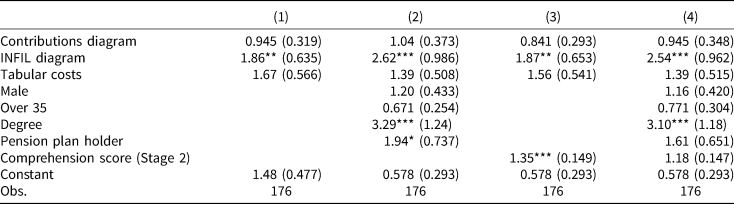
In Stage 3, the majority of participants (125) proposed that contributions should be increased, most (106) by ‘a little’. Table 2 reports odds ratios from a series of logistic regressions where the dependent variable is whether the participant proposed increased contributions. As previously, the diagrams are subject to one-tailed tests. Model (1) includes only the PBS formats as independent variables. Participants who saw the INFIL diagram were significantly more likely to recommend an increase. The estimated effect remains strong and is highly significant after control variables are added in Model (2), giving an odds ratio of 2.62. The contributions diagram and tabular costs had no significant effect. Model (3) introduces a variable for the number of correct answers to comprehension questions in Stage 2, which is positive and highly significant. The point estimate implies an odds ratio of 1.35 for each additional correct question. The introduction of this variable has no impact on the estimated odds ratio for the INFIL diagram. When control variables are added in Model (4), the comprehension variable becomes non-significant, while the INFIL diagram remains highly significant.
Logistic regressions for whether participant advised an increase in contributions
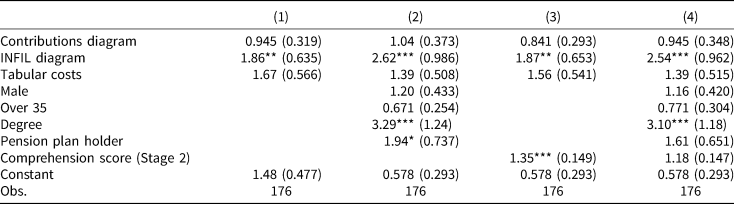
Output is given as odds ratios.
*p < 0.1; **p < 0.05; ***p < 0.01.
The experimental design incorporated realistic between-subject variation in starting ages, savings levels, salaries (and therefore level of tax relief) and contribution rates, with the result that there was also variation in implied replacement rates. The gross replacement rate was 20% on average (SD = 4.5%) and the net replacement rate was on average 27% (SD = 4.9%), with no differences in either across conditions. These variables were added to the model specifications shown in Table 2. In all cases, these variables were non-significant, implying no impact on the propensity to advise an increase in contributions.
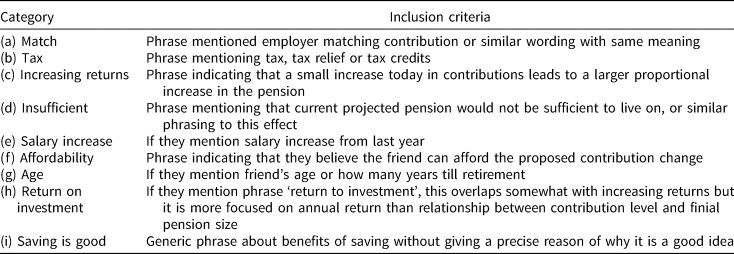
3.2.4 Rationale for advice by format
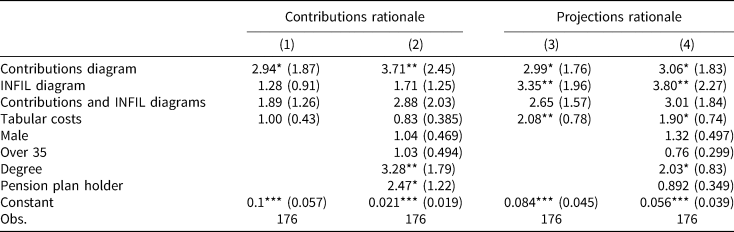
The reasons participants gave for their advice were coded independently by two researchers according to the protocol outlined in Appendix B. Both researchers were blind to the PBS formats of the participants. The intention of this coding was to act as a proxy variable for the making of the two key inferences that were highlighted in Section 2 and formed the basis for the diagrams. Two of the categories related to the composition of contributions: category (a), whether participants mentioned the employer matching contribution; and category (b), whether they mentioned tax relief. Similarly, two of the categories related to projections of pension income: category (c), whether participants mentioned increasing returns from contributing to the pension; and category (d), whether they mentioned the current projected pension being insufficient for retirement. Table 3 presents logistic regression models where the dependent variable is whether a ‘contributions’ (category a or b) or ‘projections’ (category c or d) rationale was given. Models (1) and (2) confirm that those who saw the contributions diagram were significantly more likely to produce a rationale for their advice based on tax relief or the employer match. Models (3) and (4) confirm that those who saw the INFIL diagram were significantly more likely to produce a rationale for their advice based on projected pension income or increasing returns. The contributions diagram and the tabular costs also generated increases in the likelihood of providing a ‘projections’ rationale, albeit that these estimated effects were smaller than the effect of the INFIL diagram.
Logistic regressions for whether participant's rationale for advice was based on the composition of contributions (Models 1 and 2) or whether the rationale was based on projections of pension income (Models 3 and 4)

Output is given as odds ratios.
*p < 0.1; **p < 0.05; ***p < 0.01.
3.2.5 Individual differences
Across the various outcome variables of interest, there were statistically significant effects of background characteristics. Most notably, those with a degree were substantially more likely to propose an increase in contributions (Table 2) and to give one of the two rationales related to the two inferences of interest (Table 3). Any effects associated with having a pension plan were positive but only marginally significant. An OLS regression of the total number of correct recall answers in Stage 1 on format and available background characteristics revealed no significant effects of background characteristics on recall except for marginally better performance among men (β = 0.403, z = 1.69, p < 0.1). A similar analysis of the number of correct comprehension answers in Stage 2 found that participants aged under 35 years produced significantly more correct answers (β = 0.777, z = 3.41, p < 0.01), as did those with a degree (β = 0.499, z = 2.16, p < 0.05) and those who had a pension plan (β = 1.08, z = 4.73, p < 0.001).
3.3. Discussion
The results provide insufficient evidence to support H1 and H2: the two diagrams did not improve recall or comprehension in a systematic way. Participants who saw the contributions diagram were significantly more likely to recall the total contributions from a single reading of the PBS. Participants who saw the INFIL diagram were more likely to correctly determine the impact on projected income of doubling contributions, although this effect was only marginally statistically significant. Overall, however, there was not a consistent, clear advantage associated with the diagrams, with no overall effect on the total of correct answers.
Regarding comprehension of contributions (questions Q2.1 and Q2.2), the low level of correct responses means that it is possible that the comparison between conditions was subject to a floor effect. Participants found these questions harder than anticipated based on piloting; perhaps too hard for variation between the diagram and non-diagram conditions to emerge. However, the two questions used round numbers designed to minimise arithmetic difficulty and centred on the relationships that matter for understanding incentives to contribute. Arguably, therefore, employing easier questions might not have generated any meaningful result even if variation between conditions had been observed. The more pressing concern is how difficult it is to comprehend pension contributions subject to tax relief. Although the description of these two substantial subsidies from the employer and the government was made as simple and clear as the experimenters could manage, the large majority of the experimental sample could not correctly combine the different contributions. Recall that more than half of the sample possessed a primary degree. Some comfort can be taken from the modest correlation between correct responses and confidence, which implies that the difficulty was not compounded by overconfidence.
H3 was supported. The higher the comprehension score in Stage 2, the more likely participants were to propose an increase in contributions. However, this effect became non-significant and approximately halved in magnitude once educational attainment was controlled for (Table 2, Model 4). Thus, it is not clear whether the impact of better comprehension on advice was driven by the better comprehension itself, or whether education to degree level both improves comprehension and boosts the propensity to increase contributions via some other mechanism. H4 was partially supported. Participants who saw the INFIL diagram were more likely to propose an increase in contributions, but there was no equivalent effect for the contributions diagram.
H5 was also strongly supported by the present results. Participants who saw diagrams were more likely to employ arguments associated with those diagrams to explain their decision-making. This effect was largely specific to the diagram concerned: participants who saw the contributions diagram were more likely to cite tax relief or matching contributions as a reason for their advice, while those who saw the INFIL diagram were more likely to cite reasons associated with projected income or investment returns. The suggestion is that the diagrams promoted the causal connections that they were designed to highlight, perhaps resulting in participants viewing the connection as more important, even though they did not improve answers to explicit comprehension questions.
The contributions diagram and tabular costs manipulation both raised to the likelihood that participants gave a rationale for their advice based on projected income or returns. While we cannot be sure of the reason for this, one possibility is that both manipulations reduced the amount of text on the PBS form and, in this sense, amounted to simplifications of the form as a whole. This may have increased the probability that participants located, paid attention to or otherwise placed greater weight on the currently projected pension income, which appeared in two places on the form. With the exception of this (in any case marginal) effect, the comparison between the text and tabular provision of information about costs and fees was not significant. Responses to the relevant comprehension questions indicate that a substantial minority of participants were unable to understand how the balance between costs and returns on the investment determined growth in the overall fund.
The findings that participants displayed better comprehension of the key relationships if they were younger, more educated or already had a pension plan are broadly in line with previous work (Lusardi, Reference Lusardi2008). Having a degree also increased the likelihood of advising an increase in contributions. Naturally it is difficult to infer the direction of the various potential causal relationships, but they do confirm substantial and important individual differences.
4. General discussion
The results of the present study suggest that there may be benefits to the use of explanatory diagrams in a PBS and other communications materials directed at pension scheme members and potential members. The INFIL diagram increased the likelihood of proposing an increase in contributions. While the effect size was quite substantial, generating odds ratios of 1.9–2.6, this needs to be interpreted cautiously in the context of a hypothetical experiment in which participants were invited to advise others. It is important also to understand that the diagrams were not designed as advice on appropriate contribution rates, but were designed to engage the psychological mechanisms involved when considering the adequacy of pension saving and the results suggest differences based on the format of a PBS. Nevertheless, both diagrams arguably supported decision-making, or at least the process of giving coherent advice in relation to a decision, in that they altered the reasons participants gave for their advice. The implication is that the diagrams led participants to pay more attention or otherwise increase the weight given to tax relief and matching contributions, as well as to projected income, such that they were more likely to make inferences on the basis of these factors.
Had these findings been accompanied by a clear and consistent improvement in recall and comprehension, the case that these inferences were good inferences, and hence that the diagrams tested improved decision-making, would be strong. That they did not invites further consideration. Little is known about the exact mechanism through which information interventions promote behaviour change in relation to retirement saving, although there is evidence that they do (Duflo et al., Reference Duflo, Gale, Liebman, Orszag and Saez2006; Goda et al., Reference Goda, Manchester and Sojourner2014; Fuentes et al., Reference Fuentes, Lafortune, Riutort, Tessada and Villatoro2017; Dolls et al., Reference Dolls, Doerrenberg, Peichl and Stichnoth2018). Field trials provide good empirical tests of such interventions, but without explicit tests of what information is retained, what concepts are understood or how interventions alter the weight attributed to different factors that influence a decision. An advantage of the laboratory experiment employed here is that it can give insights into the channels by which interventions may operate. The mixed results of the present study show that testing for whether information interventions promote learning is nuanced. The diagrams we tested appear to have prompted or reinforced a particular type or reasoning without substantive change in attention to, or understanding of, the key information. Our hypotheses that diagrams would improve comprehension of the product and the rationale for decisions that required valuation of the product were both predicated on previous work on explanatory diagrams in educational psychology. They differed with respect to Bloom's taxonomy of learning in relating to ‘comprehension’ or ‘evaluation’ respectively, with the latter considered a higher level of learning. Yet the diagrams influenced the task requiring evaluation with minimal influence on comprehension. The finding hence offers some support for the view that learning outcomes need not follow a strict hierarchy (Case, Reference Case2013).
Our diagrams appear to have reinforced the causal relationships underlying the pension product, that is, the idea that one thing leads to another, without improving understanding of exactly how the causal relationships operate. Thus, the present results suggest that the introduction of such diagrams on the annual PBS may influence decision-making by leading decision-makers to make inferences about factors that they do not necessarily fully comprehend. From one perspective, this might be considered problematic. On the other hand, the evidence supplied here shows that the direction of this influence leads decision-makers, on average, to support increased contributions to retirement saving, moving them into closer alignment with those decisions-makers who have higher educational attainment and score more highly on objective tests of comprehension.
The results of the present study raise concerns about the operation of tax relief and matching contributions as incentives for increasing people's willingness to contribute to their pension. A representative sample of participants, who were incentivised to respond accurately and most of whom had degrees, produced responses to MCQs about how these incentives work that were essentially no better than chance. This was despite the fact that the questions used simple round numbers and the participants had either a printed explanation or a diagram before them that was designed to assist. Moreover, the higher rate of successful responses to other questions, especially the control questions, indicates that participants were trying hard to answer correctly and, in most cases, were able to do so. It is difficult to avoid the conclusion that the composition of pension contributions is too complex for the general population to understand. It is possible that this lack of understanding partly explains why participants who saw the contributions diagram were more likely to cite tax relief or matching contributions as a rationale for their proposed contribution level, yet did not respond to these incentives by advising an increase. Thus, the present study might be considered supporting evidence for efforts to simplify incentives designed to encourage saving for retirement (Duflo et al., Reference Duflo, Gale, Liebman, Orszag and Saez2006; Ramnath, Reference Ramnath2013).
As with all laboratory experiments, some caution is required in generalising and interpreting the results. First, the present study may have underestimated the effect of providing diagrams, because the experimental design excluded the possibility that seeing that the document contained helpful diagrams might have led more people to pay attention to it in the first place. Participants had volunteered for the study and were incentivised to spend 4 min scrutinising the document, regardless of which version they received, and this is what experimenters observed during the sessions. Second, as explained in Section 3, the decisions made during the study were hypothetical. The majority of the experimental sample advised an increase in contributions, including those who did not themselves have a pension plan, echoing a possible disjunction between attitudes and behaviour, or perhaps intention and action. Yet these responses of our participants match survey evidence, which records that most people believe that they should increase their savings for retirement (Bernheim, Reference Bernheim1995; Farkas and Johnson, Reference Farkas and Johnson1997). It is also important to bear in mind that the primary findings consist of variation in responses across conditions, not absolute willingness or ability to act. Third, participants understood that the context for the experiment was to offer advice; they were not told that recall and understanding would be tested. Had they known this, results might have been different, although for the comprehension questions participants had the PBS document available for reference. Lastly, while care was taken to design the diagrams to aid comprehension, it is of course possible that other designs might improve on those tested here, countering specific problems or communicating targeted advice.
The present study focuses on the understanding and decision-making only of individuals and at no stage considers the potential response of providers to the voluntary or mandatory introduction of explanatory diagrams into PBSs. Mandating the presentation of diagrams would impose a regulatory burden that would have to be considered against any estimate of the benefits they might bring. These benefits might be increased, however, if the specific diagrams developed for the present experiment were to be improved upon through experience and testing, perhaps undertaken by pension providers.
The relevance of the present findings arguably extends beyond contribution decisions made by those already in a pension plan. Diagrams may improve communications targeted at the primary decision of whether or not to take out a pension. More broadly, diagrams might be beneficial for communications that try to demystify other financial products and in a range of policy areas where information disclosure is used as a regulatory tool to support individual decision-making. Overall, although the diagrams we tested did not deliver a step-jump in understanding of pensions, the evidence supplied here suggests that there they may generate some benefits for decision-makers. The study also provides further evidence that people's ability to comprehend pensions, as they are currently designed and described, requires attention from both economic researchers and policymakers.
Acknowledgements
This research is supported by the Pensions Authority in Ireland. The authors would like to thank Terry McElvaney and Áine Ní Choisdealbha for their input designing and conducting the study and Deirdre Robertson for her help conducting the qualitative coding of responses. Irish Life kindly provided demographic information on defined contribution pension scheme members. For instructive feedback we thank seminar audiences at the Irish Economics and Psychology Conference and ESRI internal seminars.
Appendix A
See Figures A1–A5 and Tables A1–A3.
Contributions table (top) and diagram (bottom).

Costs table (top) and narrative (bottom).

INFIL table (top) and diagram (bottom).

Example screenshot of Stage 1 question.

Example screenshot of Stage 2 question.

MCQs in Stage 1

MCQs in Stage 2

Questions in Stage 4