Implications
International genetic evaluations for female fertility traits should also include the primary selection target, which includes the milk production traits. Multi-trait analyses, including the selection target traits, correct evaluations for selection on correlated traits. However, increasing the number of traits in multi-trait analyses reach computational limitations, especially in the context of multiple-trait multiple-country genetic evaluations. Under these circumstances, specific trait group combinations should be considered. Analysing female fertility and milk production traits together is interesting, because of the longer history of selection for milk production, the higher heritability for milk production, and the antagonistic relationship between female fertility and milk production.
Introduction
For genetic evaluations to be unbiased in the presence of selection, the data upon which selection decisions have been made should be present in the analysis (Henderson, Reference Henderson1975; Schaeffer et al., Reference Schaeffer, Schenkel and Fries1998; Mrode, Reference Mrode2005). In this situation, BLUP evaluations are properly corrected for selection decisions, leading to evaluations free from selection bias (Henderson, Reference Henderson1975). When there has been non-random selection for a correlated trait rather than the trait of interest, single-trait evaluations may be biased. Multiple-trait evaluations including the correlated trait on which non-random selection has occurred can reduce or eliminate the bias of selection for the trait of interest (Pollak et al., Reference Pollak, van der Werf and Quaas1984; Schaeffer, Reference Schaeffer1984).
Bias in genetic evaluation of female fertility traits via selection on milk production traits has already been addressed (Kadarmideen et al., Reference Kadarmideen, Thompson, Coffey and Kossaibati2003; Sewalem and Kistemaker, Reference Sewalem and Kistemaker2008; Mrode and Coffey, Reference Mrode and Coffey2009; Sun et al., Reference Sun, Madsen, Lund, Zhang, Nielsen and Su2010). The bias for female fertility traits is not just limited to selection on a correlated trait. There are also management and preferential treatment biases in favour of animals with higher genetic merit for milk yield (Kadarmideen et al., Reference Kadarmideen, Thompson, Coffey and Kossaibati2003; Biffani et al., Reference Biffani, Marusi, Biscarini and Canavesi2005). Many of these problems are well described by Kadarmideen et al. (Reference Kadarmideen, Thompson, Coffey and Kossaibati2003).
Genetic evaluation of female fertility traits has been challenging, both nationally and internationally. At the international level, trait definitions, data collection, data editing and management systems are different across countries (Biffani and Canavesi, Reference Biffani and Canavesi2007). Female fertility traits are complex traits; there are several measurements available, each describing a part of the female fertility cycle (Jorjani, Reference Jorjani2006). An interval measurement such as calving interval, which represents an overall performance of female fertility, does not provide any detail about the reason for the problem. Therefore, the best way of addressing these difficulties is to simultaneously analyse different measurements together. Often, female fertility traits have low heritability and consequently low reliability, which reduces the efficiency of its direct selection (de Jong, Reference de Jong2005; Biffani and Canavesi, Reference Biffani and Canavesi2007; Sewalem and Kistemaker, Reference Sewalem and Kistemaker2008; Sun et al., Reference Sun, Madsen, Lund, Zhang, Nielsen and Su2010) and increases the need for more recorded daughters to obtain reliable bull evaluations (Biffani and Canavesi, Reference Biffani and Canavesi2007).
The inclusion of milk yield in the genetic analysis of female fertility traits resulted in increased accuracy and predictive ability of the model for female fertility traits in Great Britain (Mrode and Coffey, Reference Mrode and Coffey2009). Whereas the average reliability of the Dutch fertility index increased from 72% to 73% by the inclusion of body condition score, it increased to 76% by the inclusion of milk yield into the multiple-trait analysis (de Jong, Reference de Jong2005). Adding milk, fat and protein yields together, the reliability increased to 79% (de Jong, Reference de Jong2005). For the Danish Holstein population (Sun et al., Reference Sun, Madsen, Lund, Zhang, Nielsen and Su2010), milk yield and protein yield had similar contributions to the estimating breeding values (EBV) of female fertility, higher than for fat yield. Sun et al. (Reference Sun, Madsen, Lund, Zhang, Nielsen and Su2010) also reported that when a model for female fertility already includes either milk yield or protein yield, adding more production traits gives very little extra improvement to the reliability of female fertility traits.
The aim of this study was to assess the possible effect of across-country selection for milk yield on the estimated international breeding values, reliabilities and genetic trends for female fertility traits.
Material and Methods
Data
Data used in this study were national EBV of bulls from four Holstein populations submitted to Interbull Centre for the test evaluation in May 2009. Milk yield from the United States (USA(MY)), Great Britain (GBR(MY)), Italy (ITA(MY)) and the Netherlands (NLD(MY)), as well as two female fertility traits from GBR (non-return rate at 56 days after calving (GBR(NR)) and calving interval (GBR(CI))), ITA (calving interval (ITA(CI)) and interval from calving to first insemination (ITA(CF))) and NLD (calving interval (NLD(CI)) and interval from calving to first insemination (NLD(CF))) were considered. The reason for choosing GBR, ITA and NLD was that these countries have multiple-trait national genetic evaluations for female fertility traits including milk yield. Because the USA has been the major semen exporting country and driver of genetic changes for Holsteinisation in many countries, milk yield from this country was considered in this study. It is postulated that genetic trends in the other countries and traits may have been driven by selection decisions in the USA, which have been mainly on milk production traits. However, in recent years, selection pressure on milk production has reduced internationally, including in the USA.
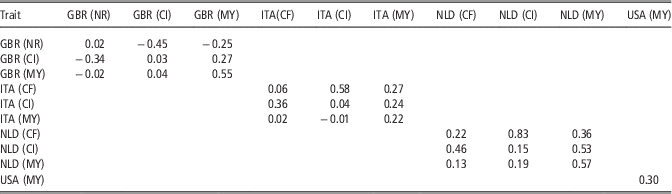
Data were checked according to Interbull standard checks (Jakobsen and Hjerpe, Reference Jakobsen and Hjerpe2006) and edited according to the rules of Interbull Code of Practice (Interbull, 2008). The data edits were the same for all countries by trait combinations. The major edits were considering the cut-off year 1970 for the estimation of genetic correlations, and 1986 for the prediction of genetic merits (no edits for the pedigree data). Bull EBVs based on first crop of daughters in at least 10 herds were considered. Bull EBVs based on at least 150 daughters in at least 50 herds were considered for imported bulls, to avoid bias from preferential treatment. Heritability of USA(MY) was 0.30. Heritabilities (Interbull, 2009) and within-country genetic and residual correlations among the traits from the other countries are shown in Table 1 (GBR (R. Mrode (SAC, Penicuik, Edinburgh, Personal communication)); ITA (F. Canavesi (ANAFI, Via Bergamo, Cremona, personal communication)); NLD (NRS, 2009)) The number of national bull evaluations for bulls born in different years and for different traits, submitted by each country are shown in Supplementary Figure S1.
Country-reported heritabilities (on diagonal), genetic correlations (above diagonal) and residual correlations (lower diagonal)

GBR=Great Britain; ITA=Italy; NLD=the Netherlands; NR=non-return rate (56 days); CI=calving interval; CF=interval from calving to first insemination; MY=milk yield.
Methods
MT-MACE for female fertility (FF3)
A multiple-trait multiple across-country evaluation (MT-MACE) model (as in Sullivan et al., Reference Sullivan, Wilton, Schaeffer, Jansen, Robinson and Allen2005) was used to analyse the data:
 $$Y_{{ij}} =\mu _{{ij}} 1{\plus}Z_{{ij}} Qg_{{ij}} {\plus}Z_{{ij}} s_{{ij}} {\plus}e_{{ij}} $$
where Y ij is the vector of multi-trait de-regressed national EBV, μ ij the vector of country-trait means, g ij the vector of random phantom parent groups, s ij the vector of bulls’ additive genetic effects and e ij the vector of random residuals; all terms are corresponding to country i and trait j. The matrices Z and Q relate bulls to observations and bulls to phantom parent groups, respectively.
The analysis included two fertility traits for GBR, ITA and NLD. Before the analysis, effective dependent weighting factors (hereinafter referred as single-trait EDC) were converted to effective independent weighting factors (hereinafter referred as multi-trait EDC) according to Sullivan and Wilton (Reference Sullivan and Wilton2001). The single-trait EDC values had been estimated including extra information from the correlated traits in the national genetic evaluation model (Fikse and Banos, 2001), see also Interbull, 2004). Multi-trait EDC values divided by the national residual variances were used as elements of the diagonal residual (co)variance matrix (R −1). The procedures for the conversion of single-trait EDC to multi-trait EDC values and the derivation of multi-trait de-regressed national EBV are described and illustrated by Mark and Sullivan (Reference Mark and Sullivan2006) and Nilforooshan et al. (Reference Nilforooshan, Jakobsen, Fikse, Berglund and Jorjani2010). Multi-trait EDC values were used for the de-regression of national EBV to multi-trait de-regressed EBV (dependent variable) and for predicting international EBVs. Both the conversion of single-trait EDC values and the de-regression of national breeding values were performed for each country separately.
ST-MACE for milk yield (MY4)
A single-trait multiple across-country evaluation (ST-MACE) model (Schaeffer, Reference Schaeffer1994), which is currently used by Interbull Centre for international genetic evaluation of dairy sires, was used to analyse the milk yield data from GBR, ITA, NLD and USA. The nationally reported single-trait EDC values were used directly. The de-regression of the national EBV was performed according to Jairath et al. (Reference Jairath, Dekkers, Schaeffer, Liu, Burnside and Kolstad1998).
MT-MACE for female fertility and milk yield (FFMY4 and FFMY3)
A 10-trait MT-MACE analysis was performed including 6 female fertility and 4 milk yield traits (FFMY4). The same procedure as described under ‘MT-MACE for female fertility (FF3)’ was followed. Both the conversion of EDC values and the de-regression of national breeding values were performed separately for each country, modifying the information of each trait for the other two traits. Because the USA was only contributing with milk yield, nationally reported single-trait EDC and single-trait de-regressed national EBV (according to Jairath et al., Reference Jairath, Dekkers, Schaeffer, Liu, Burnside and Kolstad1998) were used directly for USA(MY). In addition, an additional nine-trait analysis was performed, not including the milk yield data from the USA (FFMY3). The analysis was considered to study the role of the USA data in correction for across-country selection bias, and its contribution with additional information to the female fertility traits.
For all the analyses, an EM-REML algorithm was used for the estimation of genetic correlations and sire genetic variances for each trait (Klei and Weigel, Reference Klei and Weigel1998). Afterwards, international genetic merits were predicted and their reliabilities were approximated (Klei, Reference Klei1998).
Statistical comparisons
For statistical comparisons, after performing ST-MACE/MT-MACE analyses, bulls born from 1986 to 2004 were considered. All the comparisons between FF3, FFMY4 and FFMY3 and between MY4 and FFMY4 were based on the bulls in common between the analyses (17 990 bulls for female fertility, and 43 785 bulls for milk yield).
International genetic trends were computed by averaging bull EBV per birth year, for different country by trait combinations and different analyses. Before the study on genetic trends, international EBV of bulls on the scale of each country by trait combination were re-scaled to a mean of 10 and standard deviation of 10, using the following conversion formula:
 $${\rm RBV}_{{ijkl}} =\big( {\big( {{\rm EBV}_{{ijkl}} -\mu _{{ijk}} } \big)\surd\left( {{\rm 1}00/V_{{ijk}} } \right)} \big){\plus}{\rm 1}0$$
where RBV is the re-scaled EBV, EBV ijkl the international EBV of bull l, for analysis k (i.e. FF3/MY4, FFMY3 and FFMY4), country i and trait j; μ ijk and V ijk the corresponding mean and variance.
Reliability changes from FF3/MY4 to FFMY4 were compared for different traits, years and different groups of bulls (i.e. foreign bulls (without daughters in the country of interest), domestic bulls and proven imported bulls) in each country. Rank correlations between international genetic evaluations of FF3/FFMY3/MY4 and FFMY4 were studied for different traits, years, groups of bulls and also the bulls in common between the two sets of Top 100 bulls in each country by trait combination.
The bias in FF3 and FFMY3 relative to FFMY4 were expressed in terms of root mean square deviation (RMSD):
 $${\rm RMSD}_{t} =\surd\left( {\sum\left( {u_{{it}} -\tilde{u}_{{it}} } \right)^{{\rm 2}} /\left( {n{\minus}{\rm 1}} \right)} \right)$$
where u it is the RBV of bull i in the female fertility trait t, predicted either by FF3 or FFMY3, ũ it the RBV of the bull predicted by FFMY4 and n is equal to 17 990.
Results and Discussion
Data summary
The USA had the highest contribution in the submitted data for milk yield (25 508 of 48 113 national EBVs). For female fertility, NLD had the highest contribution (20 753 of 42 218 national EBVs). Compared with ITA and GBR, this contribution was higher for older bulls (Supplementary Figure S1). The sudden drop in the number of bulls from 2003 to 2004 was owing to the incomplete batch of young proven bulls. There were declines in the number of progeny tested bulls, starting from mid-1990s. In addition, the average number of daughters per bull had decreasing trends over time (Supplementary Figure S2).
Genetic correlations
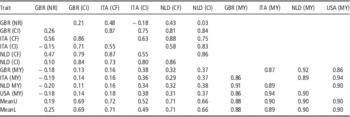
The trait GBR(NR), the only binary trait at the national level, had the lowest (0.19), and ITA(CF) had the highest (0.72) average of estimated genetic correlations with the other female fertility traits (Table 2). Among female fertility traits, NLD(CI) had the highest (0.37) and GBR(CI) had the lowest (0.13) average of absolute genetic correlations with milk yield traits. Among milk yield traits, USA(MY) had the highest (0.27) and ITA(MY) had the lowest (0.25) average of absolute genetic correlations with female fertility traits (Table 2). Genetic correlations between female fertility and milk yield traits were all unfavourable. Although these genetic correlations were low, over the long run, strong selection for milk yield has led to deterioration of female fertility performances in the absence of female fertility traits in selection indices. Genetic correlations among milk yield traits were high (>0.85) and among female fertility traits varied from low to high (−0.18 to 0.88). Compared with FF3, the genetic correlations among female fertility traits changed in FFMY4 in a range of −0.08 to 0.08 (on average 0.002). With FFMY3, the change in genetic correlations was in the same range (on average 0.001). All the genetic correlations among milk yield traits on average reduced by −0.004 (Table 2).
Estimated genetic correlations from two separate analyses of female fertility and milk yield (above diagonal) and a joint analysis of female fertility and milk yield (below diagonal)

GBR=Great Britain; ITA=Italy; NLD=the Netherlands; NR=non-return rate (56 days); CI=calving interval; CF=interval from calving to first insemination; MY=milk yield; FF=female fertility; MeanU=mean of upper diagonal values (FF3 and MY4); MeanL=mean of lower diagonal values (FFMY4), not including the genetic correlations between female fertility traits and milk yield.
The estimated genetic correlations for the traits from the same country (Table 2) were different from the reported values (Table 1). The reasons can be the differences between the national animal model and the international sire model, the sample of animals used in the estimation of genetic correlations, using an international pedigree instead of a national pedigree, the presence of traits from other countries and probably the absence of some traits from the same country in the analysis. However, the most important reason of all was that the internationally estimated within-country genetic correlations were aggregated genetic and residual correlations (Mark and Sullivan, Reference Mark and Sullivan2006; Nilforooshan, Reference Nilforooshan2011), and consequently influencing the genetic correlation matrix fundamentally. For ST-MACE (Schaeffer, Reference Schaeffer1994) to be unbiased, there should be non-zero residual correlations between the traits included in the analysis. The EDC conversion approach of Sullivan and Wilton (Reference Sullivan and Wilton2001) attempts to create new EDC values, by which the estimated genetic correlations will work as if there were non-zero residual correlations. An alternative to the EDC approach of Sullivan and Wilton (Reference Sullivan and Wilton2001) is the EDC approach of Liu et al. (Reference Liu, Reinhardt, Bünger and Reents2004). Calculation of block multi-trait EDC matrices (Liu et al., Reference Liu, Reinhardt, Bünger and Reents2004) requires information that is only available at the national level. However, the approach of Sullivan and Wilton (Reference Sullivan and Wilton2001) can be implemented at the international level without detailed knowledge about distribution of daughters across herds and traits.
Reliabilities
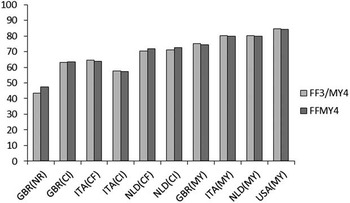
Comparison of reliability values between FF3 and FFMY4 showed slight increases for GBR and NLD. On average, reliabilities did not increase for ITA and milk yield traits (Figure 1). The reason for the latter might be the reduced genetic correlations among milk yield traits for FFMY4, low heritabilities of female fertility traits and their low genetic correlations with milk yield. Previous experiences with national data (e.g. Sun et al., Reference Sun, Madsen, Lund, Zhang, Nielsen and Su2010) have shown that reliabilities do not necessarily increase by adding more traits to the multiple-trait analysis. In another study (de Jong, Reference de Jong2005), by adding more traits one after another to the multiple-trait analysis, the reliability gain owing to the last added trait was less than the reliability gain owing to the previously added trait. Female fertility traits have lower number of observations (Supplementary Figure S1), lower heritability (Table 1) and consequently lower reliability than milk yield. Whereas milk yield is a good indicator trait for female fertility traits, female fertility traits are not good indicators for milk yield. Furthermore, female fertility traits have lower genetic correlations among themselves and with milk yield traits (Table 2). Therefore, adding female fertility traits to milk yield traits in the analysis reduced the genetic correlation among the milk yield traits. Milk yield was also rarely the missing recorded trait to benefit from female fertility. It is assumed that adding female fertility traits to the analysis of milk yield traits has an effect similar to adding traits with lower data quality to the analysis.
Reliabilities of international genetic evaluations of female fertility and milk yield traits separately (FF3/MY4) and together (FFMY4), for the bulls evaluated in FF3/MY4. GBR=Great Britain; ITA=Italy; NLD=the Netherlands; NR=non-return rate (56 days); CI=calving interval; CF=interval from calving to first insemination; MY=milk yield.

The reliability gain from FF3/MY4 to FFMY4 was constant over the years, indicating no considerable difference in the average reliability gain between young and old bulls. This may be explained by the additional number of daughters recorded for milk yield, but not for female fertility traits. This is shown by the almost parallel distributions of the number of daughters for female fertility and milk yield over the years (Supplementary Figure S2).
Compared with domestic and imported bulls, foreign bulls gained more reliability by including milk yield traits to the analysis. Whereas the maximum average reliability gain for foreign bulls was 4.9% for GBR(NR), the maximum reliability gain for domestic bulls was 1.5% for ITA(CI) and the maximum reliability gain for imported bulls was only 0.5% for GBR(CI) (results not shown).
EBVs and ranks
Selection without incorporating the data on which selection decisions have been made in the model can result in re-ranking of bulls because of different intensity of selection in progeny groups (Pollak et al., Reference Pollak, van der Werf and Quaas1984). EBV-based rank correlations over all bulls between MY4 and FFMY4 were close to 1, indicating no important re-ranking. The rank correlations between FF3 and FFMY4 were in a range of 0.967 for GBR(NR) to 0.991 for NLD(CI). For country by trait combinations, which had lower rank correlation between FF3 and FFMY4, there may have been more bias because of selection for milk yield to be corrected. Rank correlations (across years and traits) were lower for the youngest and the oldest bulls (but still >0.93). Rank correlations between FF3 and FFMY4 were almost equal for domestic and imported bulls across the traits (>0.99 for all the traits). This can be owing to the requirement of having many recorded daughters in many herds for imported bulls to be included in international genetic evaluations. Rank correlations were lower for foreign bulls, the lowest (0.96) for foreign bulls in GBR(NR) (results not shown).
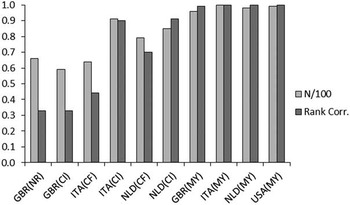
Whereas the Top 100 bulls in common between MY4 and FFMY4 were almost the same group of bulls and their rank correlations were almost 1, the number of bulls in common between Top 100 of FF3 and Top 100 of FFMY4 and their rank correlations were really low (Figure 2). The amount and the direction of changes of EBVs might have been different for different parts of the data, higher for Top 100 bulls. The USA data had no important effect on the list of Top 100 bulls and their ranking for female fertility traits. The number of bulls is common between the Top 100 bulls in the two analyses of FFMY3 and FFMY4 for female fertility traits was 96.0±2.7 with the rank correlation of 0.984±0.015.
Number of bulls in common between the two sets of Top 100 bulls (divided by 100) and their rank correlation between the analyses of female fertility and milk yield traits separately and together. GBR=Great Britain; ITA=Italy; NLD=the Netherlands; NR=non-return rate (56 days); CI=calving interval; CF=interval from calving to first insemination; MY=milk yield.

Additional information on the scale of different country by trait combinations
By the joint evaluation of female fertility and milk yield traits (FFMY4), 26 063 additional international EBV (compared with FF3) were obtained per female fertility trait for the bulls with national EBV for milk yield and without any national EBV for female fertility. In addition, 206 additional international EBV per milk yield trait (compared with MY4) were obtained for the bulls with national EBV for female fertility and without any national EBV for milk yield. Among those 26 063 bulls, 90.5% were American bulls. The trends of reliability for additional female fertility EBV are shown in Supplementary Figure S3. The reliabilities were the highest for NLD(CI) and the lowest for GBR(NR), with lower reliabilities for old bulls.
Genetic trends
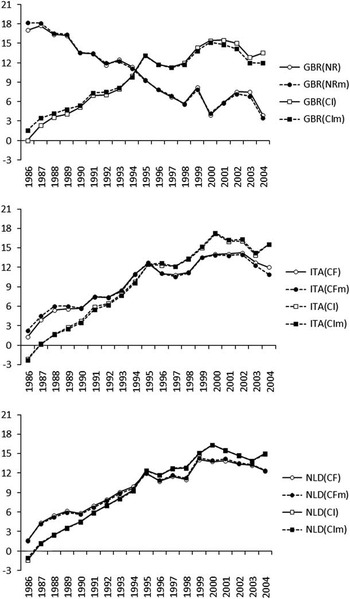
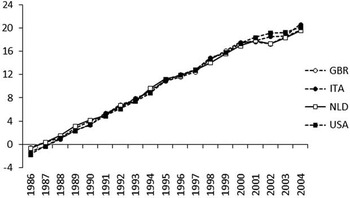
International genetic trends for female fertility traits were all unfavourable (Figure 3). However, genetic improvements could be seen since 2000 for all the countries by trait combinations. The increasing importance of female fertility or associated traits such as longevity in different countries’ breeding programmes in recent years has resulted in improvements in all the studied genetic trends for female fertility traits. These improvements occurred in the presence of large genetic gains for milk yield (Figure 4). This shows that, despite unfavourable genetic correlations between female fertility and milk yield traits, genetic improvements in both is possible. These trends can be different from the national genetic trends, because the data were based on all internationally evaluated bulls (in common between the two international genetic evaluations) rather than the nationally evaluated bulls. Another reason is the difference between the international sire model in this study and the national animal models.
International genetic trends of female fertility traits for different country by trait combinations, analysing female fertility traits with and without milk yield traits. Genetic trends are shown for the bulls with evaluations in the two analyses. Genetic values for all the country by trait combinations are expressed to the mean of 10 and standard deviation of 10). GBR=Great Britain; ITA=Italy; NLD=the Netherlands; NR=non-return rate (56 days); CF=interval from calving to first insemination; CI=calving interval; NRm, CFm and CIm are NR, CF and CI, analysed with milk yield, respectively.

International genetic trends of milk yield traits for different countries, analysing milk yield traits together with female fertility traits. Analysing without female fertility traits, using the same set of bulls that gave the same trends. Genetic values for all countries are expressed to the mean of 10 and standard deviation of 10. GBR=Great Britain; ITA=Italy; NLD=the Netherlands.

Differences in the female fertility genetic trends between FF3 and FFMY4 were small (Figure 3). The maximum change in the slope was −0.11 for GBR(CI). The female fertility genetic trends by FF3 and FFMY3 were even more alike. The two genetic trends by MY4 and FFMY4 were the same for all the countries (Figure 4).
Whereas ST-MACE accounts for ongoing selection in different countries for one trait per country, and MT-MACE accounts for selection for multiple traits per country, these methods in their current formulation do not account for the time trend in selection. This is an important source of bias, which can be prevented by including a country×year interaction in the model. The importance of time trend in international genetic evaluation has been pointed out by Ducrocq et al. (Reference Ducrocq, Delaunay, Boichard and Mattalia2003), which suggested the use of Robust MACE (MACE robust to inconsistencies in national genetic trends). This is an ongoing research and presented elsewhere (Benhajali et al., Reference Benhajali, Jakobsen, Mattalia and Ducrocq2013).
RMSD
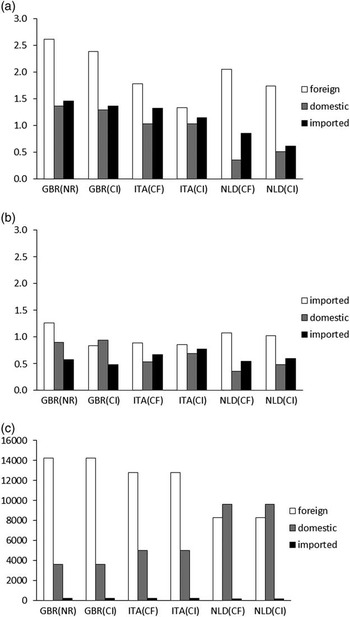
RMSD values were estimated for FF3 and FFMY3 relative to FFMY4. The corresponding values by the groups of bulls are shown in Figures 5a and b, respectively. Female fertility traits from GBR showed a relatively higher bias because of the absence of milk yield traits in the analysis. Moreover, comparing Figures 5a and b shows that the highest amount of bias caused by the absence of the milk yield traits was because of the absence of USA(MY). Considering SD of internationally predicted breeding values equal to 10 for all the traits, the bias was small. For example, the bias in FF3 for GBR(NR) foreign bulls was equivalent to 0.26 s.d. of EBVs. Bias was highest for foreign bulls, and slightly higher for imported bulls compared with domestic bulls. Genetic evaluation of foreign bulls is determined by the evaluations of bulls in the countries in which they have progeny, and therefore more sensitive to across-country selection bias. Whereas the very low rate of RMSD for the low number of imported and domestic bulls (Figure 5c) is not problematic, the relatively higher RMSD values for the huge number of foreign bulls can be an issue.
Root mean square deviations between breeding values from the analyses of female fertility traits without and with milk yield (a), between breeding values from the analyses of female fertility and milk yield, and without and with milk yield from the USA (b), and the corresponding number of bulls in different groups (c). GBR=Great Britain; ITA=Italy; NLD=the Netherlands; NR=non-return rate (56 days); CI=calving interval; CF=interval from calving to first insemination.

Conclusions
In a multi-national perspective, consequences of both within- and across-country selection bias need to be considered. This study tested the across-country selection bias of milk yield for female fertility traits. The bias for the whole evaluated population was small and mainly owing to the lack of milk yield data from the USA. However, it was not equally distributed to the whole data, mainly higher for Top bulls and foreign bulls. The bias had a large impact on re-ranking of the Top 100 bulls. No bias was observed for milk yield traits without female fertility traits included in the analysis. A benefit from the joint international genetic evaluation of female fertility and milk yield traits is that many bulls not evaluated nationally or without a satisfactory national EBV for any female fertility trait would receive international EBV for female fertility traits, if they have milk yield EBV in at least one of the countries included in the analysis. An important future study may focus on whether female fertility trait(s) from the USA also contain information on selection decisions as the milk yield from the USA does. This would highly depend on the overlap (including the information on culled animals) between milk yield and female fertility data from the USA and the accuracy of the female fertility trait(s) compared with milk yield.
Acknowledgements
We appreciate Zengting Liu (VIT, Verden, Germany), Peter Sullivan (CDN, Guelph, Canada) and Tomas Mark (University of Copenhagen, Frederiksberg, Denmark) for their contribution in our technical discussions. In addition, M. A. Nilforooshan greatly acknowledges Swedish Institute (Stockholm, Sweden) for the scholarship award for a part of his PhD studies.