1 Introduction
The generation of zero-net-mass-flux (ZNMF) jets, also called synthetic jets, is based on the phenomenon that an oscillating boundary or transmission of sound can induce a fluid stream. The first to develop a theory on this topic was Rayleigh (Reference Rayleigh1883, Reference Rayleigh1896), who stated that many phenomena involving regular air currents are caused by vibratory motion. Subsequently Eckart (Reference Eckart1948) developed a theory of second-order acoustic effects accounting for the friction that was the main cause of generation of these phenomena. This mathematical theory allowed the calculation of the steady flow produced by a sound beam of circular cross-section. Following the theory of streaming caused by sound waves of Eckart (Reference Eckart1948), a ZNMF jet flow was first observed by Ingard & Labate (Reference Ingard and Labate1950). They studied the acoustical streaming phenomena around the orifice using smoke particles as fluid tracers. Their study employed orifice diameters ranging from 3.5 mm to 20 mm and velocities up to
 $7~\text{m}~\text{s}^{-1}$
. Acoustic waves were used to form the sinusoidal motion, which was visualized using stroboscopic illumination. Later Medinkow & Novitskii (Reference Medinkow and Novitskii1975) used an acoustically driven conical tube to produce an air jet. Using a low-frequency oscillating plane (10–100 Hz), they observed average streaming velocities up to
 $17~\text{m}~\text{s}^{-1}$
. Later Lighthill (Reference Lighthill1978) investigated how turbulent jets could be generated by sound and suggested two methods for generating those fluid streams. The first is based on the transmission of pressure waves through a compressible medium, while the second is related to viscous effects at a boundary. Lebedeva (Reference Lebedeva1980) obtained a jet with a velocity of up to
 $10~\text{m}~\text{s}^{-1}$
by using a high-amplitude sound wave, with frequencies ranging from 500 to 1600 Hz passing through an orifice of 0.75 cm diameter located at the end of the tube. Eventually, Coe et al. (Reference Coe, Allen, Trautman and Glezer1994) proposed for the first time an innovative device called the ZNMF jet actuator. According to Coe et al. (Reference Coe, Allen, Trautman and Glezer1994, Reference Coe, Allen, Trautman and Glezer1995), a ZNMF jet consists of a fixed actuator cavity bound on one side by an oscillating membrane and on the other by an orifice. During the membrane oscillation, air is drawn into the cavity through the orifice and then ejected out of the cavity through the same orifice, forming a series of vortex rings, which propagate away from the orifice plate under their self-induced velocity. The main feature of these jets is that they allow momentum transfer into the surrounding fluid without net mass injection into the overall system, eliminating the need for input piping. Later Holmann et al. (Reference Holmann, Utturkar, Mittal, Smith and Cattafesta2005) found that the series of vortex rings can convect downstream only when a formation criterion is satisfied. This formation criterion is related to the parameters that characterize the ZNMF jet behaviour, which are the Reynolds number and the Strouhal number defined as
 $$\begin{eqnarray}Re=\frac{U_{0}D_{0}}{\unicode[STIX]{x1D708}},\end{eqnarray}$$
 $$\begin{eqnarray}St=\frac{\,fD_{0}}{U_{0}}=\frac{D_{0}}{L_{0}},\end{eqnarray}$$
where
 $U_{0}$
is a characteristic velocity scale,
 $D_{0}$
is the orifice diameter,
 $\unicode[STIX]{x1D708}$
is the fluid kinematic viscosity,
 $f$
is the actuation frequency and
 $L_{0}$
is the stroke length, defined as
 $U_{0}/f$
. In the ZNMF jet literature there are a number of definitions of the velocity characterizing the phenomenon (Kral et al.
Reference Kral, Donovan, Cain and Cary1997; Smith & Glezer Reference Smith and Glezer1998; Mallinson, Hong & Reizes Reference Mallinson, Hong and Reizes1999; Cater & Soria Reference Cater and Soria2002). The one used in this study is that defined by Cater & Soria (Reference Cater and Soria2002):
 $$\begin{eqnarray}U_{0}=\sqrt{\frac{4}{\unicode[STIX]{x03C0}D_{0}^{2}\unicode[STIX]{x1D70F}}\int _{0}^{\unicode[STIX]{x1D70F}}\int _{0}^{D_{0}/2}2\unicode[STIX]{x03C0}ru_{0}(r,t)u_{0}(r,t)\,\text{d}r\,\text{d}t},\end{eqnarray}$$
where
 $\unicode[STIX]{x1D70F}$
is the actuation period and
 $u_{0}$
is the velocity at the exit plane of the orifice. This characteristic velocity is related to the mean momentum flow through the orifice (Soria Reference Soria, New and Yu2015).
ZNMF jet behaviour has been widely studied both experimentally (Smith & Glezer Reference Smith and Glezer1998; Cater & Soria Reference Cater and Soria2002; Shuster & Smith Reference Shuster and Smith2007) and numerically (Rizzetta, Visbal & Stanek Reference Rizzetta, Visbal and Stanek1999; Persoons Reference Persoons2012; de Luca, Girfoglio & Coppola Reference de Luca, Girfoglio and Coppola2014). Their characteristics make them fit for several fields of application such as: flow control (Tuck & Soria Reference Tuck and Soria1995; Buchmann, Atkinson & Soria Reference Buchmann, Atkinson and Soria2013), heat transfer (Valiorgue et al. Reference Valiorgue, Persoons, McGuinn and Murray2009; Chaudhari, Puranik & Agrawal Reference Chaudhari, Puranik and Agrawal2010; Greco, Ianiro & Cardone Reference Greco, Ianiro and Cardone2014); enhancement of mixing between fluid currents (Wang & Menon Reference Wang and Menon2001); and generation of microthrust for propulsion (Müller et al. Reference Müller, Bernal, Moran, Washabaugh, Parviz, Zhang, Allen Chou and Najafi2000).
James, Jacobs & Glezer (Reference James, Jacobs and Glezer1996) experimentally investigated a round turbulent submerged water jet produced by a resonantly driven diaphragm mounted flush with a wall. The ZNMF jet is generated only for high amplitudes of oscillation due to cavitation bubbles which formed on the diaphragm surface. Hence the jet formation in this case is due to the motion caused by the periodic formation and collapse of bubbles. The jet shows a spreading which is lower than that of conventional jets at a similar source Reynolds number. A similar result was found also by Smith & Glezer (Reference Smith and Glezer1998). They studied the main properties of slot (two-dimensional) ZNMF jets, comparing them to conventional two-dimensional jets. They found that the increase of the width of ZNMF jets and the volume flow rate are lower than those of continuous jets. Furthermore, they found that the streamwise decrease of the jet centreline velocity, for ZNMF jets, is lower than that of the continuous jets. In contrast, Cater & Soria (Reference Cater and Soria2002) investigated experimentally a round ZNMF jet, observing that in the far field it has a cross-stream velocity distribution similar to that of a conventional continuous jet but with a larger spreading rate. They also characterized the near field of a ZNMF jet as a function of the Strouhal number and the Reynolds number, defining four different flow field behaviours: laminar jets, laminar rings, transitional jets and turbulent jets.
Glezer & Amitay (Reference Glezer and Amitay2002) presented a review on most of the studies carried out on ZNMF jets. They described the ZNMF jet formation and characterized the ZNMF jet flow field (composed by the near and far fields). They found that the near field deeply depends on the interaction between the formation and advection of the train of vortices and the suction phase. They also observed that during this suction phase the flow field is characterized by a stagnation (saddle) point on the centreline. This saddle point, located between the recent vortex and the exit plate, moves along the centreline. In the far field they found that cross-stream distributions of the time-averaged streamwise and cross-stream velocity components and the corresponding mean-squared velocity fluctuations collapse in the usual similarity coordinates. They found that the streamwise scaling of other variables such as centreline velocity, jet width and volume flow rate do not match corresponding scaling for conventional jets.
The comparison between the ZNMF and continuous jets was also presented by Smith & Swift (Reference Smith and Swift2003). They compare ZNMF jets to continuous jets at the same Reynolds number, showing that, in the far field, they have the same velocity shape, as also found in Cater & Soria (Reference Cater and Soria2002) and Glezer & Amitay (Reference Glezer and Amitay2002). They also observed that, in the near field, ZNMF jets are dominated by vortex pairs that entrain more fluid than continuous ones, generating a more rapid growth in terms of both jet width and volume flow rate. These latter findings are different from those obtained by Smith & Glezer (Reference Smith and Glezer1998) because of the different operating conditions (see table 1).
A theoretical attempt to derive the governing equations and scaling relationships of a ZNMF jet flow field was carried out by Agrawal & Verma (Reference Agrawal and Verma2008). Their similarity analysis provides the streamwise variation of centreline velocity and jet width, which are in agreement with several experimental works (James et al. Reference James, Jacobs and Glezer1996; Mallinson et al. Reference Mallinson, Hong and Reizes1999; Cater & Soria Reference Cater and Soria2002; Smith & Swift Reference Smith and Swift2003). They also compare the ZNMF jet scaling relationships with those of continuous jets, stating that the most important difference between these jets is the larger spreading rate of ZNMF jets.
In contrast with these previous works, Shuster & Smith (Reference Shuster and Smith2007) focused only on the behaviour of ZNMF jets. They demonstrated that the round ZNMF jet is uniquely identified by the dimensionless stroke length
 $L_{0}/D_{0}$
and showed that for a distance from the nozzle lower than
 $L_{0}$
the flow is dominated by the vortex ring formed at the nozzle exit, while only downstream of one stroke length is there a transition to a nominally steady turbulent jet. They found that, for values of the stroke length varying between 1 and 3 and Reynolds number ranging between 1000 and 10 000, the dimensionless distribution of the mean jet centreline velocity and the jet width is the same. They also noticed that the vortex ring behaviour depends only on the stroke length, showing that its streamwise convection is a linear function of this parameter.
The effect of varying stroke length on the flow morphology of ZNMF jets was studied by McGuinn et al. (Reference McGuinn, Farrelly, Persoons and Murray2013) with high-speed particle image velocimetry (PIV) and hot-wire anemometry. According to Gharib, Rambod & Shariff (Reference Gharib, Rambod and Shariff1998), the power of a vortex ring is enhanced with increasing stroke length up to
 $L_{0}/D_{0}=4$
. For higher
 $L_{0}/D_{0}$
a trailing jet is formed which adversely affects the stability of the primary vortex. Analogously, ZNMF jets without impingement (McGuinn et al.
Reference McGuinn, Farrelly, Persoons and Murray2013) are characterized by a monotonic increase in vortex strength up to
 $L_{0}/D_{0}=8$
. For
 $L_{0}/D_{0}$
between 4 and 8, the flow field is characterized by additional fluid ejection after the formation of the vortex ring and its widening. This additional fluid ejection is the so-called trailing jet. A maximum ejection velocity occurs in the trailing jet and destabilizes the vortex ring, promoting mixing for
 $L_{0}/D_{0}$
between 8 and 16. For higher
 $L_{0}/D_{0}$
the most relevant flow feature is represented by the trailing jet, which overtakes the vortex ring, resulting in a highly turbulent intermittent jet flow.
These studies have increased the knowledge of the flow structure of free ZNMF jets and they have highlighted the differences with continuous ones. This has led researchers to attempt to replace continuous jets with ZNMF jets in several applications such as, for example, heat transfer.
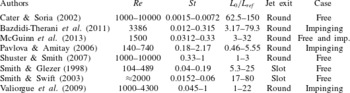
There is a large number of studies describing and evaluating the heat transfer capabilities of ZNMF jets (Gutmark, Yassour & Wolfshtein Reference Gutmark, Yassour, Wolfshtein, Grigull, Hahne, Stephan and Straub1982; Mahalingam & Glezer Reference Mahalingam and Glezer2005; Valiorgue et al. Reference Valiorgue, Persoons, McGuinn and Murray2009; Chaudhari et al. Reference Chaudhari, Puranik and Agrawal2010; Persoons, McGuinn & Murray Reference Persoons, McGuinn and Murray2011; Greco et al. Reference Greco, Ianiro and Cardone2014). Nevertheless, the knowledge about the impinging flow field of ZNMF jets is currently insufficient (Persoons et al. Reference Persoons, McGuinn and Murray2011) compared to their free flow field counterpart. This was also realized by Bazdidi-Therani, Karami & Jahromi (Reference Bazdidi-Therani, Karami and Jahromi2011), who highlighted the necessity of further experimental and numerical investigations on the impinging synthetic jet flow field. In fact, according to these authors, the literature on the characterization of the impinging flow field of such jets is rather limited and incomplete. The few studies that partially analyse the ZNMF jet impinging flow field (Pavlova & Amitay Reference Pavlova and Amitay2006; Valiorgue et al. Reference Valiorgue, Persoons, McGuinn and Murray2009; Bazdidi-Therani et al. Reference Bazdidi-Therani, Karami and Jahromi2011; McGuinn et al. Reference McGuinn, Farrelly, Persoons and Murray2013) mainly focus on their heat transfer behaviour. Their operating conditions and those related to the studies concerning the free configurations are summarized in table 1.
Overview of operating conditions of free and impinging ZNMF jet flow fields. Here
 $L_{ref}$
is the orifice diameter
 $D_{0}$
or the slot width
 $h$
. All these works are based on the reference velocity
 $U_{0}$
defined by Smith & Glezer (Reference Smith and Glezer1998); the reference velocity defined and used in Cater & Soria (Reference Cater and Soria2002) is
 $\unicode[STIX]{x03C0}/\sqrt{2}$
of that reported in Smith & Glezer (Reference Smith and Glezer1998) assuming a uniform exit velocity profile.

Pavlova & Amitay (Reference Pavlova and Amitay2006) experimentally studied the influence of Reynolds number (
 $140\leqslant Re\leqslant 740$
), orifice-to-plate distance (
 $1.9\leqslant H/D_{0}\leqslant 38.1$
) and formation frequency (equal to 420 and 1200 Hz) on the heat transfer rate of an impinging ZNMF jet. They found that, at low operating frequency, a vortex ring impinges individually, while, at high operating frequency, vortex rings merge and break into smaller secondary structures. For this reason, the axial turbulent velocity shows only a peak near the impingement plate at low frequency, while, at high frequency, it attains high values along the shear layers of the vortex ring.
Valiorgue et al. (Reference Valiorgue, Persoons, McGuinn and Murray2009) studied ZNMF jets impinging at a nozzle-to-plate distance equal to
 $2D_{0}$
, for various stroke lengths (
 $1\leqslant L_{0}/D_{0}\leqslant 22$
) and Reynolds number (between 1000 and 4300). They characterize the impinging vortex dynamics and the vorticity field, and they also stated that the flow structure is independent of the Reynolds number for a fixed stroke length, as also described by Shuster & Smith (Reference Shuster and Smith2007) for a free ZNMF jet.
Bazdidi-Therani et al. (Reference Bazdidi-Therani, Karami and Jahromi2011) analysed the influence of orifice-to-plate distance (ranging between 2 and 8) and frequency (equal to 16, 80 and 400 Hz) on the heat transfer and flow field of an impinging ZNMF jet at Reynolds number equal to 3386 with a turbulence intensity of 10 %. They found a recirculation region at
 $H/D_{0}$
equal to 2 and 4, which stops the countercurrent flow field inhibiting fresh incoming air. This region disappears for higher nozzle-to-plate distances and decreases as the frequency increases.
McGuinn et al. (Reference McGuinn, Farrelly, Persoons and Murray2013) also accounted for the presence of the plate with the non-dimensional parameter
 $(L_{0}-L_{0}^{(f)})/H$
, as previously done by Persoons et al. (Reference Persoons, McGuinn and Murray2011). In the study by McGuinn et al. (Reference McGuinn, Farrelly, Persoons and Murray2013) the ZNMF jet formation stroke length (
 $L_{0}^{(f)}$
) was considered constant and equal to
 $2D_{0}$
,
 $H/D_{0}$
varied between 2 and 16,
 $L_{0}/D_{0}$
between 3 and 32 and Reynolds number was equal to 1500. The first regime is for
 $(L_{0}-L_{0}^{(f)})/H<0.5$
, which corresponds to a stroke length slightly higher than the formation one; as a consequence, the momentum of the jet reaching the surface is very weak while the maximum stagnation velocity is reached in the second regime characterized by
 $0.5<(L_{0}-L_{0}^{(f)})/H\leqslant 1$
. Further increase of the stroke length promotes radial spreading of the jet, causing a reduction in time-average velocity approaching the impingement region point for
 $1<(L_{0}-L_{0}^{(f)})/H\leqslant 2$
while for
 $(L_{0}-L_{0}^{(f)})/H>2$
the flow field is dominated by the trailing jet.
The aim of this paper is to investigate and explain the behaviour of the impinging ZNMF jet flow field and to give detailed insight into the mean flow quantities and turbulent statistics as a function of the Strouhal number (0.011, 0.022 and 0.044) and orifice-to-plate distance (2, 4 and 6). In particular, the lack of knowledge about this topic makes it necessary to begin the analysis with the time-average behaviour of the ZNMF jet flow field. The time-average investigation allows the characterizing of the entire flow field far from and near to the impingement plate. Then a phase-average analysis is performed in order to study the evolution of the ZNMF jet. These fundamental investigations provide the basic knowledge about the phenomenon and also allow further analyses to be performed that characterize the impinging ZNMF jet flow field such as: vortex ring dynamics, vortex ring vorticity, entrainment rate and saddle point behaviour. In contrast to previous experimental and numerical works in the literature, this paper explains and discusses the entire fluid dynamic phenomenon, providing several fundamental characteristics of the flow field behaviour.
2 Experimental set-up
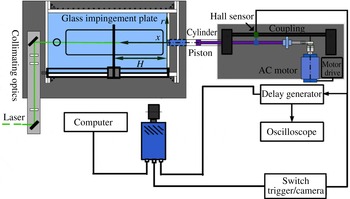
Experiments are undertaken in the water tank (figure 1) previously used by Cater & Soria (Reference Cater and Soria2002), whose dimensions are: 1000 mm long, 500 mm wide and 500 mm deep. It is filled with filtered water through the Perspex roof. In each experiment ZNMF jets are generated by using a reciprocating piston within a cylinder, which discharges water from a circular cylinder with inner diameter
 $D_{p}=50~\text{mm}$
through an orifice plate of diameter
 $D_{0}=10~\text{mm}$
and thickness of 2 mm, positioned in the centre of the tank wall at the exit of the jet. The piston is connected to an AC motor through a flexible coupling and an eccentric plate. The speed of the AC motor is controlled through a precision motor drive. The desired ZNMF jet, for known Reynolds number and Strouhal number, is obtained by setting the half piston stroke
 $l_{p}$
(equal to 2, 4 and 8 mm) and the piston/actuation frequency
 $f$
(equal to 4, 8 and 16 Hz). A summary of the parameters of the ZNMF jet is given in table 2. The mean position of the piston during the generation of ZNMF jet flows was maintained at
 $12D_{0}$
from the external face of the orifice plate within the cavity. A linear bearing that supports the impingement plate is rigidly mounted on the top of the jet facility. The distance
 $(H)$
between the orifice plate and the impingement plate can be continuously adjusted.
Experimental set-up.

The water in the tank is seeded with hollow glass spheres (Potter spherical) with a density of
 $1100~\text{kg}~\text{m}^{-3}$
and a nominal diameter of
 $11~\unicode[STIX]{x03BC}\text{m}$
having an estimated relaxation time of
 $7.39~\unicode[STIX]{x03BC}\text{s}$
, which thus are expected to follow the fluid motion faithfully. Prior to the experiments the seeding particles are prepared following the process described in Soria & Parker (Reference Soria and Parker2005). Prior to each experiment, a pump is used to homogenize the water and particles inside the tank to yield high seeding uniformity.
Experimental operating conditions.

In the PIV image acquisition the particles are illuminated by a high-speed Quantronix Nd:YLF twin-cavity pulsed laser system capable of supplying
 $30~\text{mJ}~\text{pulse}^{-1}$
at a wavelength of 527 nm. The thickness of the laser sheet is adjusted to 1 mm and the laser sheet is aligned vertically including the jet axis by using the necessary optical lenses and mirrors. The time difference between two laser pulses is
 $40~\unicode[STIX]{x03BC}\text{s}$
. The scattered light from the particles is recorded using a PCO-DIMAX high-speed camera with a CMOS array size of
 $2016\times 2016$
pixels. A 100 mm Zeiss lens is mounted on the camera and an
 $f$
-stop number of 2 was used. The camera acquires at its maximum acquisition rate of 624 Hz in a double-frame configuration and the field of view is approximately
 $6.3D_{0}\times 6.3D_{0}$
. The resulting resolution for the digital images is
 $31.33~\unicode[STIX]{x03BC}\text{m}~\text{pixel}^{-1}$
in the illumination plane. Both camera and laser are synchronized using a delay generator (DG645), which is triggered by a Hall sensor that detects the farthest reciprocating piston position during its oscillation. Further details of the experimental operating conditions, such as the number of phases
 $N_{ph}$
acquired in one period, the dimensionless time
 $\unicode[STIX]{x0394}t_{ph}/\unicode[STIX]{x1D70F}$
between two subsequent phases and the number
 $N$
of images acquired for each phase, for all the Strouhal number cases, are given in table 2.
3 Experimental technique
3.1 Multigrid/multipass cross-correlation PIV measurements
The raw image data are preprocessed prior to multigrid/multipass cross-correlation PIV analysis. Images are cropped to minimize the laser scattering from solid walls such as the orifice plate and impingement plate. Temporal minimum image subtraction is then applied in order to remove any remaining reflection caused by the orifice plate and the impingement plate. The vector field is obtained by processing images with a multigrid/multipass cross-correlation digital particle image velocimetry (MCCDPIV) analysis, which is described in Soria (Reference Soria, Masri and Honnery1996a
,Reference Soria
b
, Reference Soria, Thomson and Hourigan1998) and Soria, Cater & Kostas (Reference Soria, Cater and Kostas1999). The accuracy and uncertainty associated with multigrid/multipass cross-correlation PIV measurements are reported and discussed in Soria (Reference Soria1996b
, Reference Soria, Thomson and Hourigan1998). The MCCDPIV algorithm uses the local cross-correlation function multiplication method introduced by Hart (Reference Hart2000) to improve the detection of the location of the cross-correlation function maximum. The uncertainty relative to the maximum velocity components at the 95 % confidence level for these measurements is 1.1 % (Soria Reference Soria1996b
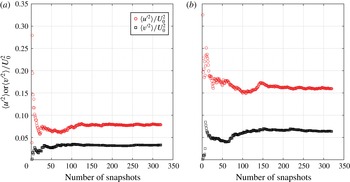
). For the first pass, the size of the interrogation window is 64 pixels, while for the second pass 32 pixel windows are used. The sample spacing between the centres of the interrogation windows is 16 pixels (50 % of overlap). The vector fields are validated using a standard local median filter as described in Westerweel (Reference Westerweel1994), resulting in less than 0.5 % of rejected vectors on average. The uncertainty of velocity phase averages as a function of size of the sample space has been investigated and some of the results are shown in figure 2 for a fixed phase at
 $St=0.011$
and
 $H/D_{0}=2$
at two locations: one point is located in the shear layer, while the other is located in the vortex ring core. These results show that the uncertainty, as demonstrated by the level of variation of the phase average of the velocity, is small (less than 1 %) when the size of the sample space is larger than 250.
Statistical convergence of phase-average axial and radial dimensionless fluctuations at
 $St=0.011$
and
 $H/D_{0}=2$
in the shear layer (
 $a$
) and vortex ring core (
 $b$
).

3.2 Triple decomposition analysis
The instantaneous velocity data, obtained through the MCCDPIV algorithm, is analysed using triple decomposition (Hussain & Reynolds Reference Hussain and Reynolds1970; Kitsios et al. Reference Kitsios, Cordier, Bonnet, Ooi and Soria2010; Soria Reference Soria, New and Yu2015):
 $$\begin{eqnarray}u_{i}(\boldsymbol{x},t)=U_{i}(\boldsymbol{x})+\tilde{u} _{i}(\boldsymbol{x},t)+u_{i}^{\prime }(\boldsymbol{x},t),\end{eqnarray}$$
where
 $u_{1}=u$
,
 $u_{2}=v$
,
 $u_{3}=w$
,
 $\boldsymbol{x}=(x,r,\unicode[STIX]{x1D703})$
,
 $U_{i}$
is the time-average velocity,
 $\tilde{u} _{i}$
is the phase-correlated organized contribution to the velocity and
 $u_{i}^{\prime }$
is the turbulent velocity fluctuation. The time-average velocity is defined as
 $$\begin{eqnarray}U_{i}(\boldsymbol{x})=\lim _{T\rightarrow \infty }\frac{1}{T}\int _{0}^{T}u_{i}(\boldsymbol{x},t)\,\text{d}t,\end{eqnarray}$$
while the phase-average velocity is
 $$\begin{eqnarray}\langle u_{i}(\boldsymbol{x},t)\rangle =\lim _{N\rightarrow \infty }\frac{1}{N}\mathop{\sum }_{n=0}^{N-1}u_{i}(\boldsymbol{x},t+n\unicode[STIX]{x1D70F}),\end{eqnarray}$$
where
 $N$
is the number of snapshots of the flow fields at the same phase,
 $\unicode[STIX]{x1D70F}$
is the period of the organized contribution, whose reciprocal coincides with the actuation frequency
 $f$
, and
 $n$
is a natural number. Hence the phase-average velocity is the average in any spatial point for a fixed phase
 $t/\unicode[STIX]{x1D70F}$
in the ZNMF jet generation cycle. The phase-correlated organized contribution to the velocity is thus defined as
 $$\begin{eqnarray}\tilde{u} _{i}(\boldsymbol{x},t)=\langle u_{i}(\boldsymbol{x},t)\rangle -U_{i}(\boldsymbol{x}),\end{eqnarray}$$
while the turbulent velocity fluctuation is
 $$\begin{eqnarray}u_{i}^{\prime }(\boldsymbol{x},t)=u_{i}(\boldsymbol{x},t)-\langle u_{i}(\boldsymbol{x},t)\rangle .\end{eqnarray}$$
In the time-average behaviour of the impinging ZNMF jet flow field, the kinetic energy is due to three contributions: the mean kinetic energy (
 $\propto \sum _{i=1}^{2}U_{i}^{2}$
), the turbulent kinetic energy (
 $TKE$
) and the phase-correlated kinetic energy (
 $PKE$
). The second one is related to the turbulence and is defined as usual as
 $$\begin{eqnarray}TKE(\boldsymbol{x})=\mathop{\sum }_{i=1}^{2}\left[\lim _{T\rightarrow \infty }\frac{1}{T}\int _{0}^{T}u_{i}^{\prime 2}(\boldsymbol{x},t)\,\text{d}t\right],\end{eqnarray}$$
while the third one is the kinetic energy generated by the periodic external force, perturbing the flow field, and is defined as
 $$\begin{eqnarray}PKE(\boldsymbol{x})=\mathop{\sum }_{i=1}^{2}\left[\lim _{T\rightarrow \infty }\frac{1}{T}\int _{0}^{T}\tilde{u} _{i}^{2}(\boldsymbol{x},t)\,\text{d}t\right].\end{eqnarray}$$
Both
 $TKE$
and
 $PKE$
are calculated by using only the measured velocity components, i.e. the axial and radial ones.
3.3 Vorticity, flow rate and entrainment
The azimuthal vorticity (
 $\unicode[STIX]{x1D714}_{\unicode[STIX]{x1D703}}$
) is defined as
 $$\begin{eqnarray}\unicode[STIX]{x1D714}_{\unicode[STIX]{x1D703}}=\frac{\unicode[STIX]{x2202}u}{\unicode[STIX]{x2202}r}-\frac{\unicode[STIX]{x2202}v}{\unicode[STIX]{x2202}x}.\end{eqnarray}$$
It is calculated by using the PIV velocity field measurements through a local least-squares fitting procedure to the velocity field, as introduced in Soria (Reference Soria1996b
) and used in Cater & Soria (Reference Cater and Soria2002). A 13-point, two-dimensional, local fit to the velocity field data is used in the present analysis. This vorticity calculation method introduces a bias and a random error (Fouras & Soria Reference Fouras and Soria1998) into the vorticity field as discussed in Cater & Soria (Reference Cater and Soria2002). For a vorticity field with a characteristic length of
 $D_{0}$
, the bias and random error are estimated to be
 $-0.16\,\%$
and 7.5 % respectively.
The flow rate (
 $Q$
) and the entrainment (
 $\unicode[STIX]{x1D716}$
) are two important parameters of jets. In this kind of jet (i.e. ZNMF jets), where the net mass flux is zero at the orifice, the flow rate and the entrainment are useful to understand the quantity of fresh ambient air engulfed by the ZNMF jet itself. The flow rate is defined as
 $$\begin{eqnarray}Q(x)=2\unicode[STIX]{x03C0}\int _{0}^{\infty }U(x,r)r\,\text{d}r,\end{eqnarray}$$
while the entrainment is defined as the axial derivative of the flow rate
 $$\begin{eqnarray}\unicode[STIX]{x1D716}(x)=\frac{\text{d}Q(x)}{\text{d}x}=\frac{\text{d}}{\text{d}x}\left[2\unicode[STIX]{x03C0}\int _{0}^{\infty }U(x,r)r\,\text{d}r\right].\end{eqnarray}$$
4 Results
4.1 Time-average measurements
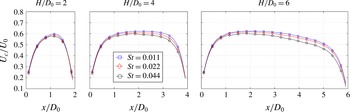
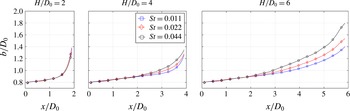
In figures 3 and 4 the time-average centreline axial velocity and the jet width, with the latter defined as the crosswise distance between two positions characterized by
 $U/U_{c}=0.5$
(Smith & Glezer Reference Smith and Glezer1998), for all the orifice-to-plate distances and the Strouhal numbers are shown. The centreline axial velocity
 $U_{c}$
(figure 3) attains higher values as the Strouhal number decreases, which differs from the jet width behaviour (figure 4). Indeed, at high Strouhal numbers, the ZNMF jet flow field is similar to a vortex ring convecting downstream, while, in contrast, at low Strouhal numbers its structure is more like a continuous jet. For this reason the flow field of a ZNMF jet at high Strouhal number is inherently influenced by the vortex ring. This vortex ring tends to spread the jet, increasing the jet width, and its convective velocity scales with the inverse of the Strouhal number (Shuster & Smith Reference Shuster and Smith2007), causing the centreline axial velocity to decrease.
Near the orifice exit,
 $U_{c}$
tends to zero as expected by the fact that these jets are zero-net-mass-flux in nature. At the same position (i.e. near the orifice exit) the jet width is lower than 1 and equal to 0.8 because of the recirculation flow and the vena contracta phenomenon that develops along the orifice edge. These phenomena occur when the ratio between the plate thickness and the orifice diameter is lower than 0.75 (Gomes, Crowther & Wood Reference Gomes, Crowther and Wood2006): this ratio is 0.2 in our experiments. In both figures 3 and 4 it is observed that the impingement plate affects the flow field up to one diameter upstream, and, as these graphs indicate, the slope changes at approximately one diameter upstream of the impingement plate.
Time-average centreline axial velocity for all Strouhal numbers and
 $H/D_{0}$
configurations at
 $Re=35\,000$
.

Jet width for all Strouhal numbers and
 $H/D_{0}$
configurations at
 $Re=35\,000$
.

Time-average centreline turbulent kinetic energy for all Strouhal numbers and
 $H/D_{0}$
configurations at
 $Re=35\,000$
.

Time-average centreline phase-correlated kinetic energy for all Strouhal numbers and
 $H/D_{0}$
configurations at
 $Re=35\,000$
.

In figures 5 and 6 the
 $TKE$
and
 $PKE$
centreline profiles are shown for each orifice-to-plate distance. The value of
 $TKE$
along the centreline (i.e.
 $TKE_{c}$
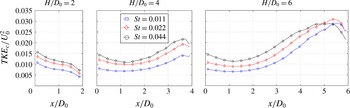
) is shown to increase with the Strouhal number for all configurations. This is due to the presence of the trailing jet, which becomes predominant as the Strouhal number decreases. This trailing jet has the same features of a continuous jet, hence it is characterized by a potential core-like region confined by a highly turbulent shear layer (as will be shown in the phase-average measurements subsection). This potential core-like region is the cause of the decrease of the
 $TKE_{c}$
as the Strouhal number decreases. For the
 $H/D_{0}=6$
case, the extent of the region characterized by
 $TKE_{c}\leqslant 0.02$
increases as the Strouhal number decreases. This extent is
 $3.2D_{0}$
,
 $3.6D_{0}$
and
 $4.2D_{0}$
as the Strouhal number decreases. These axial positions can be considered as the starting point where the shear layer begins to merge. At
 $x/D_{0}\geqslant 4.5$
, the
 $TKE_{c}$
at the highest Strouhal number shows a plateau and then starts to decrease before the others. The location of this plateau corresponds to the axial region where the shear layer is completely merged on the jet axis. Instead, the other two cases show a peak that is closer to the impingement plate. In contrast to the highest Strouhal number case, these peaks are not the starting point of the plateau region because they are mainly induced by the presence of the impingement plate itself and not by the shear layer merging. Hence the plateau of
 $TKE$
for these configurations (i.e.
 $St=0.011$
and
 $St=0.022$
) is expected to be at longer axial location and to move farther from the orifice exit as the Strouhal number decreases.
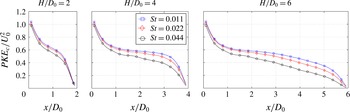
The
 $PKE$
represents the kinetic energy caused by the external force that is perturbing the flow field. For this reason, the
 $PKE$
profiles along the centreline (i.e.
 $PKE_{c}$
) show a maximum on the orifice exit and then monotonically decrease. This maximum is located on the orifice exit because, at that position, the amplitude of the external oscillation attains the highest value. For each orifice-to-plate distance, it can be observed that, the higher the Strouhal number, the lower is the
 $PKE_{c}$
value. The region characterized by high values of
 $PKE_{c}$
decreases its extent as the Strouhal number increases. For example, for the
 $H/D_{0}=6$
case, the region characterized by
 $PKE_{c}\geqslant 0.4$
has an extent that increases with decreasing Strouhal number (i.e.
 $2.9D_{0}$
,
 $3.9D_{0}$
and
 $4.6D_{0}$
, respectively). This is caused by the influence of the amplitude of the oscillating external force that perturbs the flow field. The higher the half piston stroke (the lower the Strouhal number), the farther downstream the influence of the external perturbation is felt.
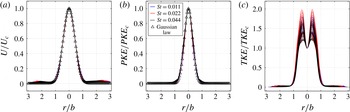
Considering the flow field at the highest orifice-to-plate distance (
 $H/D_{0}=6$
), the dimensionless time-average axial velocity component (
 $U/U_{c}$
) shows self-similar behaviour for all the Strouhal number cases as shown in figure 7. The self-similarity is obtained by accounting for the profiles of velocity after the starting point of the shear layer merging:
 $4.2D_{0}$
,
 $3.6D_{0}$
and
 $3.2D_{0}$
for
 $St$
equal to 0.011, 0.022 and 0.044, respectively. Self-similarity persists until one diameter upstream of the impingement plate. The
 $U/U_{c}$
profiles collapse and they can be fitted with a Gaussian distribution with a mean and a variance equal to 1 and 0.592, respectively, and with a correlation factor
 $R^{2}=0.997$
. A self-similar behaviour can also be observed for the
 $PKE/PKE_{c}$
quantity whose radial distribution is fitted with a Gaussian-shaped profile with a mean and a variance equal to 1 and 0.425, respectively, and with a correlation factor
 $R^{2}=0.995$
. In contrast to these latter dimensionless quantities, the
 $TKE/TKE_{c}$
radial distributions do not collapse. These profiles are characterized by two peaks located along the shear layer whose dimensionless values are still affected by the axial position
 $x/D_{0}$
.
Radial distribution of
 $U/U_{c}$
(
 $a$
),
 $PKE/PKE_{c}$
(
 $b$
) and
 $TKE/TKE_{c}$
(
 $c$
) for
 $x/D_{0}$
ranging between
 $4.2D_{0}$
(
 $St=0.011$
or
 $L_{0}/D=90.91$
),
 $3.6D_{0}$
(
 $St=0.022$
or
 $L_{0}/D=45.45$
) and
 $3.2D_{0}$
(
 $St=0.044$
or
 $L_{0}/D=22.72$
) and
 $5D_{0}$
, for the
 $H/D_{0}=6$
case at
 $Re=35\,000$
.

Time-average axial and radial velocity behaviour at 0.1
 $D_{0}$
from the impingement plate for all Strouhal numbers for the
 $H/D_{0}=2$
, 4 and 6 cases, respectively, at
 $Re=35\,000$
.

Time-average turbulent and phase-correlated kinetic energy behaviour at
 $0.1D_{0}$
from the impingement plate for all Strouhal numbers for the
 $H/D_{0}=2$
, 4 and 6 cases, respectively, at
 $Re=35\,000$
.

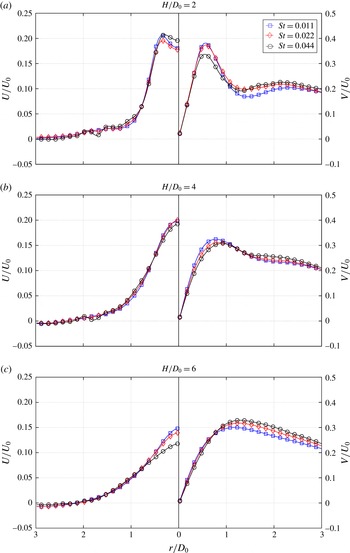
The flow field behaviour is also characterized in the region near the impingement plate, via the time-average axial and radial velocity components,
 $PKE$
and
 $TKE$
at
 $0.1D_{0}$
from the impingement plate along the radial direction as hereinafter discussed. In figures 8 and 9 the behaviour of all time-average velocity components is illustrated. For
 $H/D_{0}=2$
the time-average axial velocity component shows a profile with a local minimum on the jet axis. This local minimum attains its greatest value for the highest Strouhal number configuration. Then, at
 $r/D_{0}=0.35$
, a local maximum is detected, and after that the value starts decreasing. As
 $H/D_{0}$
increases, the profile becomes Gaussian-shaped and the highest Strouhal number case shows the minimum value on the jet axis. This can be ascribed to the flow field morphology. Indeed, at the highest Strouhal number case (i.e.
 $St=0.044$
), the momentum of the impinging trailing jet is drastically reduced with respect to the other configurations.
The time-average radial velocity component shows a peak at
 $r/D_{0}=0.55$
for
 $H/D_{0}=2$
. The highest Strouhal number configuration shows the minimum value at this radial position, but for
 $r/D_{0}\geqslant 1.5$
it attains its highest values. This behaviour is different from the lowest Strouhal number case. The radial velocity over the impingement plate is due to two main contributions: (i) the sweeping vortex ring and (ii) the wall jet generated by the impinging trailing jet. The contribution of the vortex ring is greater than the wall jet as the Strouhal number increases. For this reason the first peak, mainly related to the impinging trailing jet, increases as the Strouhal number decreases, while the behaviour is the opposite for
 $r/D_{0}\geqslant 1.5$
. Moreover for this radial region (i.e.
 $r/D_{0}\geqslant 1.5$
) the vortex ring trajectory shows a path slightly closer to the impingement plate for the highest Strouhal number case (as shown in the vortex ring behaviour subsection). For
 $H/D_{0}=4$
the first peak decreases and moves towards a higher radial position, consistent with the jet width behaviour (figure 4), while the second one, at
 $r/D_{0}=2.2$
, is barely visible. The highest Strouhal number case still presents the highest values of
 $V$
for
 $r/D_{0}\geqslant 1.5$
. For
 $H/D_{0}=6$
the highest Strouhal number case shows the maximum time-average radial velocity because the main contribution is due to the sweeping vortex ring. For this reason, this peak is farther from the jet axis as the Strouhal number increases.
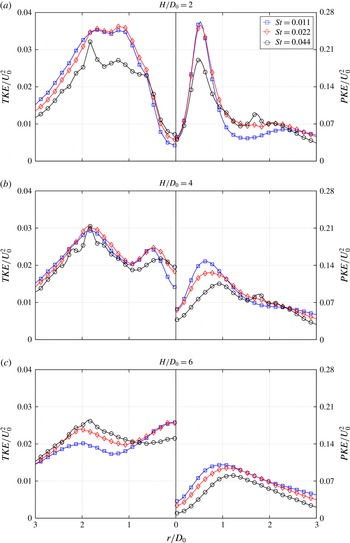
The behaviour of the time-average turbulent and phase-correlated kinetic energy at 0.1 diameters from the impingement plate is shown in figure 9. The
 $TKE$
profiles are characterized by a local minimum on the jet axis because the shear layer is not yet merged. Then at
 $r/D_{0}=1.2$
and 1.8 two peaks are observed. The first peak is definitely higher for the two lower Strouhal number cases because it is related to the presence of a stronger wall jet caused by the impinging trailing jet. On the contrary, the second peak is more influenced by the sweeping vortex ring. After these two peaks, the slope of the decreasing values is similar for all three cases. As
 $H/D_{0}$
increases, a different behaviour is detected on the jet axis. Thus the highest Strouhal number case shows the largest value of
 $TKE$
because the shear layer merges at a shorter axial distance from the orifice plate. The value of
 $TKE$
on the jet axis for
 $H/D_{0}=4$
decreases as the Strouhal number decreases. Then two peaks are observable. The first one is located, for
 $St=0.044$
, at
 $r/D_{0}=0.32$
. This position shifts towards higher radial positions (0.47 and 0.52) as the Strouhal number decreases. The second one is still located at
 $r/D_{0}=1.8$
. Between these two peaks, the
 $TKE$
is lower than that observed at the previous orifice-to-plate distance because of the decreased influence of the turbulence related to the wall jet. After the second peak, the slope of these curves is still the same. For
 $H/D_{0}=6$
, the maximum value is attained on the jet axis in the two lower Strouhal number cases. In contrast to the behaviour near the jet axis, the
 $TKE$
at higher radial positions decreases because the wall jet is weaker and attains lower turbulence values. As expected, the Strouhal number case that is most influenced by the wall jet (i.e.
 $St=0.011$
) shows the lowest
 $TKE$
values at higher radial positions. The second peak is still visible at
 $r/D_{0}=1.8$
for
 $St=0.044$
. This peak decreases and shifts towards higher radial positions as the Strouhal number decreases because the influence of the vortex ring is lower than that of the wall jet.
The time-average phase-correlated kinetic energy (figure 9) shows a peak at
 $r/D_{0}=0.5$
. This first maximum attains lower values at higher Strouhal numbers because the external force decreases its influence (as shown in figure 6). For a value of
 $r/D_{0}$
between 0.8 and 2.4, the
 $PKE$
at
 $St=0.022$
and 0.044 attains values higher than the lowest Strouhal number case. For
 $r/D_{0}\geqslant 2.7$
, these values decrease as the Strouhal number increases. As
 $H/D_{0}$
increases, the
 $PKE$
values decrease because of the lower influence of the external force on the impingement plate. At higher
 $H/D_{0}$
values, the first peak decreases and it shifts towards higher radial positions. Such positions have a radial location that increases as the Strouhal number increases because they are more influenced by the sweeping vortex ring.
Flow rate at
 $H/D_{0}=6$
and
 $Re=35\,000$
.

4.2 Entrainment
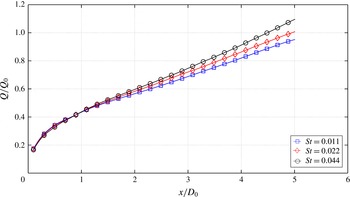
In figure 10 the flow rate for the longest orifice-to-plate distance case (i.e.
 $H/D_{0}=6$
) for each Strouhal number is shown. The values are calculated using (3.9) and they are plotted along the
 $x$
axis from the orifice exit until one diameter upstream of the impingement plate because of its influence on the flow field. ZNMF jets are characterized by a zero mean flow rate on the orifice exit, so the reference flow rate (
 $Q_{0}$
) is defined as
 $$\begin{eqnarray}Q_{0}=\frac{\unicode[STIX]{x03C0}D_{0}^{2}}{4}U_{0}.\end{eqnarray}$$
For all the Strouhal number cases, it has to be pointed out that the measured flow rate tends to zero as
 $x/D_{0}$
decreases, as required by the fact that the net mass flux, for these devices, is zero. It is possible to observe that for
 $x/D_{0}\leqslant 1$
the flow rate behaviour is similar for all the Strouhal number cases. Downstream of this axial location the flow rate value increases with the Strouhal number. An approximately linear growth for
 $x/D_{0}\geqslant 1.5$
is detectable. The slope for each case coincides with the entrainment and scales with Strouhal number. The value of the dimensionless entrainment (
 $\unicode[STIX]{x1D716}/D_{0}U_{0}$
) is approximately 0.13, 0.11 and 0.1 for
 $St=0.044$
, 0.022 and 0.011, respectively. This behaviour is due to the vortex ring, which has more influence on the flow field as the Strouhal number increases. Such a vortex ring promotes the entrainment of ambient air in the ZNMF jet. The mechanism of the entrainment for a turbulent continuous jet has been widely studied in the literature (Mathew & Basu Reference Mathew and Basu2002; Agrawal & Prasad Reference Agrawal and Prasad2004; Philip & Marusic Reference Philip and Marusic2012; Khashehchi et al.
Reference Khashehchi, Ooi, Soria and Marusic2013). In particular Philip & Marusic (Reference Philip and Marusic2012) found that entrainment in a turbulent jet is due to both small and large scales, with entrainment by these scales consisting of three contributions: nibbling (due to small scales), engulfment and induced flow (both due to the large scales). In a ZNMF jet the large scales include the primary vortex ring and the vortex rings generated by the Kelvin–Helmholtz instability along the shear layer of the trailing jet. The primary vortex ring is more intense than those generated by this instability and, therefore, its contribution to the entrainment is higher. Since during a period the trailing jet is replaced by the primary vortex ring as the Strouhal number increases, the contribution to the entrainment of the primary vortex ring essentially replaces that due to the vortex ring generated by the Kelvin–Helmholtz instability resulting in a higher
 $\unicode[STIX]{x1D716}/D_{0}U_{0}$
.
4.3 Phase-average measurements
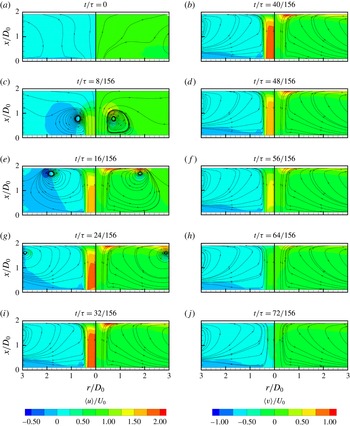
In figures 11–18 the phase-average velocity component maps at
 $H/D_{0}=2$
and 6 for
 $St=0.011$
and 0.044 are shown. Only 10 phases (for
 $H/D_{0}=2$
) and nine phases (for
 $H/D_{0}=6$
), with a time step
 $\unicode[STIX]{x0394}t/\unicode[STIX]{x1D70F}$
of
 $8/156$
, are chosen in order to represent the ejection cycle.
In figure 11 the axial and radial velocity maps at
 $H/D_{0}=2$
, for
 $St=0.011$
, are shown. At
 $t/\unicode[STIX]{x1D70F}=0$
the ejection phase starts, while at
 $t/\unicode[STIX]{x1D70F}=8/156$
the vortex ring is completely formed and the following trailing jet is easily detectable. At
 $t/\unicode[STIX]{x1D70F}=16/156$
the ZNMF jet impinges on the plate and it is possible to see that the axial velocity profile is not Gaussian-shaped near the impingement plate. A minimum of the local axial velocity is observed on the jet axis (
 $r/D_{0}=0$
) near the stagnation zone. Such behaviour is due to the adverse pressure gradient caused by the impingement plate. The radial velocity component shows two maxima: the first is located where the jet rotation is detectable near the impingement plate at
 $r/D_{0}\approx 0.5$
, and the second is located between the sweeping vortex ring and the plate. At
 $t/\unicode[STIX]{x1D70F}=24/156$
the values of the region of high axial velocity are increased and the vortex ring moves out of the measurement zone. For
 $24/156<t/\unicode[STIX]{x1D70F}<40/156$
the behaviour of the ZNMF jet remains the same and resembles a continuous jet. For
 $t/\unicode[STIX]{x1D70F}\geqslant 40/156$
the axial and radial velocity decrease.
Axial (left) and radial (right) velocity maps for the
 $H/D_{0}=2$
and
 $St=0.011$
(or
 $L_{0}/D=90.91$
) case at
 $Re=35\,000$
.

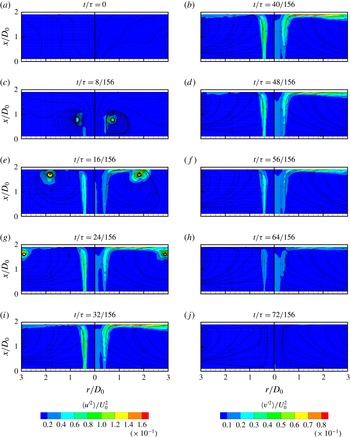
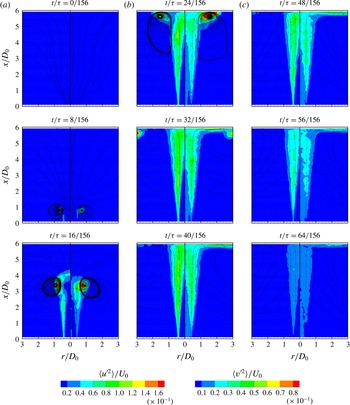
In figure 12 the mean-squared axial and radial turbulent velocity maps at
 $H/D_{0}=2$
, for
 $St=0.011$
, are shown. The ZNMF jet starts issuing at
 $t/\unicode[STIX]{x1D70F}=0$
, and at
 $t/\unicode[STIX]{x1D70F}=8/156$
it is characterized by a peak of axial turbulence near the vortex core. Also a non-zero value is observable along the shear layer. The radial component attains its maximum in the vortex ring core as well. At
 $t/\unicode[STIX]{x1D70F}=16/156$
high values of radial and axial turbulence are observed along the shear layer, with their maxima still located in the vortex ring core. Furthermore, another two regions with high values of the radial component are present: one is located where the complete rotation of the jet occurs, and the other is ahead of the vortex ring near the impingement plate. Such a second peak is caused by a secondary counter-rotating vortex generated by the sweeping vortex ring (see also Greco et al.
Reference Greco, Castrillo, Crispo, Astarita and Cardone2016). Also a small non-zero turbulent region is present near the jet axis at
 $r/D_{0}=0$
. At
 $t/\unicode[STIX]{x1D70F}=24/156$
the axial turbulent velocity component still shows high values along the shear layer and in the vortex ring core. Instead, the radial component has its maximum in the vortex ring core and also in the region near the plate which spans from the impinging shear layer to the vortex ring for
 $r/D_{0}$
ranging between 0.7 and 2. Moreover the radial component shows high values along the shear layer and low values in the region near the jet axis (which starts from the orifice exit). For the phases ranging from
 $t/\unicode[STIX]{x1D70F}=32/156$
to
 $40/156$
the behaviour is the same, while for
 $t/\unicode[STIX]{x1D70F}>40/156$
the turbulent fluctuations decrease. It is noteworthy that during this ejection phase the shear layers do not merge. This leads to a zone along the jet axis featured by zero axial turbulence level and low radial one. This region, shown also for free ZNMF jets in Greco et al. (Reference Greco, Ianiro, Astarita and Cardone2013), resembles the potential core region present in continuous jets (Abramovich Reference Abramovich1963).
Mean-squared axial (left) and radial (right) turbulent velocity maps for
 $H/D_{0}=2$
and
 $St=0.011$
(or
 $L_{0}/D=90.91$
) case at
 $Re=35\,000$
.

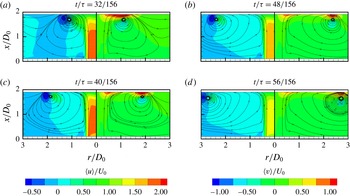
Axial (left) and radial (right) velocity maps for the
 $H/D_{0}=2$
and
 $St=0.044$
(or
 $L_{0}/D=22.72$
) case at
 $Re=35\,000$
.

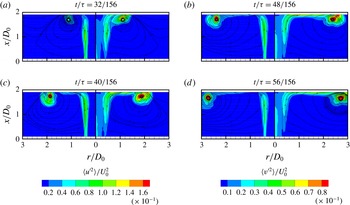
Mean-squared axial (left) and radial (right) turbulent velocity maps for the
 $H/D_{0}=2$
and
 $St=0.044$
(or
 $L_{0}/D=22.72$
) case at
 $Re=35\,000$
.

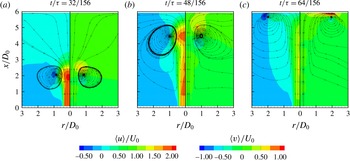
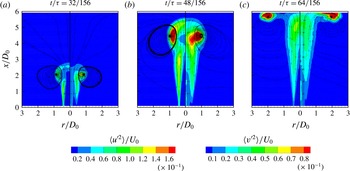
The phase-average axial and radial velocity and mean-squared turbulent components for
 $St=0.044$
and
 $H/D_{0}=2$
are shown in figures 13 and 14, respectively. In contrast to the previous case, only four phases are shown in order to highlight the differences and the similarities between the two configurations. The first phase shown, at
 $t/\unicode[STIX]{x1D70F}=32/156$
, illustrates the ZNMF jet impinging on the plate. The impingement occurs later in this configuration because the displacement of the vortex ring scales with the stroke length (Shuster & Smith Reference Shuster and Smith2007). At this phase, the profile of the time-average axial velocity near the impingement plate is similar to that observed for the highest Strouhal number case. At
 $t/\unicode[STIX]{x1D70F}=40/156$
, the axial velocity component decreases while the vortex ring is still near the impingement plate in the measurement zone, in contrast to the case at
 $St=0.011$
. The next phase,
 $t/\unicode[STIX]{x1D70F}=48/156$
, shows that the first peak of radial velocity at
 $r/D_{0}=0.5$
decreases because the jet axial velocity reduces while the second peak is still clearly visible and large. In fact, at
 $t/\unicode[STIX]{x1D70F}=56/156$
the second radial peak has a much higher value than the first one, which is almost not observable. This behaviour is clearly related to the Strouhal number. As the Strouhal number increases, the extent of the trailing jet decreases as does the vortex ring velocity convection. This phenomenon leads to a flow field that is much more influenced by the presence of the vortex ring.
The mean-squared axial and radial turbulent components at
 $t/\unicode[STIX]{x1D70F}=32/156$
show the same behaviour as the previous case at
 $St=0.011$
. At
 $40/156\leqslant t/\unicode[STIX]{x1D70F}\leqslant 48/156$
, the turbulence attains higher values than the
 $St=0.011$
case, in the vortex ring core and in the region ahead of it, while lower values are found in the wall jet region. The shear layer still shows high turbulent values as in the previous case. At
 $t/\unicode[STIX]{x1D70F}=56/156$
the values near the plate and along the shear layer decrease, opposite to that found in the vortex ring core. Even for this configuration the shear layers do not merge and a zone, featured by zero axial turbulence and low radial one, is detected near the jet axis.
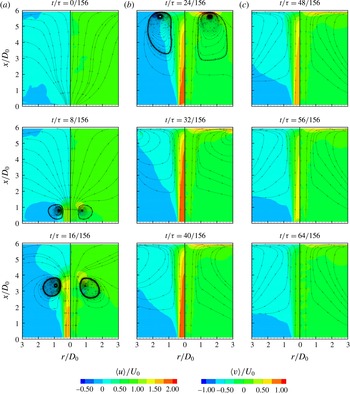
Axial (left) and radial (right) velocity maps for the
 $H/D_{0}=6$
and
 $St=0.011$
(or
 $L_{0}/D=90.91$
) case at
 $Re=35\,000$
.

In figure 15 the axial and radial velocity maps for
 $St=0.011$
and
 $H/D_{0}=6$
are shown. The ZNMF jet is issued (at
 $t/\unicode[STIX]{x1D70F}=0$
), then convects (at
 $t/\unicode[STIX]{x1D70F}=8/156$
and
 $16/156$
) until it reaches the impingement plate. At
 $t/\unicode[STIX]{x1D70F}=16/156$
, the maximum of the axial velocity is not in the centre of the vortex ring but is located on the jet axis (in the following trailing jet). This agrees with McGuinn et al. (Reference McGuinn, Farrelly, Persoons and Murray2013), who found that the maximum velocity of a ZNMF jet is detected not in the vortex ring centre but in the trailing jet for high
 $L_{0}/D$
values (or low
 $St$
values). At
 $t/\unicode[STIX]{x1D70F}=24/156$
and
 $t/\unicode[STIX]{x1D70F}=32/156$
the ZNMF jet has already spread over the plate and is sweeping the plate itself. During these phases, the radial velocity shows a maximum between the plate and the vortex ring which is higher than the one located in the rotation region of the impinging ZNMF jet. This is also related to the axial velocity profile, which approaches the impingement plate. In this case (
 $H/D_{0}=6$
) the profile is Gaussian-shaped and, for this reason, the radial velocity attains a value lower than that in the shortest case (figure 8). At
 $t/\unicode[STIX]{x1D70F}=32/156$
, the vortex ring is almost out of the measurement zone and the flow field resembles the impinging continuous jet case. Furthermore a mild peak of high radial velocity is still located near the plate where the impinging ZNMF jet rotates. For
 $t/\unicode[STIX]{x1D70F}\geqslant 40/156$
the axial and radial velocity values decrease.
In figure 16 the mean-squared axial and radial turbulent velocity components for
 $St=0.011$
and
 $H/D_{0}=6$
are depicted. At
 $t/\unicode[STIX]{x1D70F}=8/156$
the first values different from zero are observed. As usual, the high turbulence values are located near the vortex ring core and along the all shear layer (axial turbulence) or a part of it (radial turbulence). At
 $t/\unicode[STIX]{x1D70F}=16/156$
the values increase near the vortex ring core while the shear layer is wider and more extensive. It is worth nothing that the axial turbulent velocity component shows high values also on the leading-edge boundary of the vortex ring but not on its centre (located on the jet axis). This is different from the radial component. At
 $t/\unicode[STIX]{x1D70F}=24/156$
the peak of axial turbulence is always near the vortex ring core, while the radial one is near the impingement plate, where the secondary counter-rotating vortex ring is located. Moreover the shear layer is characterized by high turbulence values and it reaches to the impingement plate. At
 $t/\unicode[STIX]{x1D70F}=32/156$
the vortex ring is almost beyond the measurement zone, while the high turbulence values are located along the shear layer. It has to be pointed out that from
 $t/\unicode[STIX]{x1D70F}=24/156$
to
 $t/\unicode[STIX]{x1D70F}=40/156$
the shear layer characterized by high turbulence values reaches the impingement plate and starts merging on the jet axis far from the orifice plate. Such a triangular region is characterized by zero axial turbulence and very low radial one. For
 $t/\unicode[STIX]{x1D70F}>40/156$
these values decrease.
Mean-squared axial (left) and radial (right) turbulent velocity maps for the
 $H/D_{0}=6$
and
 $St=0.011$
(or
 $L_{0}/D=90.91$
) case at
 $Re=35\,000$
.

The phase-average axial and radial velocity and mean-squared turbulent components for
 $St=0.044$
and
 $H/D_{0}=6$
are shown in figures 17 and 18, respectively. Only three phases are shown in order to highlight the differences and similarities between these two configurations. At
 $t/\unicode[STIX]{x1D70F}=32/156$
the maximum of the axial velocity is clearly detected in the vortex ring centre, contrary to the lowest Strouhal number case (figure 15). At
 $t/\unicode[STIX]{x1D70F}=48/156$
the ZNMF jet begins to approach the impingement plate. Differently from the previous case, the impingement starts when the decelerating part of the ejection phase has already begun – indeed the axial values decrease. At
 $t/\unicode[STIX]{x1D70F}=64/156$
high values of the radial component can be detected only near the wall at a radial position where the vortex ring is located. In this configuration, the radial velocity values are higher than those in the previous case and the wall jet, caused by the impinging trailing jet, is much weaker.
Axial (left) and radial (right) velocity maps for the
 $H/D_{0}=6$
and
 $St=0.044$
(or
 $L_{0}/D=22.72$
) case at
 $Re=35\,000$
.

During the formation and convection of the vortex ring (
 $0\leqslant t/\unicode[STIX]{x1D70F}\leqslant 48/156$
) the high values of the turbulence are located near the vortex ring and along the shear layer, as already observed in the previous case. In contrast, at
 $t/\unicode[STIX]{x1D70F}=48/156$
, the triangular region characterized by zero axial turbulence and very low radial turbulence has an extent, in the axial direction, lower than the previous case. This is caused by the trailing jet whose extent during the expulsion stroke is shorter because of the high Strouhal number. During this phase, the ZNMF jet is going to impinge on the plate and the region of high turbulence expands for both components. At
 $t/\unicode[STIX]{x1D70F}=64/156$
the high turbulence values are still detected moving with the sweeping vortex ring. On the other hand, the shear layer, which has just touched the impingement plate, shows decreasing values of turbulence fluctuations, different from the lowest Strouhal number case.
Mean-squared axial (left) and radial (right) turbulent velocity maps for the
 $H/D_{0}=6$
and
 $St=0.044$
(or
 $L_{0}/D=22.72$
) case at
 $Re=35\,000$
.

4.4 Vortex ring behaviour
The vortex ring behaviour has been characterized through the evaluation of its trajectory and vorticity. The vortex ring has been detected through the azimuthal vorticity (
 $\unicode[STIX]{x1D714}_{\unicode[STIX]{x1D703}}$
). The local maximum of this vorticity near the coherent vortex structure has been chosen as the core of the vortex ring. In order to improve the detection of the vortex ring core position, a spline interpolation of the velocity field was performed.
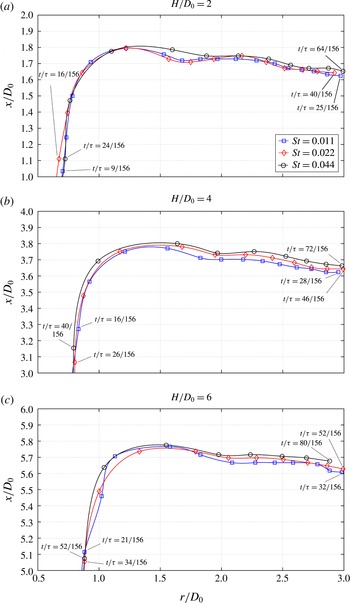
Vortex ring trajectory for all Strouhal numbers for the
 $H/D_{0}=2$
, 4 and 6 cases, respectively, at
 $Re=35\,000$
. For each trajectory the first and last phases of the vortex ring presence inside the analysed region are reported. The time spacing
 $\unicode[STIX]{x0394}t/\unicode[STIX]{x1D70F}$
between the markers is:
 $4/156$
(
 $St=0.044$
or
 $L_{0}/D=22.72$
),
 $2/156$
(
 $St=0.022$
or
 $L_{0}/D=45.45$
) and
 $1/156$
(
 $St=0.011$
or
 $L_{0}/D=90.91$
).

The trajectory of the vortex ring is shown (figure 19) only in the last diameter upstream of the impingement plate. In figure 19 the markers represent the positions of the vortex ring core while the solid curves are a spline interpolation of these data. At
 $H/D_{0}=2$
, the vortex ring trajectory starts from a radial position equal to approximately
 $0.7D_{0}$
for
 $St=0.011$
and 0.044 while
 $0.65D_{0}$
for
 $St=0.022$
. These trajectories coalesce at
 $x/D_{0}\approx 1.35$
. Then the path seems to be similar until
 $r/D_{0}=1.2$
. From this position the vortex ring path, at
 $St=0.044$
, shows a trajectory closer to the impingement plate than the other two cases. During the sweeping phase of the vortex ring, some maxima and minima of the distance between the vortex ring core and the impingement plate can be observed. The first minimum distance (first rebound) between the vortex ring core and the impingement plate is observed at
 $r/D_{0}=1.35$
(
 $St=0.044$
) and 1.2 (
 $St=0.011$
and 0.022). Then the data for the lower Strouhal number cases show their first maximum distance from the impingement plate at
 $r/D_{0}=1.7$
. Such maximum is located at a greater radial position (i.e.
 $r/D_{0}=1.9$
) for the highest Strouhal number case. This maximum distance from the impingement plate is definitely shorter than those of the lowest Strouhal number cases. This is followed by the vortex ring moving again towards the impingement plate for all cases. The data for
 $St$
= 0.022 and 0.044 show the minimum distance from the impingement plate (second rebound) at
 $r/D_{0}\approx 2.1$
. The trajectory at the lowest Strouhal number shows the second minimum distance from the impingement plate at
 $r/D_{0}=1.8$
and then this distance is constant until
 $r/D_{0}=2.1$
.
This behaviour is similar to that shown by Fabris, Liepmann & Marcus (Reference Fabris, Liepmann and Marcus1994). They found that the trajectory of the impinging vortex ring is characterized by a double rebound. Although after such rebounds other small oscillations are present, the vortex ring core moves away from the impingement plate, as also found by Valiorgue et al. (Reference Valiorgue, Persoons, McGuinn and Murray2009).
At
 $H/D_{0}=4$
the path of the vortex ring core at the highest Strouhal number is still the closest to the impingement plate. For this
 $H/D_{0}$
, the distance between the impingement plate and the vortex ring core increases as the Strouhal number decreases. The first rebound is clearly observable differently from the second one, which is less evident as the Strouhal number increases. Both rebounds occur at higher radial positions, while the other small oscillations are no longer observable. At
 $H/D_{0}=6$
, the trajectory at the lowest Strouhal number still has the minimum distance from the impingement plate. During the sweeping phase (for
 $r/D_{0}\geqslant 1.7$
) the distance between the impingement plate and the vortex ring core increases as the Strouhal number decreases. Moreover the second rebound reduces while the small oscillations disappear (apart from the lowest Strouhal number case at
 $r/D_{0}=2.75$
).
The double rebound is ascribed to the secondary vortex ring formation near the impingement plate (Fabris et al. Reference Fabris, Liepmann and Marcus1994). Indeed, the second rebound reduces as the orifice-to-plate distance increases because the secondary vortex ring decreases in size and strength.
Vortex ring vorticity for all Strouhal numbers for the
 $H/D_{0}=2$
, 4 and 6 cases, respectively, at
 $Re=35\,000$
.

In figure 20 the azimuthal vorticity
 $\unicode[STIX]{x1D714}_{\unicode[STIX]{x1D703}}$
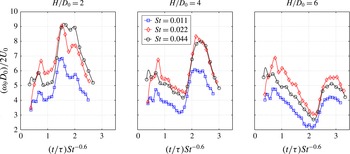
of the vortex ring core is shown. The markers represent the measured data while the solid curves are a spline interpolation. At
 $H/D_{0}=2$
, the vorticity behaviour is similar for all the Strouhal number cases. Firstly it increases, attaining its maximum value around
 $St^{-0.6}t/\unicode[STIX]{x1D70F}\approx 0.7$
when the vortex ring is fully formed. Then the vortex ring convects downstream and its vorticity decreases until
 $St^{-0.6}t/\unicode[STIX]{x1D70F}\approx 0.9$
. The vorticity starts to increase again because the vortex ring is influenced by the impingement plate. Indeed at
 $St^{-0.6}t/\unicode[STIX]{x1D70F}\approx 0.9$
the vortex ring core has a distance from the plate lower than one diameter. The vorticity increases until
 $St^{-0.6}t/\unicode[STIX]{x1D70F}\approx 1.55$
where it attains its absolute maximum, which is ascribed to the secondary vortex ring formation. At this stage the vortex ring is located after the first rebound and it is moving away from the impingement plate (figure 19), generating the secondary vortex ring. This is followed by the vorticity decreasing and then it increases again, reaching a second maximum at
 $St^{-0.6}t/\unicode[STIX]{x1D70F}\approx 2$
. This second peak corresponds to the end of the second rebound of the vortex ring trajectory (figure 19). After this peak the vorticity decreases. At this orifice-to-plate distance for
 $St=0.022$
the azimuthal vorticity attains the highest value until the first rebound. Then
 $\unicode[STIX]{x1D714}_{\unicode[STIX]{x1D703}}$
attains the greatest value for the highest Strouhal number configuration.
At
 $H/D_{0}=4$
the behaviour is similar. In fact,
 $\unicode[STIX]{x1D714}_{\unicode[STIX]{x1D703}}$
increases, reaching a maximum in the phase at which the complete formation of the vortex ring is detected. After such a maximum, the azimuthal vorticity decreases. A minimum is obtained at
 $St^{-0.6}t/\unicode[STIX]{x1D70F}\approx 1.65$
when the vortex ring has a distance from the impingement plate lower than one diameter. Then the vorticity starts increasing because of the interaction between the impingement plate and the vortex ring. After this increase, the values are almost constant (
 $St=0.011$
and 0.044) or slightly decreasing (
 $St=0.022$
) until the final decrease begins. The vortex ring attains these highest vorticity values after its first rebound. Opposite to the shortest orifice-to-plate distance, a clear second peak is not observed because only a mild second rebound occurs (figure 19). The final decrease of the vorticity values begins only at the end of this mild rebound when the vortex ring is definitely moving away from the impingement plate. At this orifice-to-plate distance,
 $\unicode[STIX]{x1D714}_{\unicode[STIX]{x1D703}}$
at
 $St=0.022$
attains the highest value until the end of the first rebound. Then also the lowest Strouhal number case shows the same vorticity values during the sweeping phase. At
 $H/D_{0}=6$
the behaviour is similar to that previously explained for
 $H/D_{0}=4$
. In fact, the vortex ring has maximum
 $\unicode[STIX]{x1D714}_{\unicode[STIX]{x1D703}}$
after the first rebound and the final decrease begins when the vortex ring moves far from the impingement plate. In contrast,
 $\unicode[STIX]{x1D714}_{\unicode[STIX]{x1D703}}$
at
 $St=0.022$
shows the highest value during the entire vortex ring trajectory at this orifice-to-plate distance.
Hence, as
 $H/D_{0}$
increases, the vortex ring arrives on the impingement plate with diminished vorticity and this vorticity attains the lowest values for the highest Strouhal number case. At the shortest orifice-to-plate distance, three peaks are visible: the first related to the complete formation of the vortex ring and the other two due to the double rebound. At higher orifice-to-plate distances, the decreased vorticity of the vortex ring and the weakened secondary vortex ring lead to the disappearance of the last peak.
Saddle point behaviour for all Strouhal numbers for the
 $H/D_{0}=2$
, 4 and 6 cases, respectively, at
 $Re=35\,000$
.

4.5 Saddle point behaviour
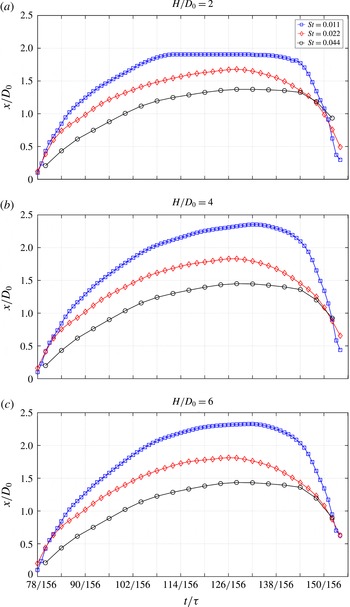
ZNMF jets are characterized by an ejection phase and a suction phase. During the suction phase, the flow field is characterized by a point whose velocity is equal to zero. Such a point is known as a saddle point (Glezer & Amitay Reference Glezer and Amitay2002). In figure 21 the behaviour of the saddle point is shown. Its position (
 $x_{s}$
) has been determined through the detection, along the jet axis, of the point characterized by zero axial velocity. In order to improve the detection of this position, a spline interpolation of the velocity field was performed.
At
 $H/D_{0}=2$
, the saddle point axial position starts increasing as
 $t/\unicode[STIX]{x1D70F}$
increases. The slope is steeper as the Strouhal number decreases because of the higher volume of fluid pulled into the piston cavity during the suction phase. For this reason, the saddle point position attains a farther position from the orifice plate as the Strouhal number decreases. At
 $t/\unicode[STIX]{x1D70F}=110/156$
, the saddle point is located on the impingement plate for the lowest Strouhal number case, in contrast to the other two configurations. These latter show the maximum value at
 $t/\unicode[STIX]{x1D70F}=129/156$
. After the maximum,
 $x_{s}$
decreases because the saddle point is moving back to the orifice plate.
At
 $H/D_{0}=4$
, the starting behaviour of
 $x_{s}$
for all the Strouhal number cases is similar to what was previously described. For this orifice-to-plate distance, the saddle point position for the
 $St=0.011$
case attains its maximum excursion without reaching the impingement plate. It has to be pointed out that the values attained by
 $x_{s}$
for the other two Strouhal number cases are higher than those shown at
 $H/D_{0}=2$
. This is most likely to be related to the presence of the impingement plate, which affects the flow field behaviour even during the suction phase. In fact the saddle point behaviour for all the Strouhal number cases at
 $H/D_{0}=6$
is the same as that at
 $H/D_{0}=4$
.
The saddle point excursion also depends on the device configuration. The investigated configuration forces the saddle point to move farther from the ZNMF jet exit with respect to nozzle configurations such as short pipe, long pipe or contoured ones. This is caused by the two parallel plates which confine the flow field region of the ZNMF jet. Such a confinement effect is less significant in the case of a ZNMF jet issued from a nozzle. In that case the saddle point excursion is lower because during the suction phase the ingested fluid is also drawn from the region upstream of the nozzle itself.
Hence the ingestion of fluid close to the impingement plate strictly depends on the device configuration, the orifice-to-plate distance and the Strouhal number value. Such ingestion could deteriorate the heat transfer performance of the ZNMF jet device when used as an electronic cooling system. In fact, in these applications, during the suction phase the fluid runs along the hot impingement plate, which has to be cooled, increasing its temperature and, once ingested in the device, is re-used as cooling fluid during the ejection phase.
5 Discussion
5.1 Impinging ZNMF jet evolution and orifice-to-plate distance effect
During the expulsion phase of a ZNMF jet, a vortex ring is generated by the roll-up of the flow, which separates from the orifice edge. This vortex ring then convects downstream under its self-induced velocity if the formation criterion (Holmann et al. Reference Holmann, Utturkar, Mittal, Smith and Cattafesta2005), which is strictly related to the Strouhal number, is satisfied. The Strouhal number is responsible for the ZNMF jet formation and also for its main features. Indeed, the ZNMF jet flow field during the expulsion stroke is influenced not only by the vortex ring but also by the trailing jet if the Strouhal number is low enough.
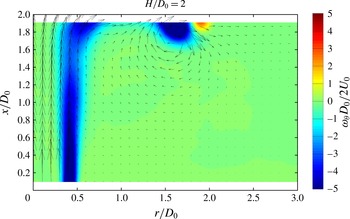
During the evolution towards the impingement plate, the ZNMF jet spreads because of momentum diffusion in the radial direction caused by the shear layer presence. As the ZNMF jet approaches the impingement plate, the jet rotates and the vortex ring starts to sweep the plate followed by the wall jet generated by the impinging trailing jet. During this vortex ring sweep, a secondary vortex ring is generated near the impingement plate as shown in figure 22. Similarly to continuous impinging jets, a secondary vortex ring is generated near the impingement plate by the passage of a vortex ring caused by the Kelvin–Helmholtz instability of the external shear layer (Hadžiabdić & Hanjalić Reference Hadžiabdić and Hanjalić2008; Roux et al. Reference Roux, Fénot, Lalizel, Brizzi and Dorignac2011; Rohlfs et al. Reference Rohlfs, Haustein, Garbrecht and Kneer2012; Dairay et al. Reference Dairay, Fortuné, Lamballais and Brizzi2015).
Secondary vortex ring detection for
 $St=0.044$
(or
 $L_{0}/D=22.72$
) and
 $Re=35\,000$
at
 $H/D_{0}=2$
and
 $t/\unicode[STIX]{x1D70F}=36/156$
.

At short orifice-to-plate distances, the strong adverse pressure gradient affects the flow field, causing a double peak axial velocity profile near the impingement plate like in a continuous impinging jet (Carlomagno & Ianiro Reference Carlomagno and Ianiro2014). Each peak of the axial velocity profile causes the inner peak in the radial velocity distribution, which is influenced by the sweeping vortex ring and the wall jet. The turbulence shows high values in several flow field regions: in the vortex ring and secondary vortex ring cores, in the wall jet and along the shear layer. The shear layer does not merge on the jet axis and delimits a region similar to the potential core of continuous jets (Abramovich Reference Abramovich1963). The presence of this impinging potential core is also responsible, along with the strong adverse pressure gradient, for the double peak axial velocity profile near the impingement plate. During the evolution, the vortex ring trajectory shows a strong double rebound near the impingement plate caused by the secondary vortex ring formation, as also observed by Fabris et al. (Reference Fabris, Liepmann and Marcus1994). Throughout its path, the vortex ring core assumes its first maximum value of vorticity when it is fully formed, then it decreases until it is at one diameter from the impingement plate. At this position, the vorticity increases because of the interaction between the plate and the vortex ring. During the sweeping phase, the vorticity of the vortex ring core shows two peaks after these two rebounds.
At higher orifice-to-plate distances, the axial profile near the impingement plate becomes Gaussian-shaped because of the weaker adverse pressure gradient and shear layer merging. As a consequence, the radial velocity inner peak disappears. Furthermore the shear layer merges on the jet axis, leading to a peak in the
 $TKE$
distribution near the impingement plate in the stagnation region. The vortex ring trajectory is still characterized by the first rebound, but the second one is not present because of the decreased strength and size of the secondary vortex ring. During its evolution, the vortex ring is always characterized by the first peak of vorticity when it is fully formed. Then the vorticity linearly decreases until one diameter from the impingement plate. At this point, it increases but the double peak is not observed because of the weakening of the secondary vortex ring.
5.2 Strouhal number influence
The vortex ring and the trailing jet strongly characterize the flow field of a ZNMF jet. The Strouhal number governs the predominance of one feature on the other. As the Strouhal number decreases, the trailing jet affects the flow field more than the vortex ring and vice versa. At low Strouhal numbers the extent of the trailing jet increases as well as the vortex ring convection velocity, leading to a flow field mainly influenced by the trailing jet itself.
The Strouhal number strongly affects the flow field of ZNMF jets. At high Strouhal numbers, the main presence of the vortex ring causes a greater spread of the jet, leading to a lower centreline velocity (figure 3) and a higher jet width (figure 4). Consistently the entrainment and the flow rate (figure 10) increase at high Strouhal numbers. This results in one of the main features of the vortex ring: promoting the entrainment of external ambient air in the jet itself. Also the time-average phase-correlated and turbulent kinetic energy are influenced by the Strouhal number. The phase-correlated kinetic energy decreases as the Strouhal number increases because of a lower amplitude of the external oscillation (figure 6). This lower oscillation amplitude reduces the downstream propagation of the organized wave. The turbulent kinetic energy decreases as the Strouhal number decreases because of the main presence of the trailing jet (figure 5). In this condition the ZNMF jet resembles more a continuous jet with its own features as the potential core (Abramovich Reference Abramovich1963). For the same reason, the extent of this region (i.e. potential core-like region) increases at lower Strouhal number. Such a number governs the axial position along the jet axis at which the turbulence attains its highest value similarly to the thickness ratio parameter for the fractal continuous jets (Cafiero, Discetti & Astarita Reference Cafiero, Discetti and Astarita2015). This position is farther from the orifice exit as the Strouhal number decreases.
Although the Strouhal number affects the flow field, a self-similar behaviour for the time-average axial velocity profiles has been observed (figure 7). A Gaussian-shaped profile fits these profiles located in the region between the end of the potential core-like region and one diameter upstream of the impingement plate. This self-similarity, which is obtained for all the Strouhal number configurations, is observed also for the
 $PKE$
profiles but not for the
 $TKE$
ones. The behaviour near the impingement plate of these quantities such as time-average velocity, phase-correlated and turbulent kinetic energy is influenced by the Strouhal number.
The ZNMF jet evolution shows different behaviours when the Strouhal number varies. At high Strouhal numbers, the maximum of the axial velocity is in the vortex ring core and not in the trailing jet, in agreement with McGuinn et al. (Reference McGuinn, Farrelly, Persoons and Murray2013), and the vortex ring velocity convection is low, in agreement with Shuster & Smith (Reference Shuster and Smith2007). At high Strouhal numbers, the momentum arriving on the impingement plate at high orifice-to-plate distances decreases because of a lower presence and extension of the trailing jet (figure 8). The decrease of the trailing jet also causes a weaker wall jet near the impingement plate, above all, at high orifice-to-plate distances (figure 8). Hence the main contribution to the time-average radial velocity is due to the sweeping vortex ring (figure 17). For the same reason,
 $TKE$
values out of the stagnation region at high orifice-to-plate distances are greater at higher Strouhal number, contrary to the shortest case (figure 9). In contrast, in the stagnation point, the maximum of
 $TKE$
is reached at lower axial position by the higher Strouhal number cases because the extent of the potential core-like region is lower (figure 9). The phase-correlated kinetic energy decreases as the Strouhal number increases because of the external oscillation reduction (figure 9).
The Strouhal number also affects the saddle point excursion. Indeed, as the Strouhal number decreases, the saddle point moves farther from the orifice plate because the piston stroke increases and, consequently, also the fluid ingested in the device cavity (figure 21).
The vortex ring trajectory shows a similar path for all the Strouhal number cases even if this path seems to be closer to the impingement plate (figure 19) as the Strouhal number increases. Its vorticity has the same behaviour in all the Strouhal number configurations. The Strouhal number seems to affect only the value of this quantity. At the shortest
 $H/D_{0}$
the highest Strouhal number configuration attains the greatest vorticity values during the sweeping phase differently from the other orifice-to-plate distances where
 $\unicode[STIX]{x1D714}_{\unicode[STIX]{x1D703}}$
for the
 $St=0.022$
case shows the maximum value (figure 20).
6 Conclusions
This study demonstrates that the flow features of impinging turbulent ZNMF jets are strongly influenced by the Strouhal number and the orifice-to-plate distance.
The Strouhal number mainly affects the ZNMF jet structure because it governs the influence of the vortex ring and the trailing jet on the flow field. At high Strouhal numbers, the flow field is principally characterized by the presence of the vortex ring. This vortex ring is responsible for a higher flow rate and entrainment resulting in a larger jet width and lower centreline velocity. At this Strouhal number, the reduced extent of the trailing jet causes a lower extension of the potential core, higher centreline turbulent kinetic energy and a position of the high turbulent plateau beginning closer to the orifice plate. High Strouhal number implies small stroke length, which is the cause of a lower centreline phase-correlated kinetic energy and a shorter saddle point excursion. The behaviour at low Strouhal number is completely different because the trailing jet is the most influential feature of the flow field.
The orifice-to-plate distance affects the impinging ZNMF jet flow field because it stops its streamwise evolution. This distance governs the shear layer merging, the adverse pressure gradient strength caused by the impingement plate and the vortex ring behaviour. At small orifice-to-plate distances, the high adverse pressure gradient and the presence of an impinging potential core lead to a double peak axial velocity distribution on the plate, causing a peak in the radial velocity component. In contrast, at large distances from the impingement plate, the radial velocity peak disappears because the axial velocity profile is Gaussian-shaped due to the weaker adverse pressure gradient and shear layer merging. Moreover the radial velocity component near the impingement plate is more affected by the vortex ring than the wall jet caused by the impinging trailing jet. At this distance, the vorticity of the impinging primary vortex ring, which linearly decreases during its downstream convection, is not enough to generate a strong secondary counter-rotating vortex ring. For this reason, the vortex ring trajectory does not show the second rebound on the impinging wall during its evolution contrary to the shortest orifice-to-plate distance case.
Acknowledgements
This research was supported by Universitá degli Studi di Napoli Federico II and Compagnia di San Paolo under the STAR Program 2013. The support of the ARC of this research through infrastructure provided by ARC LIEF grants is gratefully acknowledged.