INTRODUCTION
Wheat is the most important crop in Iran and is sown annually on more than 6 million hectares, producing around 14.5 million tonnes of grain (FAO, 2007). Two-thirds of wheat farms in Iran are irrigated and one-third rainfed, and almost all of the wheat crop is winter grown.
Genetic improvement during the past has increased potential yield in wheat. This increase has been assessed in most major wheat production areas such as Argentina (Abbate et al., Reference Abbate, Andrate, Lazaro, Briffi and Berardocco1998), Australia (Perry and D'Antuono, Reference Perry and D'Antuono1989), China (Zhou et al., Reference Zhou, He, Sui, Xia, Zhang and Zhang2007a, Reference Zhou, Zhu, Cai, He, Zhang, Xia and Zhang2007b), France (Brancourt-Hulmel et al., Reference Brandcourt-Hulmel, Doussinalt, Lecomte, Berard, Buanec and Trottet2003), Italy (Canevara et al., 1994), Mexico (Sayre et al., Reference Sayre, Rajram and Fischer1997; Waddington et al., Reference Waddington, Ranson, Osmanza and Saunders1986) and the UK (Austin et al., Reference Austin, Bingham, Blackwell, Evans, Ford, Morgan and Taylor1980; Reference Austin, Ford and Morgan1989; Shearman et al., Reference Shearman, Sylvester-Bradley, Scott and Foulkes2005). Gain in winter wheat yield potential ranged from 0.4% per year from 1830 to 1986 in the UK (Austin et al., Reference Austin, Ford and Morgan1989) to 1.0% per year between 1920 and 1989 in Argentina (Slafer and Andrade, Reference Slafer and Andrade1989). Most of these studies indicated that grain yield increase was due mainly to increased harvest index and kernel number per square metre (Abbate et al., Reference Abbate, Andrate, Lazaro, Briffi and Berardocco1998; Brancourt-Hulmel et al., Reference Brandcourt-Hulmel, Doussinalt, Lecomte, Berard, Buanec and Trottet2003; Royo et al., Reference Royo, Alvaro, Martos, Ramdani, Isidro, Villegas and García del Moral2006; Sayre et al., Reference Sayre, Rajram and Fischer1997). High harvest index was the result of reduced plant height, whereas high seed number per square metre was largely due to an increase in seed number per ear (Royo et al., Reference Royo, Alvaro, Martos, Ramdani, Isidro, Villegas and García del Moral2006; Slafer and Andrade, Reference Slafer and Andrade1989; Zhou et al., Reference Zhou, Zhu, Cai, He, Zhang, Xia and Zhang2007b) or to an increase in both seed per ear and ear number per unit area (Austin et al., Reference Austin, Ford and Morgan1989). It has been shown that total dry matter production remained unchanged as wheat yield increased in these studies (Austin et al., Reference Austin, Bingham, Blackwell, Evans, Ford, Morgan and Taylor1980; Brancourt-Hulmel et al., Reference Brandcourt-Hulmel, Doussinalt, Lecomte, Berard, Buanec and Trottet2003; Sayre et al., Reference Sayre, Rajram and Fischer1997). However, some studies have shown increased biomass to be associated with yield increases (Shearman et al., Reference Shearman, Sylvester-Bradley, Scott and Foulkes2005; Waddington et al., Reference Waddington, Ranson, Osmanza and Saunders1986; 1987), especially in recent years. For example, Shearman et al. (Reference Shearman, Sylvester-Bradley, Scott and Foulkes2005) showed that yield improvement of wheat cultivars during 1972–1995 was positively correlated with both harvest index and aboveground biomass but progress in harvest index was most apparent during the earlier phase of the 23-year period, whereas biomass contributed most since about 1983.
In a study with six wheat cultivars released during the period 1956–1995 in Iran it was observed that grain yield increased by 83 kg ha−1 year−1 while the annual increase in biomass and harvest index was 86 kg ha−1 and 0.0037%, respectively (Zand et al., Reference Zand, Kochaki, Rahimian-Mashadi and Nasiri-Mahallati2002). Yield improvement was significantly correlated with number of seeds per ear and per square metre. In addition, radiation use efficiency, leaf area index and nitrogen use efficiency increased while plant height decreased in recent cultivars (Zand et al., Reference Zand, Kochaki, Rahimian-Mashadi and Nasiri-Mahallati2002). In the present study more cultivars and cultivars introduced prior to and after those investigated by Zand et al. were considered in order to relate yield improvements to physiological and morphological characteristics of these cultivars.
MATERIALS AND METHODS
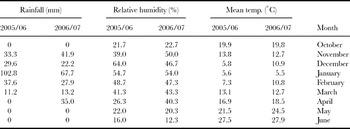
Fifteen wheat cultivars representing 60 years of wheat genetic improvement in Iran were chosen from more than 100 cultivars released during 1940–2000. Each cultivar was representative of the breeding period and mostly recommended for cultivation by farmers at those times. The cultivars were chosen by 4 or 5 year intervals so that each cultivar with respect to others during each period would have considerable yield difference. The years of introduction of cultivars are shown in Table 2. Data were obtained from a 2-year field experiment at Arsanjan Islamic Azad University, Fars Province, Iran (29°55′N, 53°19′E, 1810 m asl), during 2005/6 and 2006/7. The meteorological data for the experimental location during the wheat growing season are shown in Table 1. Each experiment consisted of 15 cultivars sown in winter in a randomized complete block design with four replications.
Mean temperature, relative humidity and rainfall for October–June in each year.

The soil type was sandy clay with a pH of 7.5 and 1.5% organic matter. The field was mouldboard-ploughed and seedbed preparation consisted of two passes with a tandem disc. Prior to planting P (100 kg ha−1 triple superphosphate) and N (50 kg ha−1 urea 46% N) fertilizers were spread and incorporated into the soil. Topdressing of N consisted of 100 kg ha−1 urea at tillering and booting stages (with this N rate there was no lodging observed in the field). Each plot measured 4 m × 2 m in width and consisted of 13 rows spaced at 0.15 m. Seeding rate was about 250 plant m−2 in each year and other field management was carried out according to local practices. Seeding dates were 22 and 25 November in the first and second year, respectively.
At the flowering stage, flag leaf photosynthesis rate, transpiration rate and stomatal conductance were measured using a portable photosynthesis system (ADC-LCi, Great Amwell, UK) in five random selected plants in each plot. Measurements were performed using the flag leaf on days with full sunlight between 09:00 and 11:00 hours. The photosynthetically active radiation was 1400–1900 μmol m−2 s−1 during the measurements. Chlorophyll measurements were performed at the same stage on the flag leaf of five random selected plants in each plot using a chlorophyll meter (CCM-200; Opti-Sciences Inc, Hudson, NH, USA). Three measurements were taken at random on each leaf.
The final samples were hand-harvested at physiological maturity in each plot and consisted of five rows of 2 m length (1.5 m2). Samples were then dried at 70 °C and weighed to give total dry weight. Plant height was measured from stem base to base of the ear in the main stem of 10 selected plants. Ears were counted in the harvested area and ear number m−2 was calculated. Numbers of seeds per ear were measured by counting and threshing 20 randomly selected ears in the harvested sample. Two groups of 300 seeds per plot were weighed. All harvested samples were then threshed and seeds were separated from residues and weighed to calculate grain yield. harvest index was calculated as the ratio of grain weight to total dry weight.
Analysis of variance was carried out for combined two-year analysis and least significant differences (LSD) calculated to separate cultivar means. To analyse changes in plant characteristics with time, data were combined across two years. For this purpose, means of each characteristics examined were plotted against cultivar's year of release and regression coefficients were examined for significance. A broken linear model analysis was undertaken to pick up changes in trends over the time period. A significant break was observed only for grain yield and harvest index. Simple correlations among measured traits were computed on the combined data across years to establish relationships.
RESULTS
Effect of year
Cultivar × year interactions were significant for grain yield, biological yield, harvest index, yield components and plant height, but there were no significant cultivars × year interaction for photosynthesis rate, transpiration and stomatal conductance (Tables 2, 3, 4). The weather in some months differed between years; precipitation distribution was even in 2006/7 and the temperature during April and May was higher in this year. This period coincides with the grain set and grain filling period of wheat in this region and different cultivars showed different responses to weather conditions.
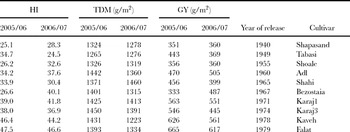
Grain yield(GY), total dry matter(TDM) and harvest index (HI, %) of cultivars for 2005/06 and 2006/07.

** Effects significant at p = 0.01 level.
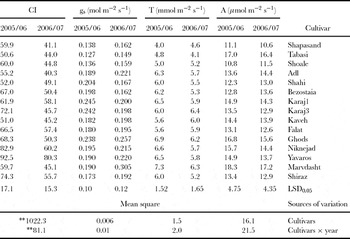
Photosynthesis (A), Transpiration (T), Stomatal conductance (gs) and chlorophyll index (CI) of cultivars for 2005/06 and 2006/07.

**Effects significant at p = 0.01 level.
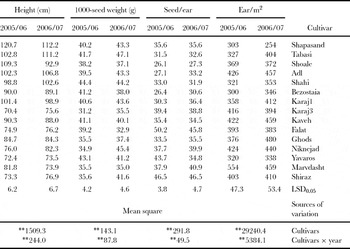
Yield components and plant height of cultivars for 2005/06 and 2006/07.

** Effects significant at p = 0.01 level.
Grain yield
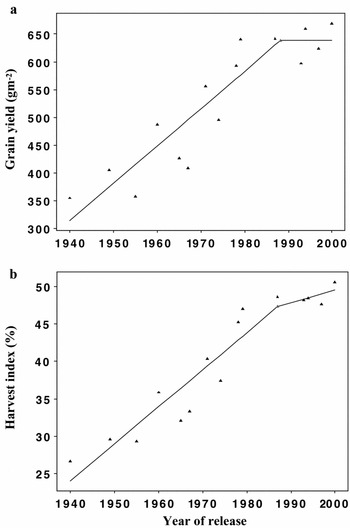
Mean grain yield in 2005/6 was 540 g m−2 and ranged from 351 g m−2 for Shapasand released in 1940 to 680 g m−2 for Shiraz released in 2000 (Table 2). In 2006/7 the mean grain yield was 517 g m−2 and ranged from 360 to 660 g m−2 for Shapasand and Shiraz respectively. The annual genetic grain yield gain was 0.86% (r = 0.878, p < 0.01) or 66.8 kg ha−1 y−1 (Figure 1a). In this period the main gain in yield improvement had been achieved after the 1970s when Karaj1 was introduced. The early 1970s coincided with the introduction and utilization of dwarfing genes in wheat breeding in Iran and considerably increased yield potential. In the 20 years since 1987 (when the break in yield trends was observed), there was little increase in grain yield (Figure 1a). The reasons for this yield plateau are complicated, although the most recent cultivars such as Shiraz show a yield advantage over previous cultivars (Table 2).
A broken-line model fitted to the grain yields (a) and harvest index (b) against year of cultivars release. Line equation for grain yield was y = 6.68x − 12672 with break point of 1987. Line equation for harvest index was y = 0.4942x − 935 before 1987 (break point) and y = 0.172x – 148.6 after 1987.

Biomass and harvest index
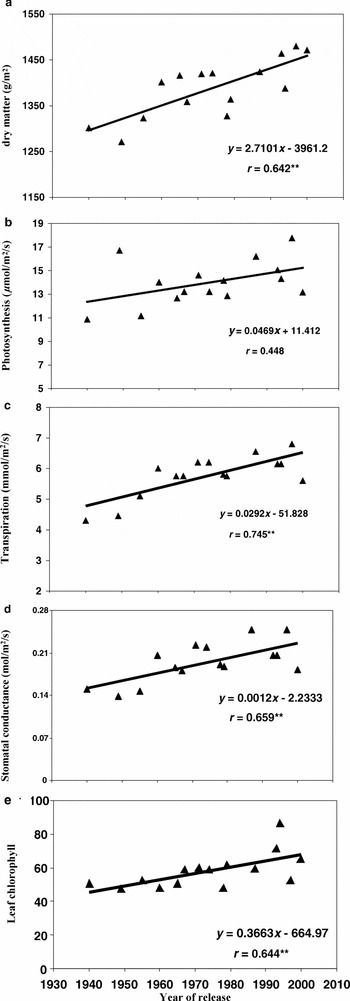
Both total dry matter and harvest index increased in new cultivars (Table 2). Shapasand and Tabasi had the lowest (25.1 and 24.5%) and Shiraz and Yavaros (52.9 and 49.3%) had the highest harvest index in the first and second year, respectively. Harvest index increased by 0.44% y−1 (r = 0.931, p < 0.01) over the past 60 years in the cultivars tested (Figure 1b). Besides a higher harvest index, new cultivars produced more dry matter in comparison with old cultivars (Table 2). Regression between year of cultivar release and biomass indicated that biomass production increased significantly in this period by 16 kg ha−1 y−1 or 0.11 % y−1 (r = 0.642, p<0.01) (Figure 2a).
Relationship between year of cultivar release and dry matter (a); photosynthesis (b); transpiration (c); stomatal conductance (d) and chlorophyll index (e).

Photosynthesis, stomatal conductance, transpiration and chlorophyll
In the first year of measurements, leaf photosynthesis rate at the flowering stage ranged from 10.8 to 18.6 μmol m−2 s−1 for Shoale and Marvdasht respectively. In the second year this trait ranged from 10.6 to 17.2 μmol m−2 s−1 for Shapasnad and Marvdasht, respectively. Although the photosynthesis rate was higher in new cultivars, some old cultivars such as Tabasi and Adl had high values for photosynthesis and therefore there was no constant relation between year of cultivar release and photosynthesis (Figure 2b). Transpiration rate and stomatal conductance were lower in old cultivars than new cultivars (Table 3). Leaf chlorophyll was also higher in new cultivars. Regression of these traits on year of cultivar release showed that there was a significant increase in stomatal conductance, transpiration rate and chlorophyll index during this period (Figure 2c, d, e). Increase in transpiration is the consequence of more stomatal conductance in new cultivars.
Yield components and plant height
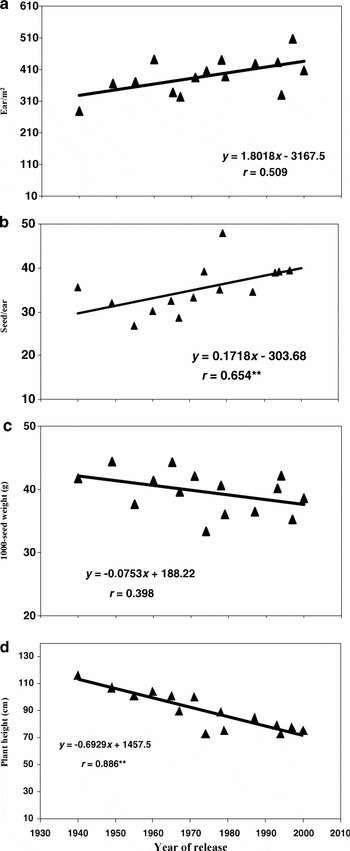
Number of ears m−2 ranged from 302 to 553 and from 254 to 480 in the first year and second year, respectively (Table 4). Shapasand had the lowest ear number in both years whereas Marvdasht in the first year and Ghods in the second year had the highest ear number. Although new cultivars generally produced more ears per unit area there was no significant correlation between this trait and year of cultivar release (Figure 3a). Seed number per ear was greater in new cultivars; Marvdasht and Shoale had the highest and lowest seed number per ear in both years (46.5 and 26.1 in the first year and 46.5 and 27.3 in the second year) (Table 4). Seed number increased by 2.1 seeds ear−1 y−1 or 0.45 % y−1 during this period (r = 0.654, p < 0.01) (Figure 3b). Some new cultivars such as Shiraz have a low number of ears m−2 but high seed number per ear which resulted in high grain yield in these cultivars, while cultivars with high numbers of ears produced lower numbers of seed per ear. This is because of compensatory effects between yield components. Over the two years of the experiment, 1000-seed weight ranged from 31 to 47 g (Table 4). There was no constant trend in seed weight and year (Figure 3c) and yield improvements were not associated with increased 1000-seed weight. New cultivars produced slightly lighter seed, a consequence of increased seed number in these cultivars.
Relationship between year of cultivar release and number of years per m2 (a); number of sees per ear (b); 1000-seed weight (c); and plant height (d).

In the first year, plant height ranged from 120.7 cm for Shapasand to 70.4 cm for Karaj3 and in the second year it ranged from 112.2 cm for Shapasand to 73.5 for Yavaros (Table 4). There was a significant reduction in cultivar height with year of release, by 6.9 cm y−1 or 0.6% y−1 (r = 0.886, p < 0.01) (Figure 3d). Considerable reduction in height was observed after the 1970s when Karaj3 was introduced. Before this date plant height was greater than 100 cm; after this date cultivar height changed only slightly.
Correlations
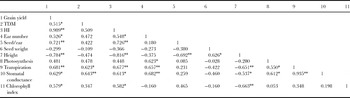
Grain yield was positively and significantly correlated with harvest index, seeds ear−1, ears m−2, transpiration rate (all p < 0.01), dry matter, stomatal conductance and chlorophyll index (all p < 0.05) and negatively correlated with plant height (p < 0.01) (Table 5). Harvest index, seeds per ear and plant height had the strongest correlation with yield improvement in this experiment. Plant height correlated negatively with harvest index and seeds per ear. There was no significant correlation between grain yield and photosynthesis rate or seed weight. Photosynthesis correlated significantly with stomatal conductance but not with grain yield.
Correlation coefficient between traits.

* and **: significant at p = 0.05 and p = 0.01.
DISCUSSION
Grain yield increased by 0.86% year−1 (57.8 kg ha−1 y−1) over the cultivar release period 1940–2000 and the main gain in yield improvement was achieved after the 1970s. This rate of yield improvement was lower than the 83 kg ha−1 y−1 reported by Zand et al. (Reference Zand, Kochaki, Rahimian-Mashadi and Nasiri-Mahallati2002); their experiment included fewer cultivars released over a 39-year period. Our results show significant increase in wheat grain yield in Iran and its progress was comparable to, and closer to the higher, achievements in other countries (Austin et al., Reference Austin, Bingham, Blackwell, Evans, Ford, Morgan and Taylor1980; Reference Austin, Ford and Morgan1989; Brancourt-Hulmel et al., Reference Brandcourt-Hulmel, Doussinalt, Lecomte, Berard, Buanec and Trottet2003; Sayre et al., Reference Sayre, Rajram and Fischer1997; Shearman et al., Reference Shearman, Sylvester-Bradley, Scott and Foulkes2005; Waddington et al., Reference Waddington, Ranson, Osmanza and Saunders1986; Zhou et al., Reference Zhou, He, Sui, Xia, Zhang and Zhang2007a; Reference Zhou, Zhu, Cai, He, Zhang, Xia and Zhang2007b).
Total dry matter and harvest index increased significantly over the 60 years of breeding Iranian wheat cultivars. The highest value of harvest index observed in this experiment was 52.9% and the mean harvest index in high yielding cultivars was about 50%, below the maximum 60% value predicted by Austin et al., (Reference Austin, Bingham, Blackwell, Evans, Ford, Morgan and Taylor1980). This suggests that grain yield can still be improved by increasing harvest index; after this dry matter production must be increased. According to Fischer (Reference Fischer2007) the harvest index in wheat cultivars is still well below its limiting value. This leaves room for improvement, but for this it is necessary to understand what the limitations are. Significant increase in harvest index of Iranian wheat cultivars mainly occurred in the early 1970s, largely because of the successful utilization of dwarfing genes. In recent years the rate of improvement of harvest index has slowed down (Figure 1b).
Although some experiments have reported unchanged total dry matter production during yield improvement in wheat (Austin et al., Reference Austin, Bingham, Blackwell, Evans, Ford, Morgan and Taylor1980; Brancourt-Hulmel et al., Reference Brandcourt-Hulmel, Doussinalt, Lecomte, Berard, Buanec and Trottet2003; Sayre et al., Reference Sayre, Rajram and Fischer1997), in our experiment a significant increase was observed over 60 years of wheat improvement. Zand et al. (Reference Zand, Kochaki, Rahimian-Mashadi and Nasiri-Mahallati2002) also showed that total biomass correlated significantly with grain yield and increased by 86 kg ha−1 y−1. This increase is much more than in the present experiment because Zand et al. did not include the older cultivars that had few changes in biomass with time. Similar findings for genetic progress in grain yield associated with total biomass have been reported for recent wheat releases in the CIMMYT (Reynolds et al., 1999; Singh et al., 1998) and other parts of the world (Shearman et al., Reference Shearman, Sylvester-Bradley, Scott and Foulkes2005; Waddington et al., Reference Waddington, Ranson, Osmanza and Saunders1986). Present findings indicate biomass progress resulted from greater pre-flowering growth and radiation use efficiency (Shearman et al., Reference Shearman, Sylvester-Bradley, Scott and Foulkes2005).
There was no clear trend in the photosynthesis rate of new and old cultivars, but transpiration rate and stomatal conductance increased significantly in newer cultivars. Increase in stomatal conductance and leaf chlorophyll without any changes in photosynthesis rate means that other factors may limit photosynthesis in new cultivars. Although photosynthesis is generally considered the main process controlling plant growth and productivity, the relationship between photosynthesis and yield is complex. For example, Evans and Dunstone (Reference Evans and Dunstone1970) reported a negative correlation between photosynthetic rate and grain yield in wheat. On the other hand Fischer et al. (Reference Fischer, Ress, , Lu, Condon and Larque-Savedra1998) showed that yield progress across short wheats released between 1962 and 1988 was closely associated with increased photosynthetic rate and stomatal conductance. In other crops such as soybean (Buttery et al., Reference Buttery, Buzzell and Findlay1981; Morrison et al., Reference Morrison, Voldeng and Cober1999; Wells et al., Reference Wells, Schulze, Ashley, Boerma and Brown1982) and rapeseed (Miri, Reference Miri2007) significant correlation was observed between leaf photosynthesis rate and grain yield. These varied results on the relation of photosynthesis and yield may confirm the rarity of correlation of single leaf photosynthesis (v. canopy photosynthesis) to grain yield. It is also clear that more study is needed to understand the physiological basis of yield association with the rate of photosynthesis.
Among yield components seed number ear−1 correlated positively with grain yield and explained most of the variation in grain yield between cultivars; improvements in grain yield appear to be partially the result of more seeds per ear or the result of an increased sink size. This can be attributed to the effects of dwarfing genes in wheat (Fischer and Stockman, Reference Fischer and Stockman1986; Slafer et al., Reference Slafer, Andrade and Satorre1990). In Iran, as in many other parts of the world, the utilization of dwarfing genes increased the numbers of seeds per ear, which was attributed to a greater partitioning of dry weight to spikes until the end of the spike growth period (Slafer et al., Reference Slafer, Andrade and Satorre1990). The results of the present study are in agreement with other reported observations (Austin et al., Reference Austin, Ford and Morgan1989; Abbate et al., Reference Abbate, Andrate, Lazaro, Briffi and Berardocco1998; Shearman et al., Reference Shearman, Sylvester-Bradley, Scott and Foulkes2005; Royo et al., Reference Royo, Alvaro, Martos, Ramdani, Isidro, Villegas and García del Moral2006). Ear number also correlated positively with grain yield but there was no correlation between seed weight and grain yield, and seed weight was somewhat less in new cultivars. This may be due to an increased seed number per plant.
Plant height declined significantly over the period of yield improvement in Iran. Recent cultivars in Iran reached a plateau for height and lodging has not been seen in new cultivars. Other reports that show that plant height has been reduced significantly during yield improvement in wheat (Cox et al., Reference Cox, Shroyer, Liu, Sears and Martin1988; Sayre et al., Reference Sayre, Rajram and Fischer1997; Brancourt-Hulmel et al., Reference Brandcourt-Hulmel, Doussinalt, Lecomte, Berard, Buanec and Trottet2003; Zhou et al., Reference Zhou, He, Sui, Xia, Zhang and Zhang2007a, Reference Zhou, Zhu, Cai, He, Zhang, Xia and Zhangb).
In conclusion, the results of the present study showed grain yield of wheat increased by 57.8 kg ha−1 y−1 or 0.86% y−1 over the past 60 years of breeding. The period of rapid yield increases was during the release of Karaj1 (early 1970s) followed by a plateau. This plateau may be because of a focus on disease resistance (such as rust) rather than on grain yield improvement. For instant, susceptibility to rust is one of the most limiting factors for cv Falat production, whereas this problem has been solved in later cultivars. Therefore, the differences between new and old cultivars in non-optimum condition will be large. The grain yield improvements are mainly due to increasing harvest index, increased seed number per ear and reduction in plant height. Harvest index, the main cause of yield improvement in wheat, is already above 50% in the most recent Iranian wheat cultivars, which is considerable in comparison with other parts of the world (Fisher, Reference Fischer2007; Foulkes et al., Reference Foulkses, Snape, Shearman, Reynolds, Gaju and Sylvester-Bradley2007). Assuming a maximum limit value of 60% for this trait (Austin et al., Reference Austin, Bingham, Blackwell, Evans, Ford, Morgan and Taylor1980), grain yield can still be increased through an increase in harvest index. Dry matter also increased during this period and it must continue to increase in the future.